Original Author: Glassnode
Original Translator: AididiaoJP, Foresight News
Bitcoin has rebounded to nearly $76,000, primarily benefiting from ETF fund inflows and a revival in spot buying. Currently, short positions remain crowded, with funding rates continuing to be negative, while pressure in the options market has eased — all of which indicate that the market environment is improving, but it is still too early to form firm beliefs.
Key Points
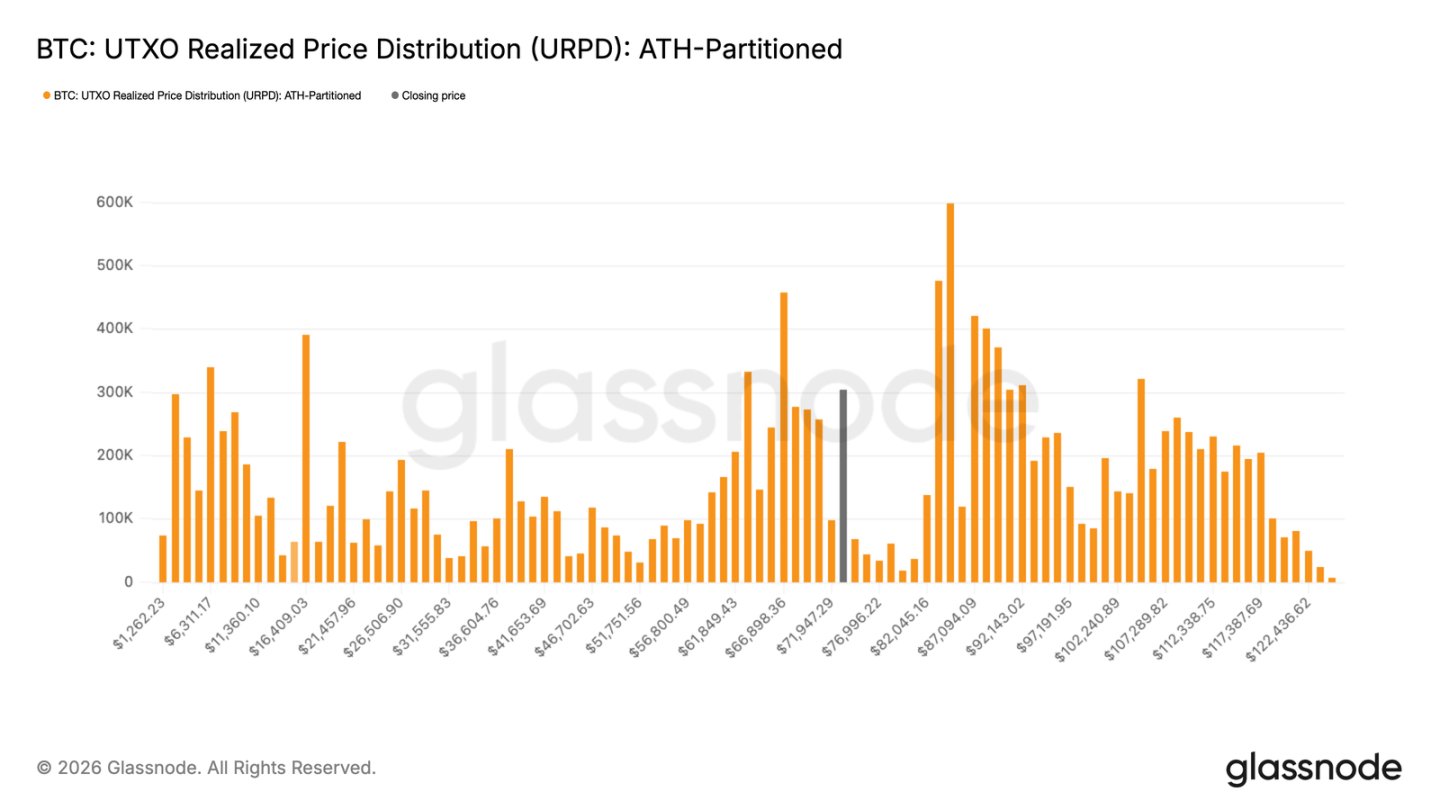
- Bitcoin has broken through $70,000, entering a "vacuum zone" between $72,000 and $82,000. From the URPD indicator, there is almost no resistance on-chain until approaching the upper limit of $82,000 where decent selling pressure will be encountered.
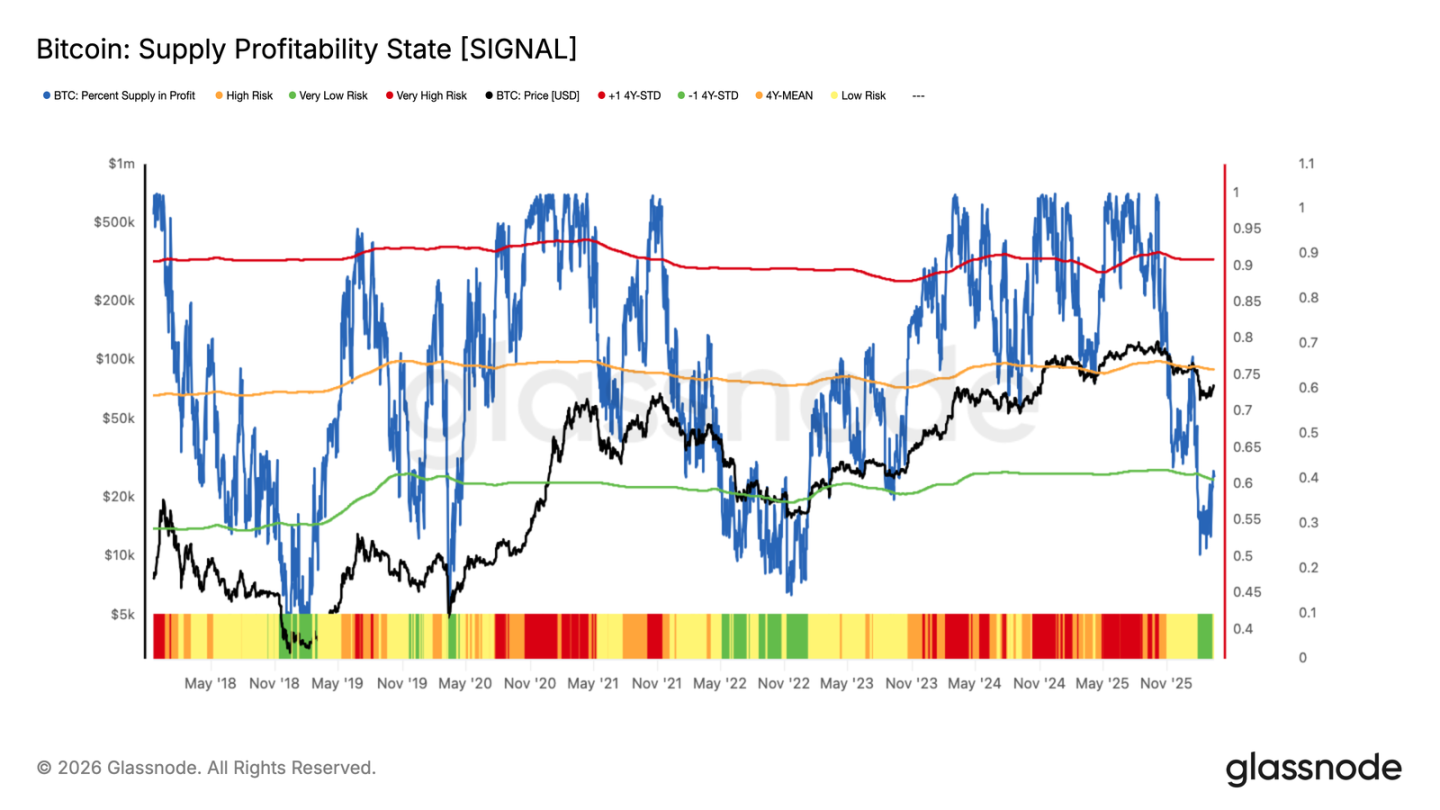
- The "Profit Supply Ratio" has rebounded to around 60%. Historically, this level often corresponds to exhaustion after the first rebound from the cycle bottom. To confirm that the bull market has truly arrived, this indicator needs to remain steadily above 75%.
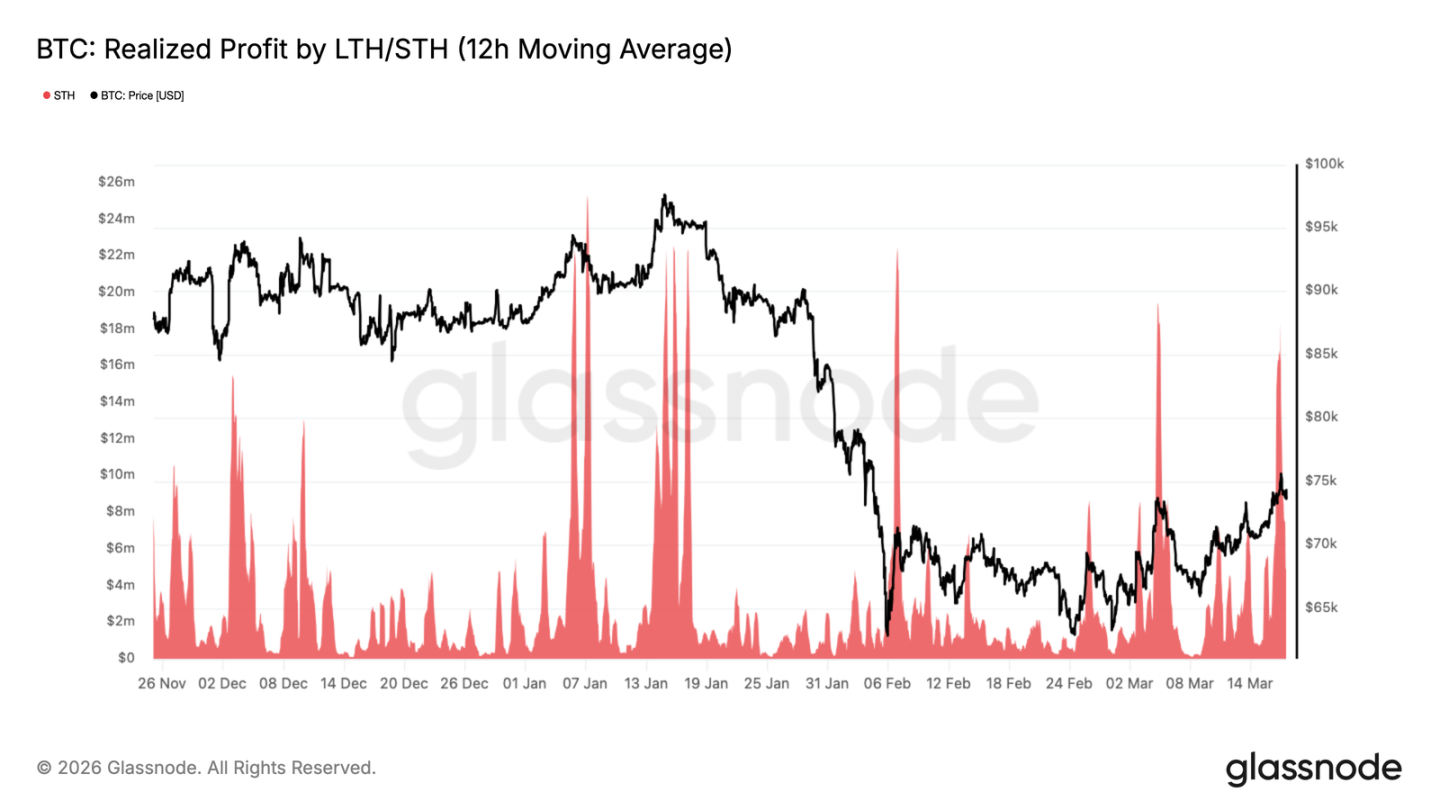
- As the price approaches $74,000, the "profits realized by short-term holders" surged to $18.4 million per hour, mirroring the situation in February — short-term holders continue to sell off during the rise. The next focus is whether the market can absorb this selling pressure above $70,000, which is crucial for a potential push to $78,000 to $82,000.
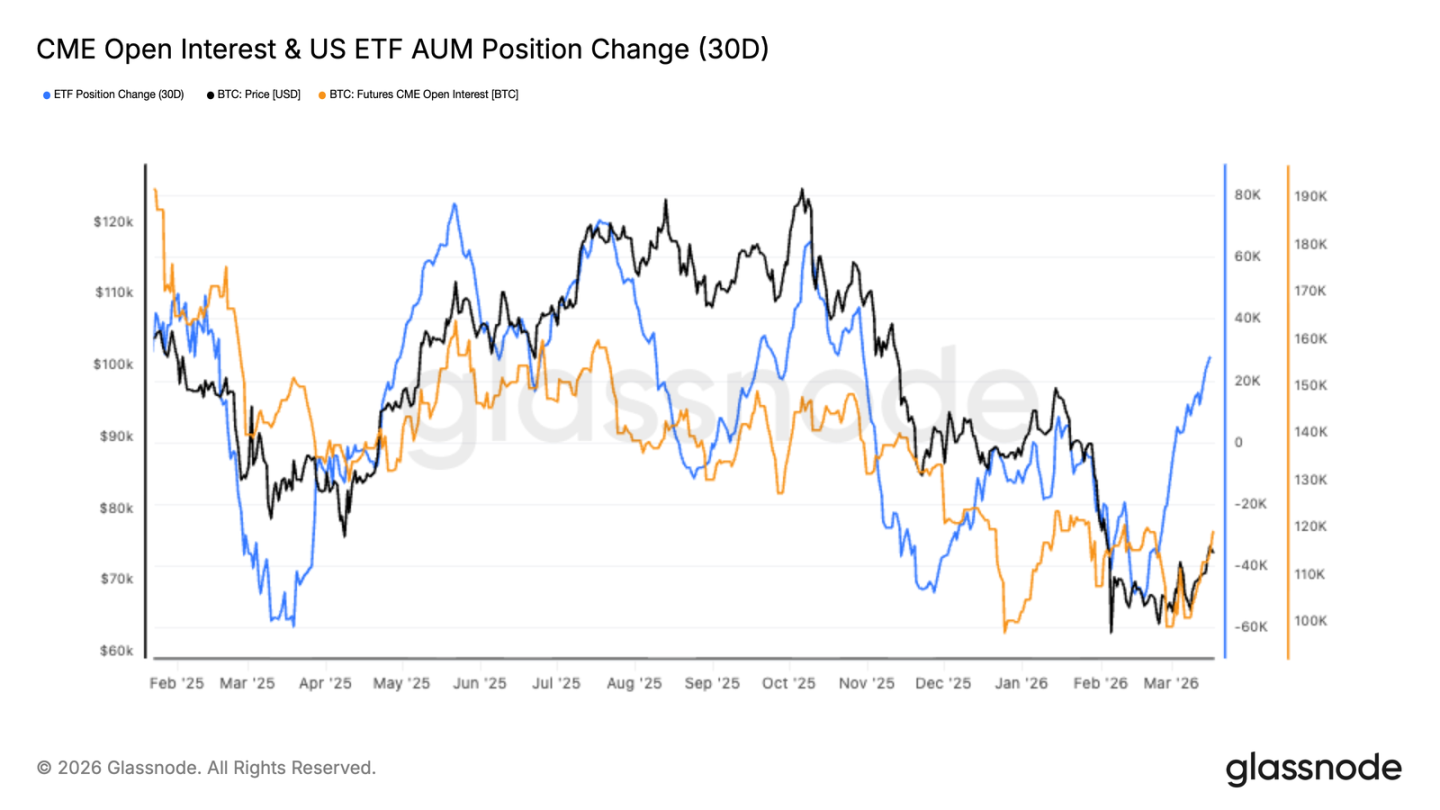
- Over the past month, ETF capital inflow has shown a significant rebound, indicating that institutional demand is returning, and the market is once again driven by spot purchases.
- CME futures open interest remains low, suggesting that this rise is mainly driven by spot buying, not leveraged speculation.
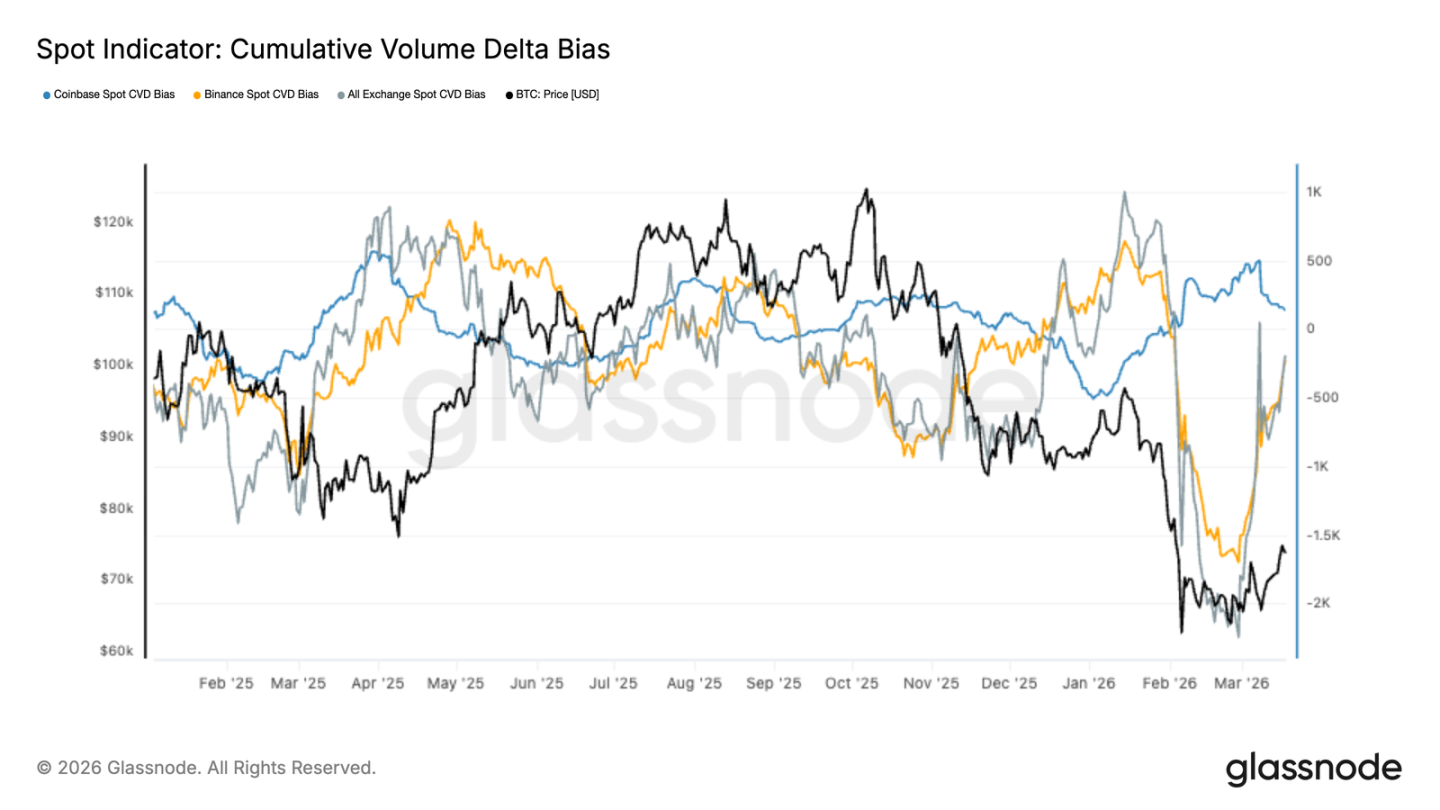
- The "Spot Accumulative Trading Volume Delta" across major exchanges has turned upward, indicating that the previous continuous selling pressure has shifted into new buying accumulation.
- Spot activity on Coinbase has stabilized and warmed — this often signals that institutions are starting to re-enter the market. The selling pressure on Binance has also clearly weakened, as the strong selling force from the prior declines has basically dissipated.
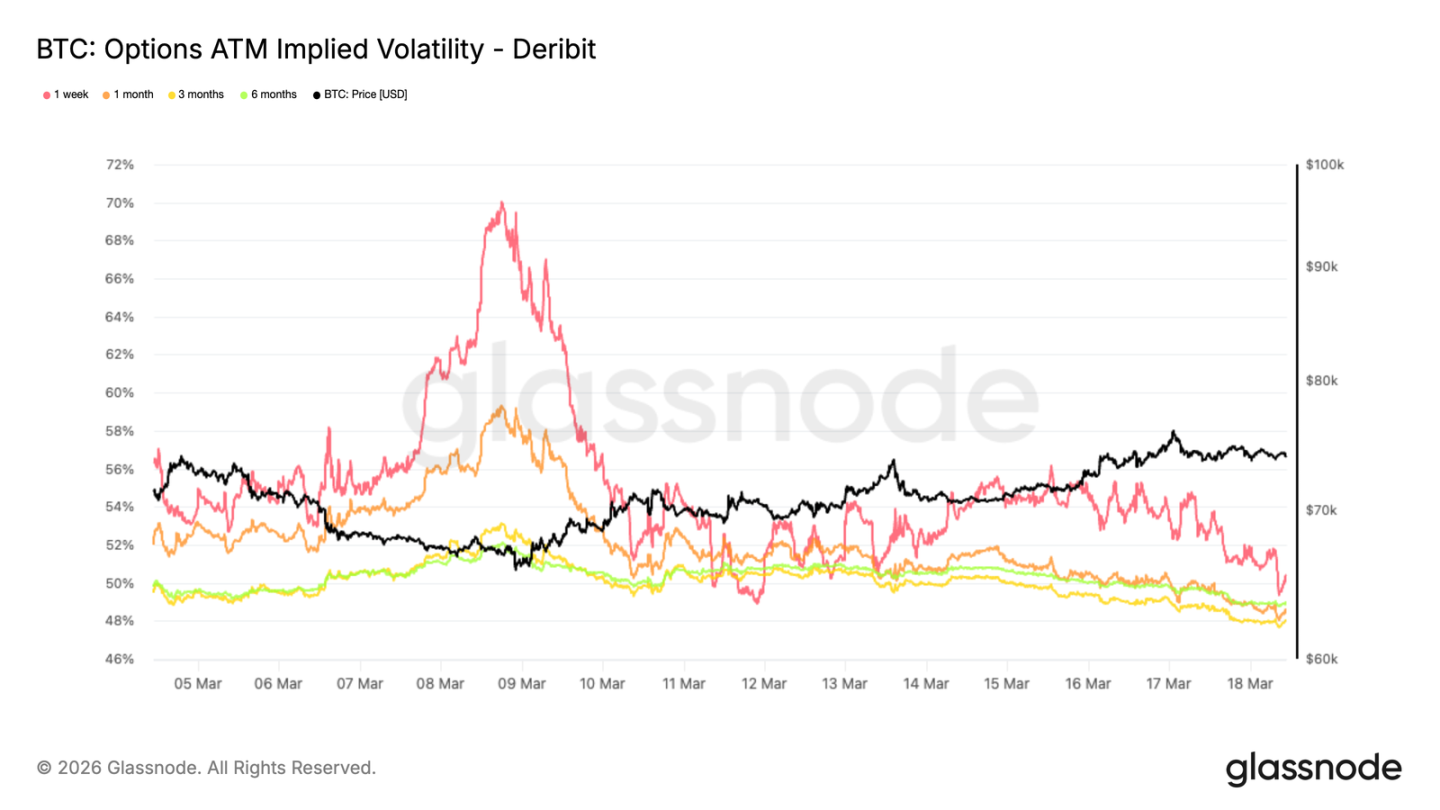
- The implied volatility across various maturities is decreasing, indicating reduced hedging demand and a return to normalcy in the market.
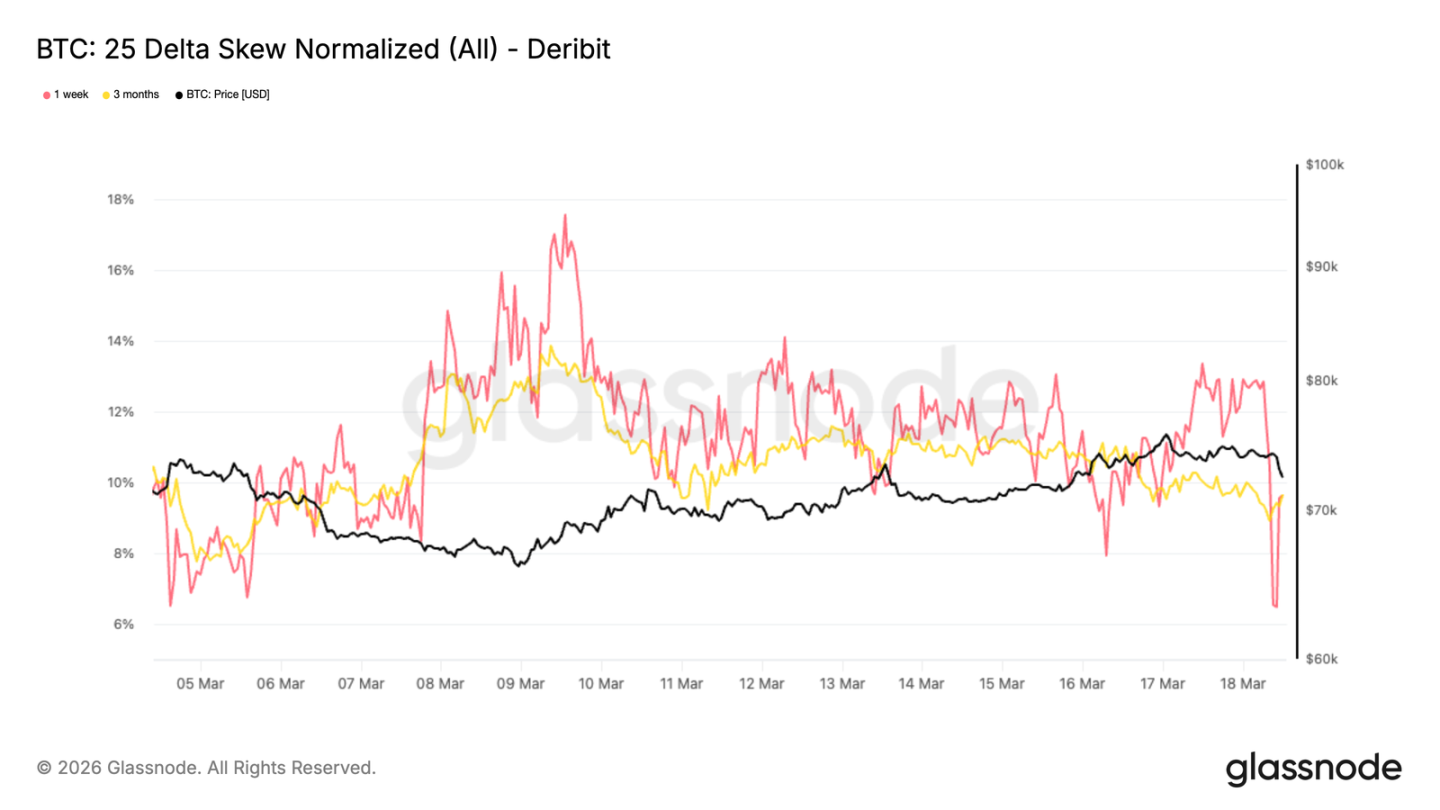
- The options skew indicator has slightly turned positive, indicating that some have started to position for upward movements, and sentiment is improving.
- Market makers' gamma positions are nearing neutrality, suggesting that options will not amplify market volatility in the short term.
On-Chain Data Interpretation
Finally Breaking Out of the Dense Zone
After several weeks of fluctuations, Bitcoin has finally stabilized above $70,000, now near $74,000, breaking through the consolidation range from February to March. The URPD indicator clearly shows this — it reflects at what price levels people are buying coins; where more buyers are present marks levels of support or resistance.
Data indicates a large accumulation of positions between $59,000 and $72,000, primarily established in February and March 2026, and the current price has now stepped above this dense accumulation area. Higher up, between $72,000 and $82,000 lies a vacuum zone, where few bought previously, thus there is effectively no resistance when pushing upward. This breakout occurred amidst geopolitical uncertainties and a resilient external market, indicating that investors currently view macroeconomic negatives as temporary. Regardless of the long-term path, short-term fluctuations will likely occur between $72,000 and $82,000.
A Single Rebound Indicates Nothing
Although it has broken above $70, entering the vacuum zone of $72,000 to $82,000, one single rise is not sufficient to indicate a structural reversal. To assess the market's health, it is vital to see whether participants are profiting — the "Profit Supply Ratio" indicator is particularly useful as it tracks how many bitcoins are currently in profit.
Historically, moving from the bear market bottom to the early stages of the bull market, this indicator typically climbs from below 60% at -1 standard deviation to around 75%, the long-term average. The current rise has pushed it to around 60%; viewed historically, this position often indicates exhaustion after the first rebound. A stable hold above 75% would indicate a genuine possibility of entering a bull market; lingering in the current range would suggest it's still an old script of bear market rebounds.
Observing How the Market Digests Selling Pressure
In addition to monitoring the number of people at a profit, another important perspective is observing how the market digests realized profits — when prices rise, there are always sellers. If recent buyers sell off but the price does not crash back to the dense area of $59,000 to $72,000, the chances of moving upward increase significantly. This week, when prices surged above $74,000, the 12-hour moving average of "profits realized by short-term holders" skyrocketed to $18.4 million per hour, identical to February — back then, as soon as it reached $70, there were sellers, and it couldn't break through.
Such early rebounds in a bear market often see newly bought positions lacking conviction; they want to exit at the slightest profit. Over the next few weeks, if the market can withstand this wave of selling pressure and stabilize above $70,000, the probability of pushing towards $78,000 (real market average) and even $82,000 (upper edge of the vacuum zone) will increase.
Off-Chain Data Analysis
Institutions Are Quietly Re-entering
This rebound in Bitcoin aligns well with a significant recurrence in the allocation of U.S. spot ETFs — the 30-day change in holdings has reversed the previous outflows, turning upwards. This indicates that institutional demand is indeed returning, and capital is once again being allocated to spot purchases.
Meanwhile, CME futures open interest remains sluggish, having just halted its decline. This wave of increase is primarily spurred by spot purchases, not leveraged bets. Historically, this structure is healthier: prices are pushed up by real capital, rather than speculative bubbles inflated by leverage.
The size of ETFs is increasing while futures positions remain unchanged — this indicates that institutions are just starting to re-enter the market. If CME's positions increase subsequently, it would suggest that confidence is strengthening, and the upward trend will be more stable.
Spot Buying Has Returned
The "Spot Accumulative Trading Volume Delta" has recently shown a clear rebound, and Binance has now also commenced net buying.
This turning point coincides with Bitcoin rebounding from the low of $60,000, indicating that this increase is indeed supported by real capital rather than merely derivatives pushing it up. Coinbase's accumulated trading volume Delta has also stabilized and risen — this area usually represents institutional activity, indicating that some are again stockpiling.
Data across major exchanges is improving, suggesting that market depth is recovering and buyers are beginning to regain confidence. Although it has not reached a euphoric stage, the market has shifted from distribution to accumulation, effectively providing a more stable base for prices — this is key for a sustainable rebound.
Funding Rates Show: Everyone Loves to Short
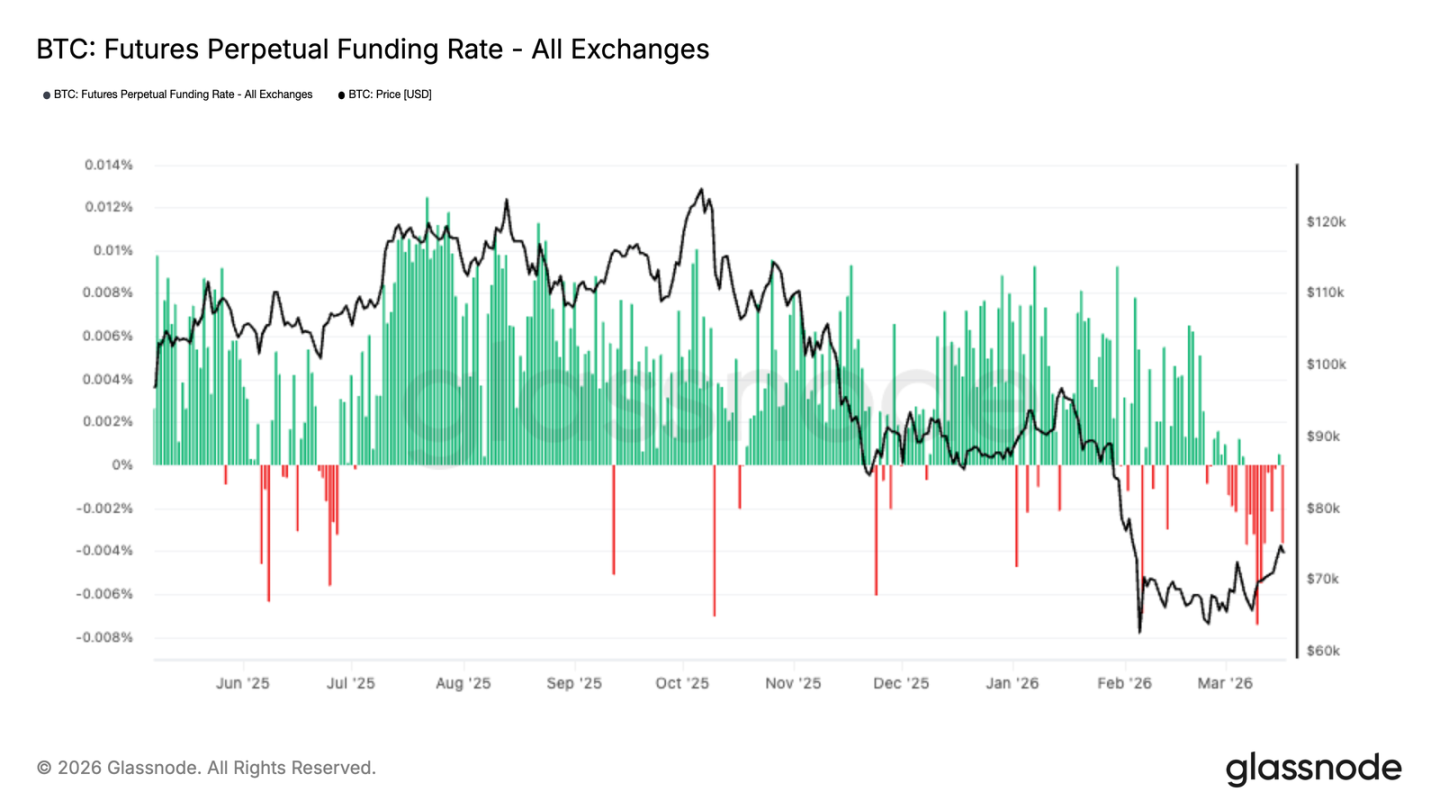
In recent weeks, the funding rates for perpetual contracts have plummeted to negative values — indicating that those looking to short have gained an absolute advantage in the derivatives market. This bearish sentiment accumulated during the oscillation between $60,000 and $70,000, with leveraged players generally pessimistic about the future.
Interestingly, the breakthrough above $74,000 happened against a backdrop of continuously negative funding rates. What does this imply? It suggests that part of this rise is due to shorts covering rather than aggressive longs driving the price up.
This situation often means that shorts are already crowded, potentially susceptible to a short squeeze. If prices rise, shorts being forced to liquidate could further propel the market higher. In the short term, this indeed provides a bullish outlook, but to establish a sustained trend, we still need to wait for funding rates to normalize and for a rebalancing between long and short positions.
ATM Implied Volatility Contraction
Bitcoin's volatility shock is dissipating. One-week implied volatility has decreased from around 56% at the beginning of the week to now 50%, with longer maturities also generally dropping by about 3 percentage points.
This indicates that traders are no longer as tense as before; the wave of panic-induced volatility has passed. A decrease in implied volatility usually signifies a transition from a state of stress to a relatively stable period in the market.
The signals are clear: participants are gradually withdrawing panic hedges. We are observing a significant number of downside protections being dissolved, which is one reason for the decline in implied volatility, and it has inadvertently fueled this rebound. The market is moving towards a more balanced state. In an environment where both spot and derivatives trading are relatively light, options hedges may become an important force influencing prices — at present, the upward path appears smoother.
25 Delta Skew Approaching Neutrality
After normalizing implied volatility, the skew is also adjusting. The 25 delta skew is currently negative, hovering around -10% across different maturities, down 4 to 7 percentage points from previous highs.
Negative skew indicates that put options are still more expensive than call options — suggesting that participants still wish to buy protection, and market makers are hesitant to sell downside volatility too cheaply.
However, the skew is gradually leaning towards neutrality. This change indicates that demand for downside hedges is starting to weaken, and defensive positions are decreasing.
In other words, put options are relatively less expensive now. This adjustment typically occurs when the market begins opening up for upward movements, but the macro-outlook remains unclear, and sentiment is still cautious.
The current skew state indicates that the market is transitioning from panic protection to a more balanced options structure while also preparing for potential tactical rebounds.
Options Flow is Starting to Warm Up
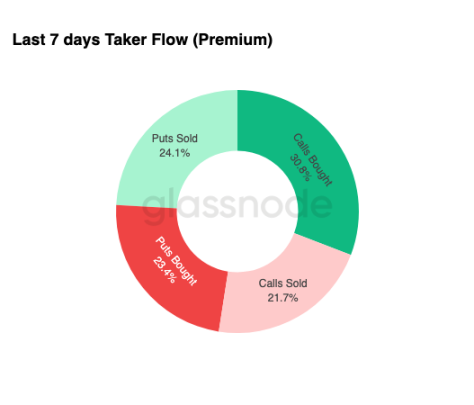
The change in sentiment is also evident in options trading. Recently, trades with positive Delta accounted for 54.9%, with 30.8% being purchases of call options — participants are once again using call options to bet on upward movements, as the downside risk is limited.
At the same time, we see a significant number of downside protections being closed. When traders close positions, market makers have to buy back to hedge, and this buying also provides price support.
These are typical characteristics of a transitional period — participants are starting to position for rebounds but still maintain some defensive positions, indicating a cautious yet slightly optimistic overall sentiment.
As for whether this is a structural shift or just short-term speculation, it remains to be seen.
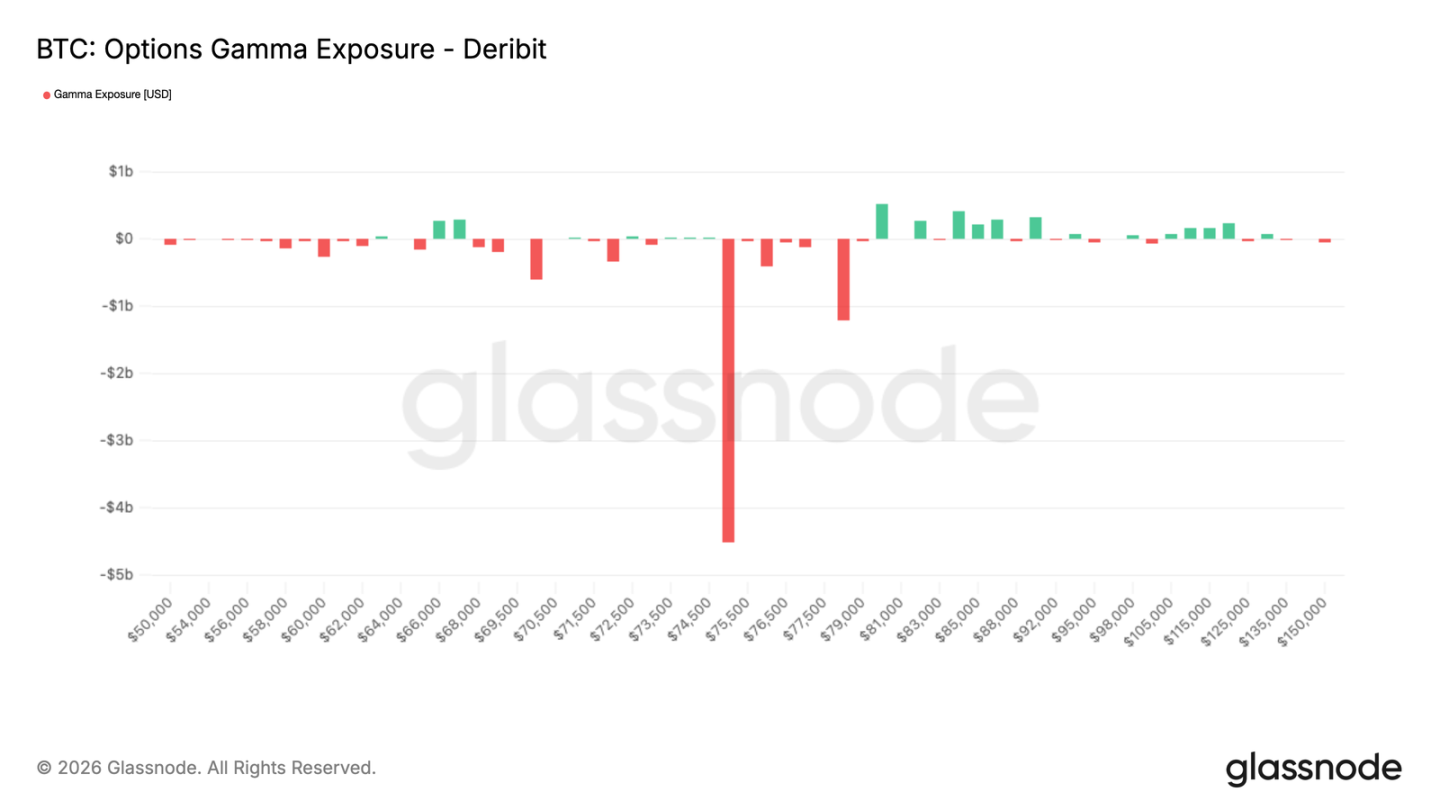
Negative Gamma Concentrated at $75,000
Lastly, let’s focus on the most important indicator: the market makers' gamma exposure. With thin trading, market makers' hedging activities can easily draw prices towards a key strike price.
The only meaningful point currently is $75,000 — there is approximately $4.5 billion of negative gamma piled up here. Bitcoin is currently trading below this level, and a slight upward movement could trigger market makers' buying hedges, consequently pushing the price toward $78,000 or higher.
The $75,000 checkpoint is crucial before the March options expiration — because out of that $4.5 billion, $3.9 billion expires this month. Once this quarter's expiration passes, market makers' hedging positions will be unwound, and consequently, upward movements may not be as smooth, with the market possibly entering a consolidation or pullback phase, returning to the main macro narrative.
Conclusion
The current rebound in Bitcoin is approaching $75,000, with increasingly tangible support behind it — ETF fund inflows, and warming Accumulative Trading Volume Delta, indicate that both institutions and retail are re-entering the market. The market has transitioned from the previous "distribution mode" to "accumulation mode," effectively providing a more stable foundation for prices.
On the other hand, the derivatives market is still in a defensive state. Continuous negative funding rates indicate that shorts are crowded — which may potentially fuel upward movements through short covering. The options market is stabilizing as well, with decreasing volatility and slightly reversing skew signaling improving sentiment, though not yet reaching a gambling frenzy. Overall, there is still upward potential in the short term, but for a lasting trend to develop, we will need to see whether capital continues to flow in, and whether leverage and belief can keep up.
免责声明:本文章仅代表作者个人观点,不代表本平台的立场和观点。本文章仅供信息分享,不构成对任何人的任何投资建议。用户与作者之间的任何争议,与本平台无关。如网页中刊载的文章或图片涉及侵权,请提供相关的权利证明和身份证明发送邮件到support@aicoin.com,本平台相关工作人员将会进行核查。


