Welcome to the Qinglan Crypto Classroom, I am Sister Qinglan. Let’s get right into the essentials! Today we will continue our analysis from four cycles, all practical talk!
Step 1: Trend Determination
Let’s look from the big to the small!
Daily Cycle: The trend is upward, the bullish arrangement is quite clear! MA5 is at 73385, MA10 is at 71697, both are firmly above MA30’s 68882. Key resistance levels are around 74909 and 76000, which is the previous high. Support levels are at 72270 and 73399. The on-chain data shows a total market capitalization of 2.6 trillion, but it has dropped by 1.59% in 24 hours, a bit of a shrink. News mentions that ETFs are continuously attracting capital, which is a long-term positive, but the market sentiment is "fear" at 26, prices are rising so high but sentiment is afraid, this divergence deserves our attention!
4-Hour Cycle: The trend is a high-level consolidation, moving averages are intertwined, MA5 and MA10 are both above 74000. Key resistance is at 74893 and 76000, support is at 73871 and 73535. MACD shows a dead cross, but the bars are narrowing, indicating that the downwards momentum is weakening. The news mentions Bitcoin consolidating at high levels before the Federal Reserve resolution, which totally aligns with what we see in the consolidation, the market is waiting for news!
1-Hour Cycle: The short-term trend is slightly bearish as MA5 is at 74052 and MA10 is at 74317, which is a bearish arrangement. Resistance is at 74452 and 74893, support at 73841 and 73560. The on-chain fear index is at 26, indicating fear, under this sentiment the hourly line is weakly rebounding and tends to drop, the price is hovering around 74000.
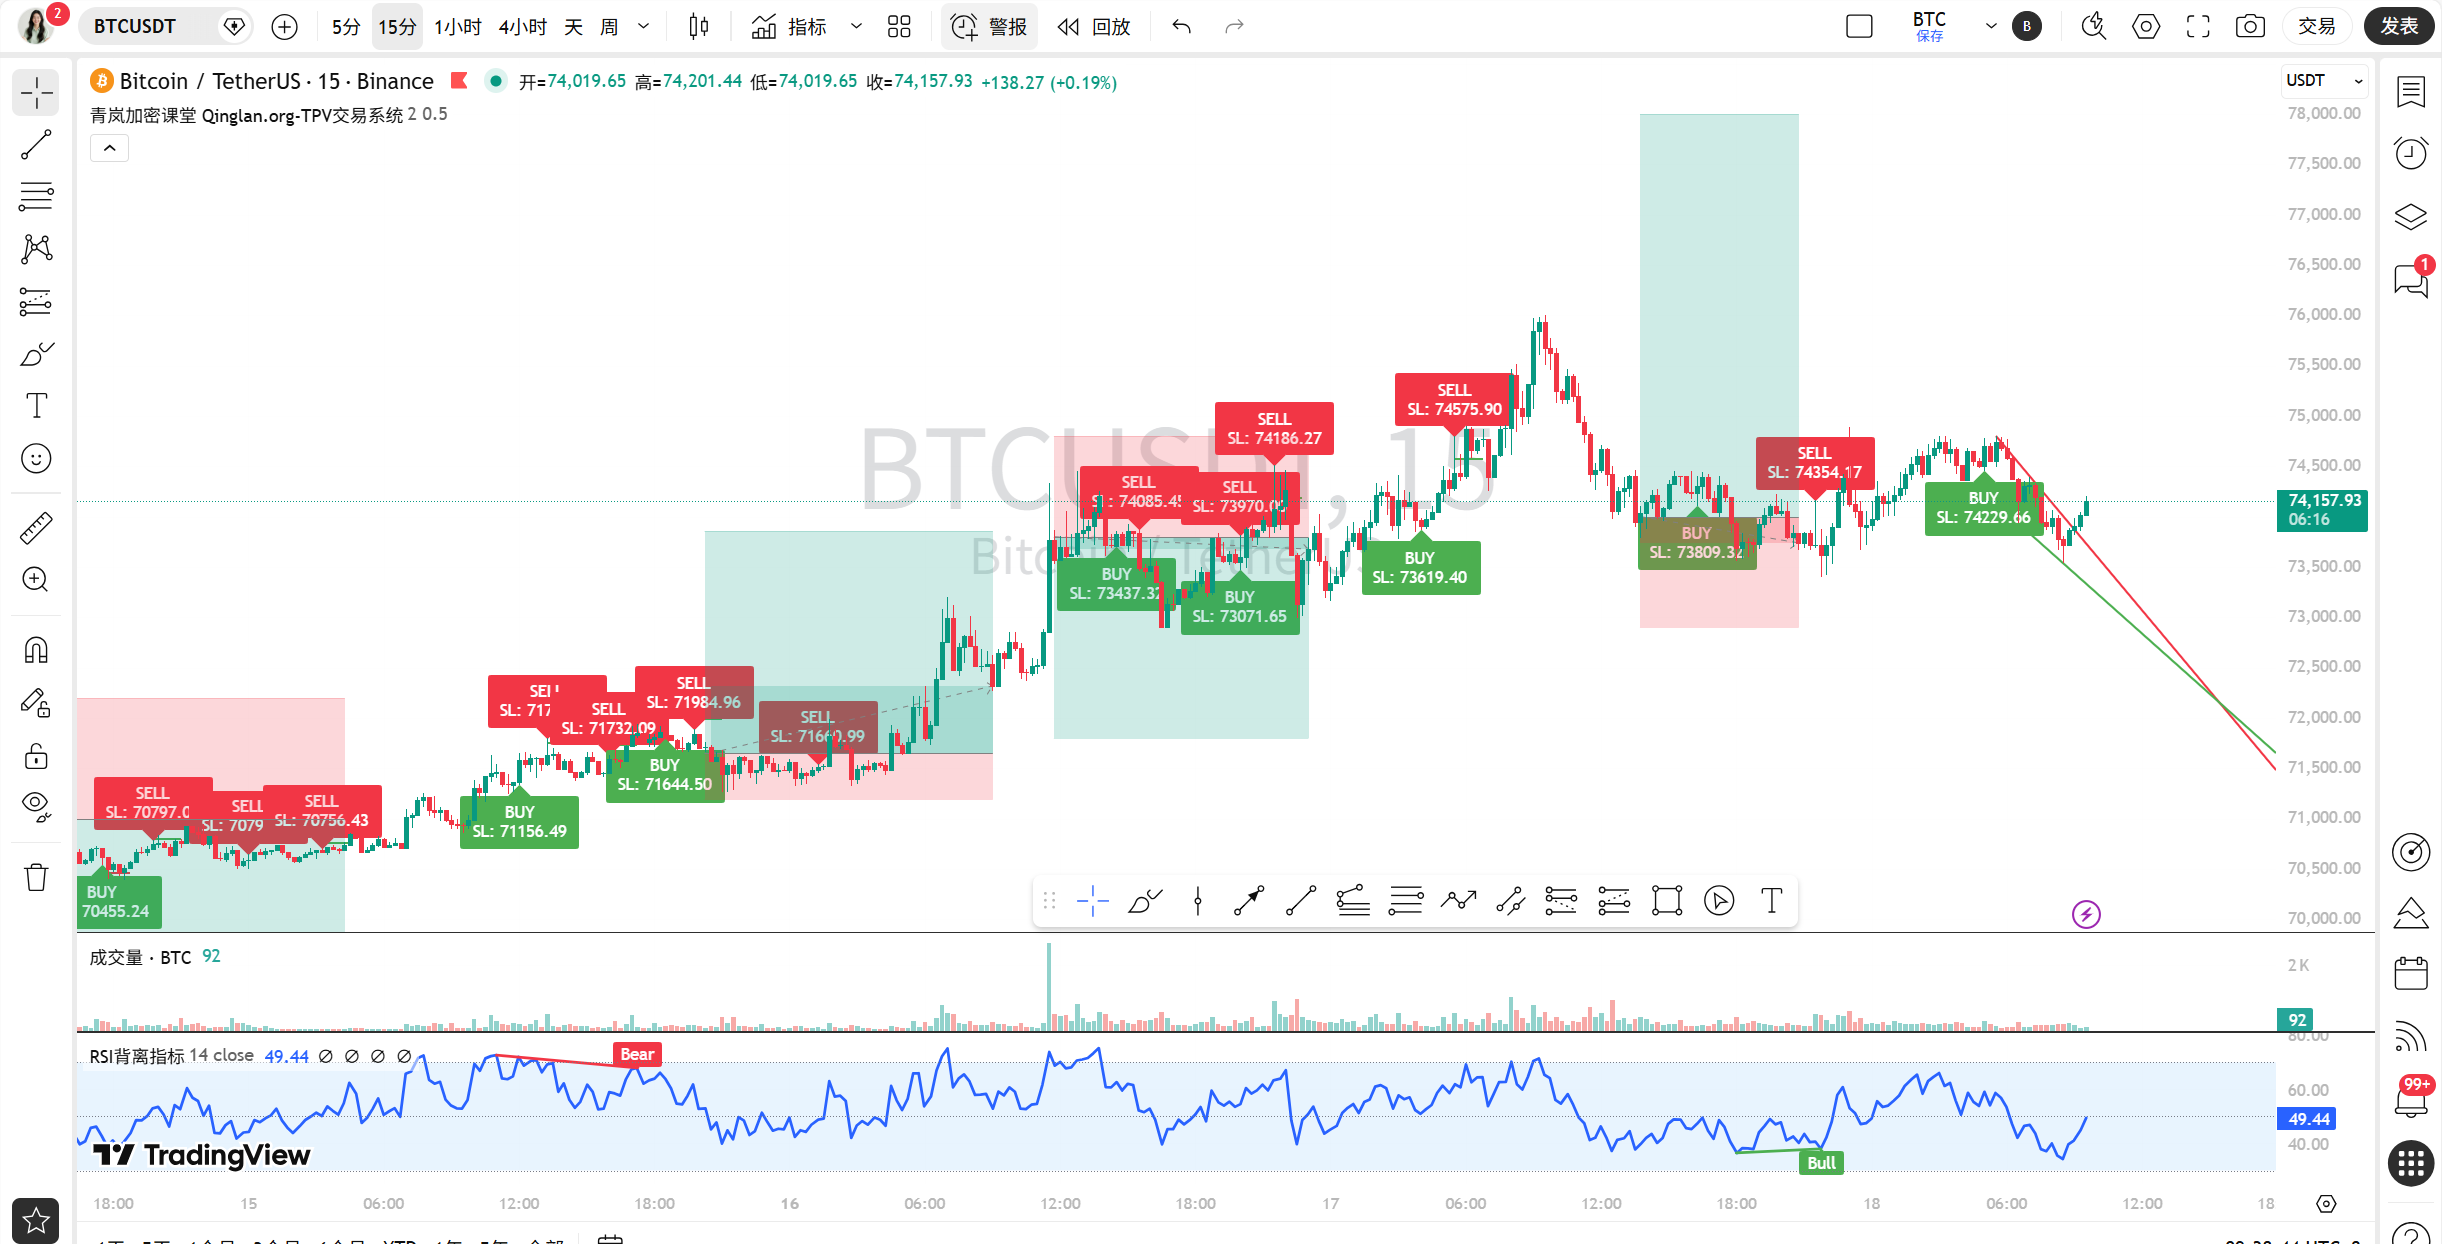
15-Minute Cycle: In the ultra-short term, it’s consolidation as well, moving averages are also intertwined. Resistance is at 74249 and 74403, support is at 73937 and 73729. MACD has just formed a minor golden cross, but RSI is only at 48, neutral and slightly weak. The news states “Where will BTC consolidation go?”, the 15-minute chart reflects this entanglement, both bulls and bears are testing.
Step 2: Key Levels Identification and Reversal Patterns
Daily: No significant reversal pattern is visible for now, but the price is operating below the previous high of 74909, if it can't go up, a double top might form! This position is exactly related to the news stating "6.8 to 8 thousand dollars consolidation" on the upper edge.
4-Hour: We should focus on a potential "head and shoulders" right shoulder, the left shoulder at 74893, head at 76000, and right shoulder may form around 74500. If it breaks the neck line near 73500, the pattern will be validated. The Fed's resolution could act as a catalyst.
1-Hour: A small box-shaped consolidation has formed between 74000-74400, breaking either side could result in a move. The news regarding "whales shorting with 5x leverage" may be betting on this box to break down.
15-Minute: Several small “double bottoms” emerged, for example near 73729, but the level is too minor and needs validation from a larger cycle. The current price is at 74100, testing the upper edge of this small box.
Step 3: Technical Indicators Verification
Daily MACD: DIF is positive, bars are quite large, indicating a strong trend. However, RSI is at 54.29, not overbought, still room for upward movement. The on-chain transaction volume shows little change, indicating that the indicators are reliable.
4-Hour MACD: Dead cross observed, but the bars at -25 are very small, lacking momentum. RSI is at 69.69, close to overbought, there is pressure for correction. Considering the shrinkage in total market capitalization, this dead cross signal should be taken seriously.
1-Hour MACD: Both DIF and DEA are positive, but the bars are negative at -59, which is called a “top divergence” prototype, with no new highs in price and decreasing momentum. RSI at 55 is neutral, confirming fatigue in the upwards movement.
15-Minute MACD: A golden cross has occurred, with bars turning positive at 4.18, this is a short-term rebound signal. RSI is 48.11, not yet in the strong zone. Combined with the news “whales are aggressively buying BTC”, a small rebound may occur in the short term, but volume is key.
Step 4: Comprehensive Analysis of On-Chain and News Factors
News Factors:
Positive factors: Continuous capital attraction from ETFs (both Bitcoin and Ethereum are flowing in), SEC new regulations providing a clear framework, whales increasing their Bitcoin holdings by 150 million dollars in a week, and Stacks upgrades boosting processing capacity. These provide a cushion for the medium to long term.
Negative factors: Upcoming Fed resolution brings uncertainty, whales using high leverage to short, fear and greed index in fear, slight decline in total market capitalization. These make short-term funds cautious.
Impact: Positive news supports the bullish trend on the daily chart, hence a significant drop is difficult. However, negative news, particularly from the Fed and fear sentiment, directly leads to the 4-hour and 1-hour consolidations and lack of upwards strength, keeping the price under key resistance.On-Chain Data:
Fear and greed index is at 26 (fear), but the price is at a high of 74000, a typical “price and sentiment divergence”! This usually indicates either the price will fall towards sentiment, or sentiment will quickly correct and turn greedy. Bitcoin's dominance is at 56.69%, still very high, with funds still concentrated in Bitcoin. Total market capitalization is at 2.61 trillion, with a slight decline in 24 hours and average trading volume, indicating that the market is generally in a wait-and-see state. Combining these with news factors, the market's core now is “waiting for the Fed's resolution”, both bulls and bears are hesitant to make big moves, hence forming the consolidation pattern across cycles.
Step 5: Market Prediction and Trading Strategy
Current (within a few hours): The ultra-short term (15 minutes to 1 hour) is likely to continue consolidating between 73800 and 74400, direction is unclear.
Key for Today and the Near Future: The most important resistance level today is 74400 (the upper edge of the 1-hour box and pressure from the 4-hour moving averages), breaking here could possibly test 74800. The most important support level is 73800 (15-minute double bottom and low from 1 hour ago), and breaking here could quickly lead to 73500 (critical neck line for 4 hours). Keep a close eye on the Fed's news!
Trading Strategy:
Trend Following Opportunities: The daily chart is still bullish, so if it retraces to key support without breaking, a light long position can be taken. For instance, if the price retraces to the 73800-73500 area, and 1-hour RSI approaches oversold (below 30) or shows a bottom divergence, a long can be considered, targeting 74400-74800.
Counter-Trend Opportunities: If the price rebounds to the 74400-74800 area, and at the same time, 1-hour or 4-hour RSI enters overbought (above 70), and shows signals of stagnation such as upper shadows, a light short position can be trialed, with a stop-loss above 75000, targeting 73800.
Wait and See: Before the Fed's resolution comes out, or when the price is hovering around the middle level of 74000, it is best to wait and see! Don’t make hasty moves.
Summary: The core contradiction in the current market is the pull between “long-term capital inflow positive signals” and “short-term macro uncertainty and market fear sentiment”.
Trading Quote: The market always is born in despair, rises in hesitation, and ends in celebration. The market is currently in the "hesitation" phase; what we need to do is maintain patience and wait for the market to choose its direction!
Alright, that’s all for today’s analysis. I hope it helps everyone, and we’ll see you next time!
For more quantification and breakdown of how real-time information influences market sentiment, it has been updated on my Qinglan Crypto Classroom: www.qinglan.org
免责声明:本文章仅代表作者个人观点,不代表本平台的立场和观点。本文章仅供信息分享,不构成对任何人的任何投资建议。用户与作者之间的任何争议,与本平台无关。如网页中刊载的文章或图片涉及侵权,请提供相关的权利证明和身份证明发送邮件到support@aicoin.com,本平台相关工作人员将会进行核查。