Record Outflows in the Financial Sector, ETF Short Selling Soars
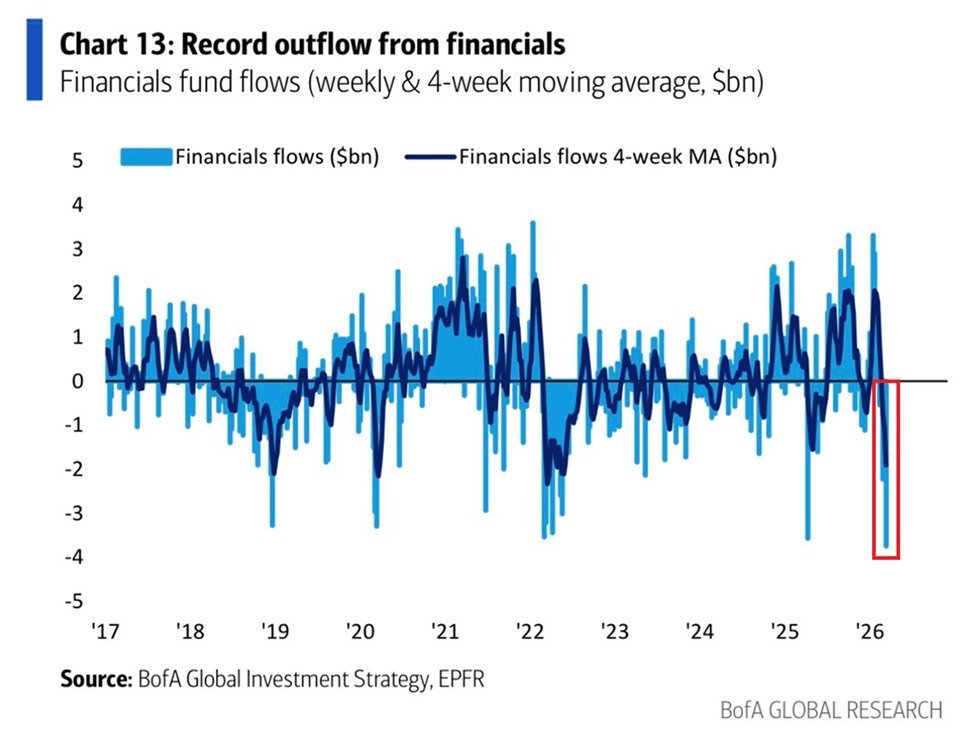
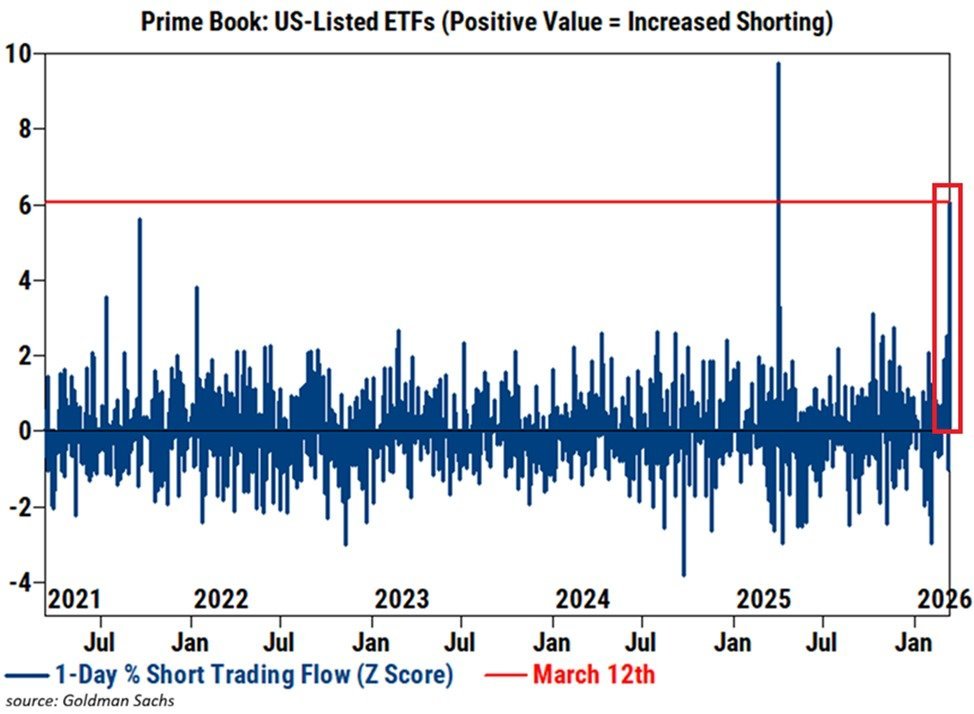
Today I saw some information and felt that the market has now entered a defensive mode. The first chart shows that fund outflows in the financial sector have reached close to extreme levels. The second chart indicates that short selling volume of U.S. listed ETFs has seen a significant increase around March 12. Combined with recent cross-asset fund flows over the past week, this judgment is not just an emotional exaggeration.
As of the week ending March 11, global equity funds had net outflows of approximately $7.05 billion, marking the largest one-week outflow since mid-December 2025. Among industry funds, finance and healthcare were the main areas of sell-off. High-yield bond funds also experienced the largest one-week outflow since April 2025, while money market funds continued to see net inflows, indicating that investors seem to have turned defensive.
Put simply, there is a shift from equities, credit, to cash management into a risk-averse stance.
The February CPI was announced on March 11, and on March 11 and 12, the USTR initiated two rounds of new Section 301 investigations, targeting issues related to manufacturing overcapacity and forced labor. This indicates that the market is facing inflation data, trade policy escalation, and geopolitical conflicts that are driving up oil prices concurrently.
Goldman Sachs also pushed back the first rate cut expectation from June to September during this window, citing that Middle Eastern conflicts have raised inflation risks; consequently, Brent crude returned to above $100. In this context, the significant increase in ETF short selling volume around March 12 resembles institutions conducting tail hedging. This also suggests that some capital believes known risks have not been fully priced by the market.
The second chart has a detail that is easily overlooked: the ETF short selling volume under Prime Book is essentially closer to hedge fund behavior rather than retail or traditional mutual fund behavior.
In Goldman Sachs’ prime brokerage data, total hedge fund leverage had already risen to 307% in mid-February, a five-year high. Recently, the short positions of U.S. ETFs increased by 8.3% in a single week, marking the second-largest jump in five years. This combination means that ETFs are not only the most convenient risk hedging tool but also the first liquidity tool used in a high-leverage environment.
Of course, this chart alone cannot 100% prove that all new short selling is purely directional betting; some may also be index hedging on long positions in individual stocks. However, when the volume has reached such an extreme, it at least indicates that institutions are not slowly adjusting positions but are quickly reducing risk.
Moreover, the abandonment of the financial sector is different from the pullback in tech stocks. Many times, shorting tech stocks targets valuations and sentiment, which can be rapidly covered when good news arrives, but if the shorting of financial stocks targets balance sheets, financing conditions, private credit exposures, and potential credit losses, the bar for disproof is much higher.
Additionally, since total hedge fund leverage had previously risen to a five-year high, and ETFs are the most convenient liquidity hedging tool, any continued increase in volatility can easily create positive feedback loops of active de-risking and passive adjustments. Recently, European bank stocks have also weakened synchronously under the impact of oil prices, indicating that this may not just be a local U.S. issue but rather an overall increase in risks within developed market financial systems.
Therefore, looking at these two charts together and considering recent macro events and cross-asset capital flows, my personal view is that this does not necessarily mean the market is heading toward a collapse; rather, the market has switched from growth and valuation narratives to inflation, credit, and liquidity narratives.
The Iranian conflict is pushing oil prices up, which in turn raises inflation expectations; inflation risks delay the path to interest rate cuts, and if interest rates remain high for longer, the financial sector will first confront issues related to balance sheets and credit chains. At this time, the record outflows from the financial sector and the explosive short selling volume in ETFs should not be interpreted as a mere decline in general risk appetite but rather a prescriptive defensive stance from high-leverage capital regarding the tail risks of "stagflation + credit contraction."
Overall, I believe there are risks now, although many peers do not think the risks are very large, especially since there have not been signs of blow-ups in the credit sector, but institutions have already begun to react to the potential risks.
Bitget VIP, lower fees, better benefits
免责声明:本文章仅代表作者个人观点,不代表本平台的立场和观点。本文章仅供信息分享,不构成对任何人的任何投资建议。用户与作者之间的任何争议,与本平台无关。如网页中刊载的文章或图片涉及侵权,请提供相关的权利证明和身份证明发送邮件到support@aicoin.com,本平台相关工作人员将会进行核查。


