Coin Circle Li Ying: 3.15 ETH 2-hour Bollinger Band contraction game plus MACD bottom divergence, is it a bottom-fishing signal or a trap to lure in buyers? Latest market analysis and operational suggestions
Hello fellow warriors in the coin circle, I am Li Ying! Now let's take a look at the ETH 2-hour candlestick chart, breaking down the hidden bullish and bearish game through the three dimensions of Bollinger Bands, MACD, and trading volume. In the case of a contraction with low volume plus a bottom divergence signal, is this a bottom-fishing opportunity at the end of a decline, or a trap to lure in buyers during a downward continuation? After reading this, you will find the answer!
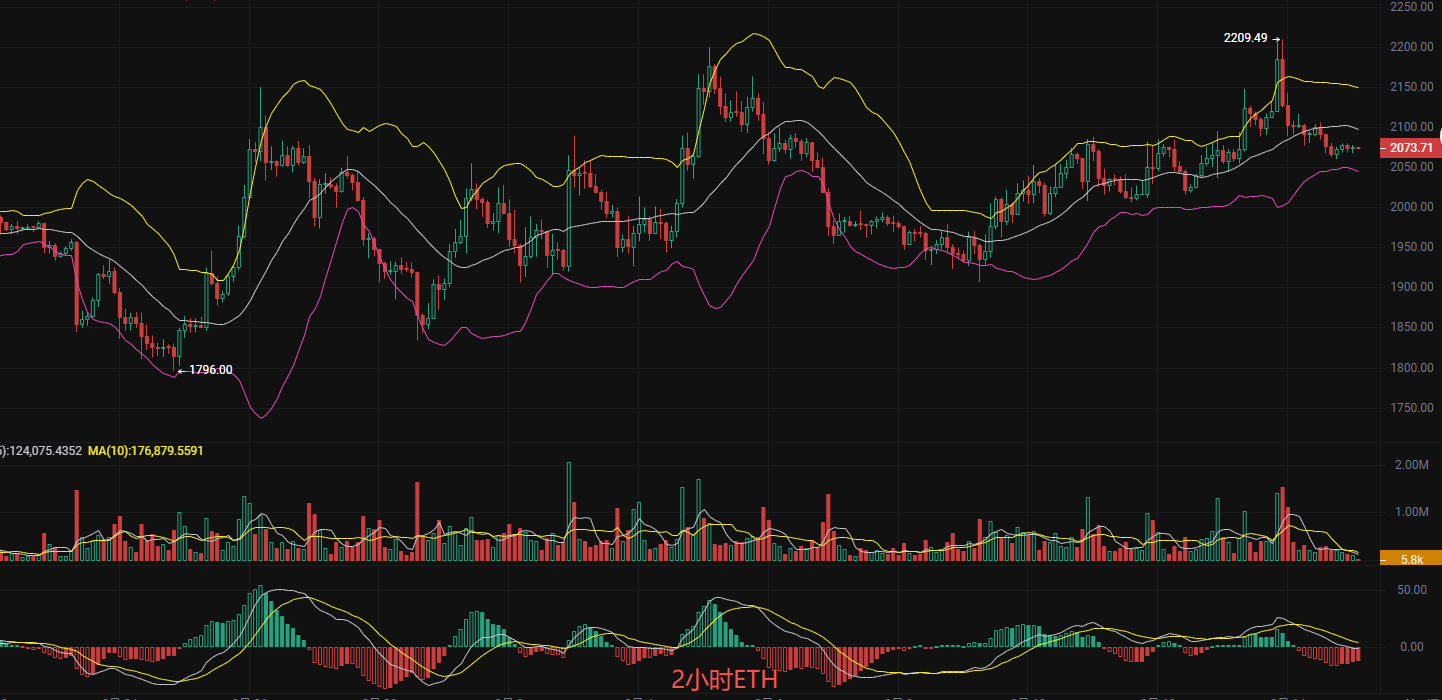
Bollinger Bands are contracting in a suffocating manner, a trend reversal is imminent. Everyone knows that the core of Bollinger Bands is that the narrower the band, the lower the volatility, and the greater the probability of a trend reversal; the wider the band, the stronger the trend. The 2-hour Bollinger Bands are in a state of extreme contraction.
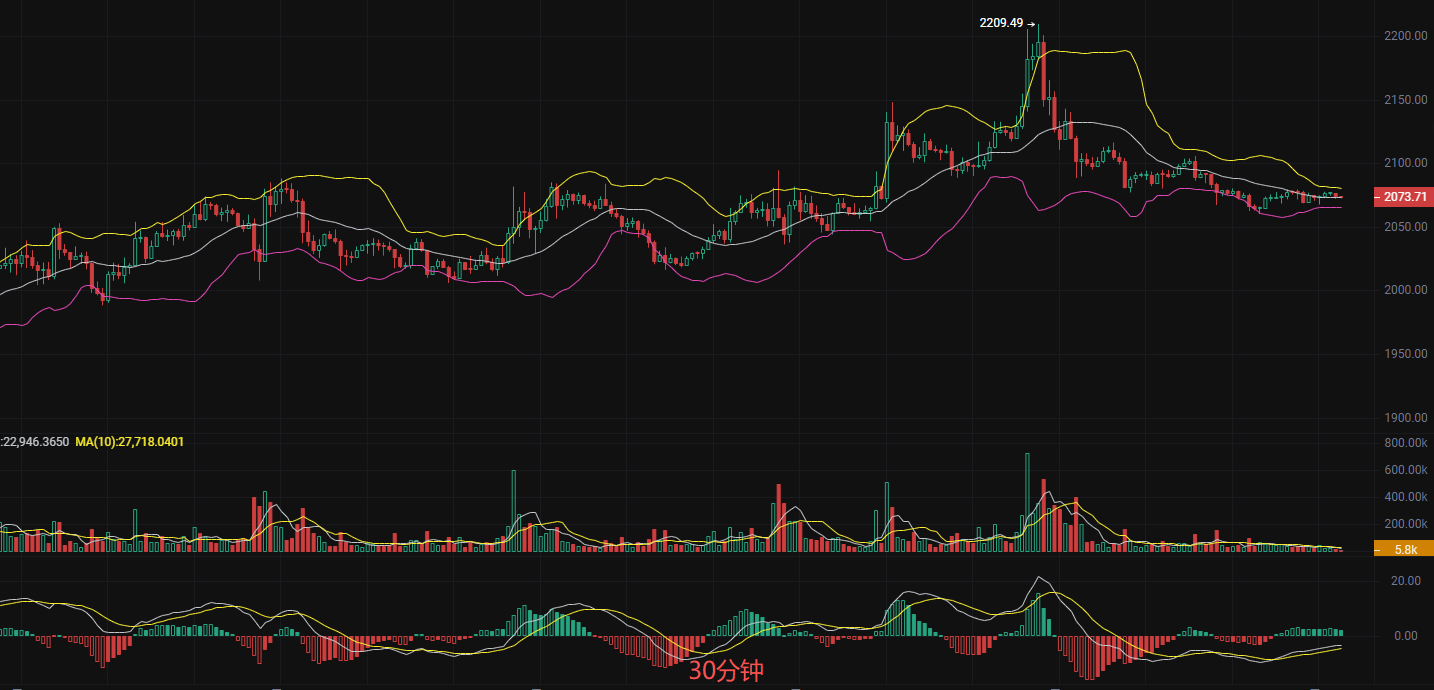
Historical rule: Looking back at previous trends, when ETH reached the low point of 1796, the Bollinger Bands similarly experienced extreme contraction, followed by a breakthrough of the upper band leading to a surge from 1796 to 2209, an increase of over 23%; after hitting the high point of 2209, the Bollinger Bands contracted again, and the price retraced to the 2050 range, completing a cycle of contraction-expansion-contraction. Therefore, Li Ying believes that the current opportunity arises as the Bollinger Bands contract again; if the price breaks above the upper band at 2151, it is highly likely to start a new round of increases; if it breaks below the lower band at 2047, it may continue to retrace to around 2000 or even lower.
The MACD bottom divergence began to show after a recent retracement to around 2050, and although there was a small rebound, the MACD's DIF line did not simultaneously create a new low leading to a bottom divergence. This means the price is making new lows, but momentum is not new lows, which serves as a warning signal for a temporary stop or even a reversal! Therefore, Li Ying is more inclined towards bullish sentiment. The low-volume retracement combined with the contraction of the Bollinger Bands and indicator divergence, indicates that the downward space is exhausted, making the upward movement more certain.
Short-term trading strategy (personally taught by Li Ying, precisely aligned with the market)
Bullish approach: If the price stabilizes above the Bollinger Band upper band at 2150, enter the market, targeting 2200 and 2250. If the Bollinger Band middle line at 2099 fails to hold, exit the market to stop losses.
Mid-term approach: If the main force tests the Bollinger Band lower band at 2047 without breaking, gradually open long positions, targeting 2300 aiming for 2400, with stop losses set at around 2000.
Follow Li Ying, and let me guide you through the candlestick fog.
The coin circle is never short of opportunities; what it lacks is “understanding, keeping up, and holding onto” hardcore analysis. Follow me, and every day I will break down the bullish and bearish codes of BTC, ETH, and mainstream currencies, using a professional perspective to guide you through bull and bear markets, turning market trends into a “cash machine”!
(If you find the analysis useful, remember to like + save + follow, your support is my motivation for continuous output~)
Interactive topic: Do you think the probability of ETH breaking above the upper band this time is high? Leave your views in the comments, and let’s discuss together!

Note: The above analysis by Li Ying is solely based on technical logic and does not constitute investment advice. The market carries risks, and investment requires caution.
免责声明:本文章仅代表作者个人观点,不代表本平台的立场和观点。本文章仅供信息分享,不构成对任何人的任何投资建议。用户与作者之间的任何争议,与本平台无关。如网页中刊载的文章或图片涉及侵权,请提供相关的权利证明和身份证明发送邮件到support@aicoin.com,本平台相关工作人员将会进行核查。