Coin Circle Li Ying: BTC 2 Hour In-Depth Analysis: Bollinger Band Constriction and MACD Divergence, Are Big Market Signals Already Present? Latest Market Analysis and Trading Suggestions
Hello, fellow comrades in the coin circle, I am Coin Circle Li Ying! Now, let’s break down the hidden passwords of the 2-hour candlestick chart for Bitcoin, focusing on the tightening of the Bollinger Bands, MACD divergence, and unusual trading volume. These three signals resonate, suggesting that a major market trend may have reached a critical point! Whether you are a short-term sniper or a mid-term planner, this analysis can help you capture the next trend turning point.
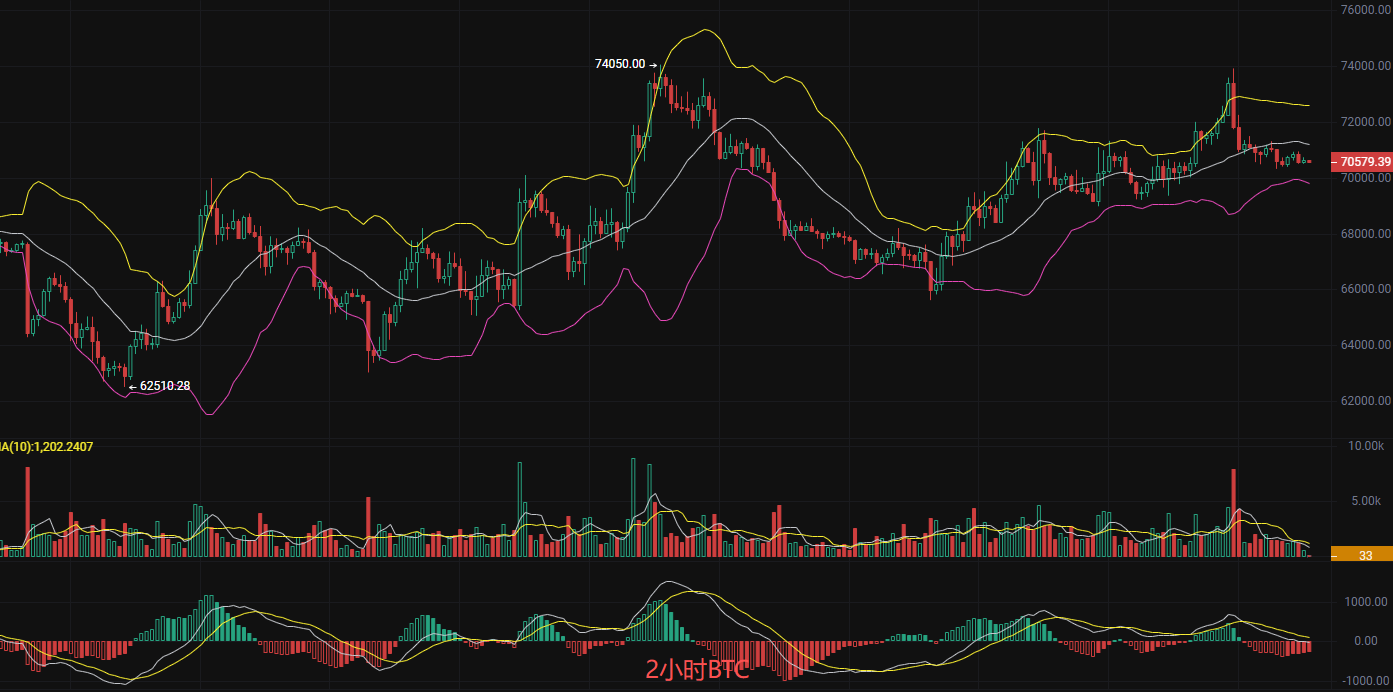
The volatility of the Bollinger Bands is shrinking, and the shift window is approaching. The current state shows a narrow convergence in the 2-hour chart, with the upper band at 72619, the middle band at 71255, and the lower band at 69892, indicating that the short-term battle between bulls and bears has entered a stalemate period, with volatility dropping to a low level. Historically, a narrowing Bollinger Band often accompanies a breakout in either direction. Currently, with the Bollinger Band tightening again, if the price breaks upward above the upper band at 72619, it will likely initiate a new round of upward movement; if it breaks downward below the lower band at 69892, it may lead to a continued correction.
The MACD top divergence reveals doubts about bullish momentum. Recently, after the price rose to around 74050, there was a bounce, but the MACD's DIF line did not create a new high simultaneously, forming a top divergence. Therefore, Li Ying judges that the main force is waiting for a breakout signal to appear. Remember, a volume contraction correction is for washing the disk and building strength; a volume increase breakout is the confirmation of the trend. Thus, Li Ying reminds everyone to wait for a volume breakout.
Short-Term Trading Strategy (Taught by Li Ying, precisely aligning with the chart)
Bullish Idea: If the market stabilizes above the upper band at 72620, go long, with the first target at the previous high of 74000, challenging 75000. The second target looks at the extended upper band from 76000 to 77000, placing the stop loss at the middle band. If the middle band is breached, then stop loss.
Bearish Idea: If the market effectively breaks below the lower band at 69890, enter a position, with the first target at the previous support of 68000, and the second target at 67000, placing the stop loss above the middle band. If the market stands above the middle band at 71255, exit promptly to avoid risk spreading.
Follow Li Ying for more in-depth analysis
Want to know about the setups for ETH, SOL, and other currencies? Want to receive the "Market Change Signal Alert" first? Click to follow + like + comment, I will continuously share valuable trading information in the coin circle, guiding you through bull and bear markets to achieve wealth appreciation!

Risk Warning: The above analysis is based on real-time market data and is for reference only; it does not constitute investment advice. Trading risks are borne by the trader.
免责声明:本文章仅代表作者个人观点,不代表本平台的立场和观点。本文章仅供信息分享,不构成对任何人的任何投资建议。用户与作者之间的任何争议,与本平台无关。如网页中刊载的文章或图片涉及侵权,请提供相关的权利证明和身份证明发送邮件到support@aicoin.com,本平台相关工作人员将会进行核查。