(Trend Analysis)
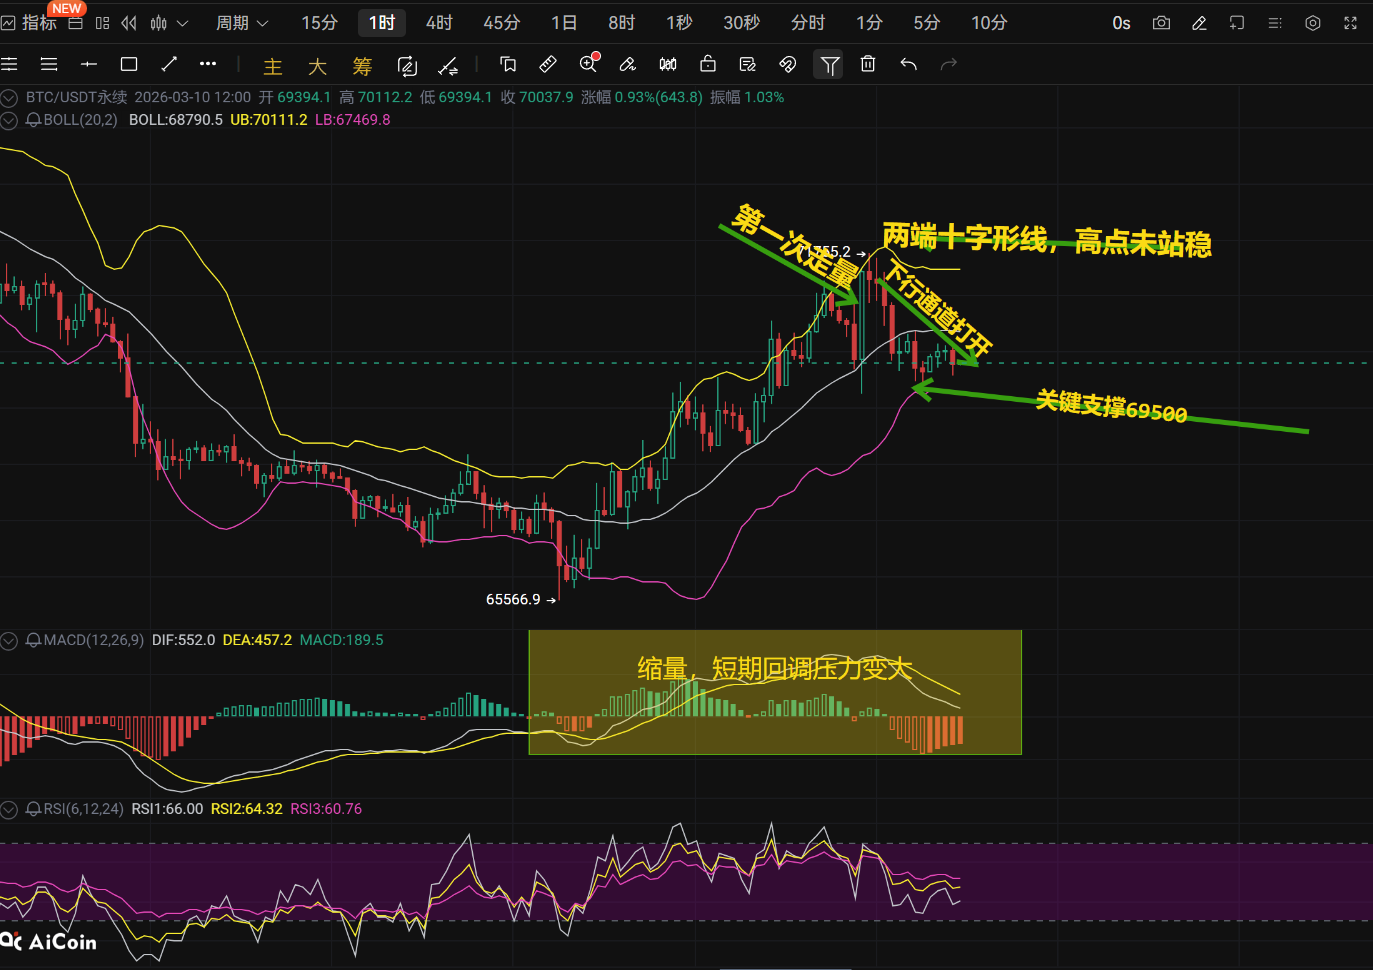
K-line pattern: Recently, a long upper shadow appeared at the 1-hour level (from 71700 to 69200), indicating significant selling pressure above 71000. The 70000 level has been repeatedly tested, forming a short-term trading range. At the daily level, on March 10th, a large upward candlestick broke through 69000, and for two consecutive days, a doji star has formed, deepening the battle between bulls and bears. The previous high of 71700 constitutes a key resistance.
Technical Indicators
macd: At the 1-hour level, the dif has crossed below the dea to form a death cross, while the daily macd red bars are diminishing, increasing the pressure for short-term pullback.
rsi: At the hourly level, it is hovering around 50, and at the daily level, the rsi is neutral to weak, with no overbought or oversold signals.
ema: The price has dropped below 70000 at the 1-hour level, with the daily level (69886) becoming new support for the day. Using 69000 as the boundary for the strength of bullish and bearish trends.
Volume: There was a significant spike in volume (2554 units) when rebounding to 71000, but it failed to hold, creating a volume-price divergence.
Strategy Levels
Long entry point: 68500-69000
Stop loss point: 66200-66500
Take profit point: 71000-71500
Short entry point: 71500-72000
Stop loss point: 73000-73500
Take profit point: 68500-69000
(Trend is king, follow the trend, investment carries risks, proceed with caution, communication. learning. cooperation, Earth ID: g18607105568)
You must have profited from the 71500 short given yesterday, continue to take profits today as well.
免责声明:本文章仅代表作者个人观点,不代表本平台的立场和观点。本文章仅供信息分享,不构成对任何人的任何投资建议。用户与作者之间的任何争议,与本平台无关。如网页中刊载的文章或图片涉及侵权,请提供相关的权利证明和身份证明发送邮件到support@aicoin.com,本平台相关工作人员将会进行核查。