Among all technical indicators, Moving Average (MA) is one of the earliest and most commonly used tools learned by traders. Regardless of the stock, forex, or cryptocurrency markets, a large number of strategies, quantitative systems, and trading robots are built on the logic of moving averages.
Its core value can be summed up in one sentence:
Filter market noise and identify trend direction.
1. What is Moving Average (MA)
Moving Average (MA) is a technical analysis indicator that calculates the average price over a certain period and plots it as a smooth curve to observe market trends.
Its essence is:
Smoothing price fluctuations using averages to clearly see trends.
1. Suppose the prices of BTC over the past 5 days are: 10, 11, 12, 13, 14 (USD).
Then the average price over these 5 days is: (10+11+12+13+14) ÷ 5 = 12
2. Calculation formula:
 - aicoin - image 1")
Where:
- close = the closing price of each period
- n = period length As new prices appear, the moving average will continually “move”.
2. Moving Average Configurations Suitable for Beginners
Some consensus periods have formed in the trading market:
 - aicoin - image 2")
 - aicoin - image 3")
For example:
Price above 200MA → Long-term bullish market
Price below 200MA → Long-term bearish market
3. The 3 Core Uses of MA
1. Determine Trend Direction
The basic logic:
- Price above MA → Upward trend
- Price below MA → Downward trend
If the moving average itself:
- Inclined upwards → Bullish trend
- Inclined downwards → Bearish trend
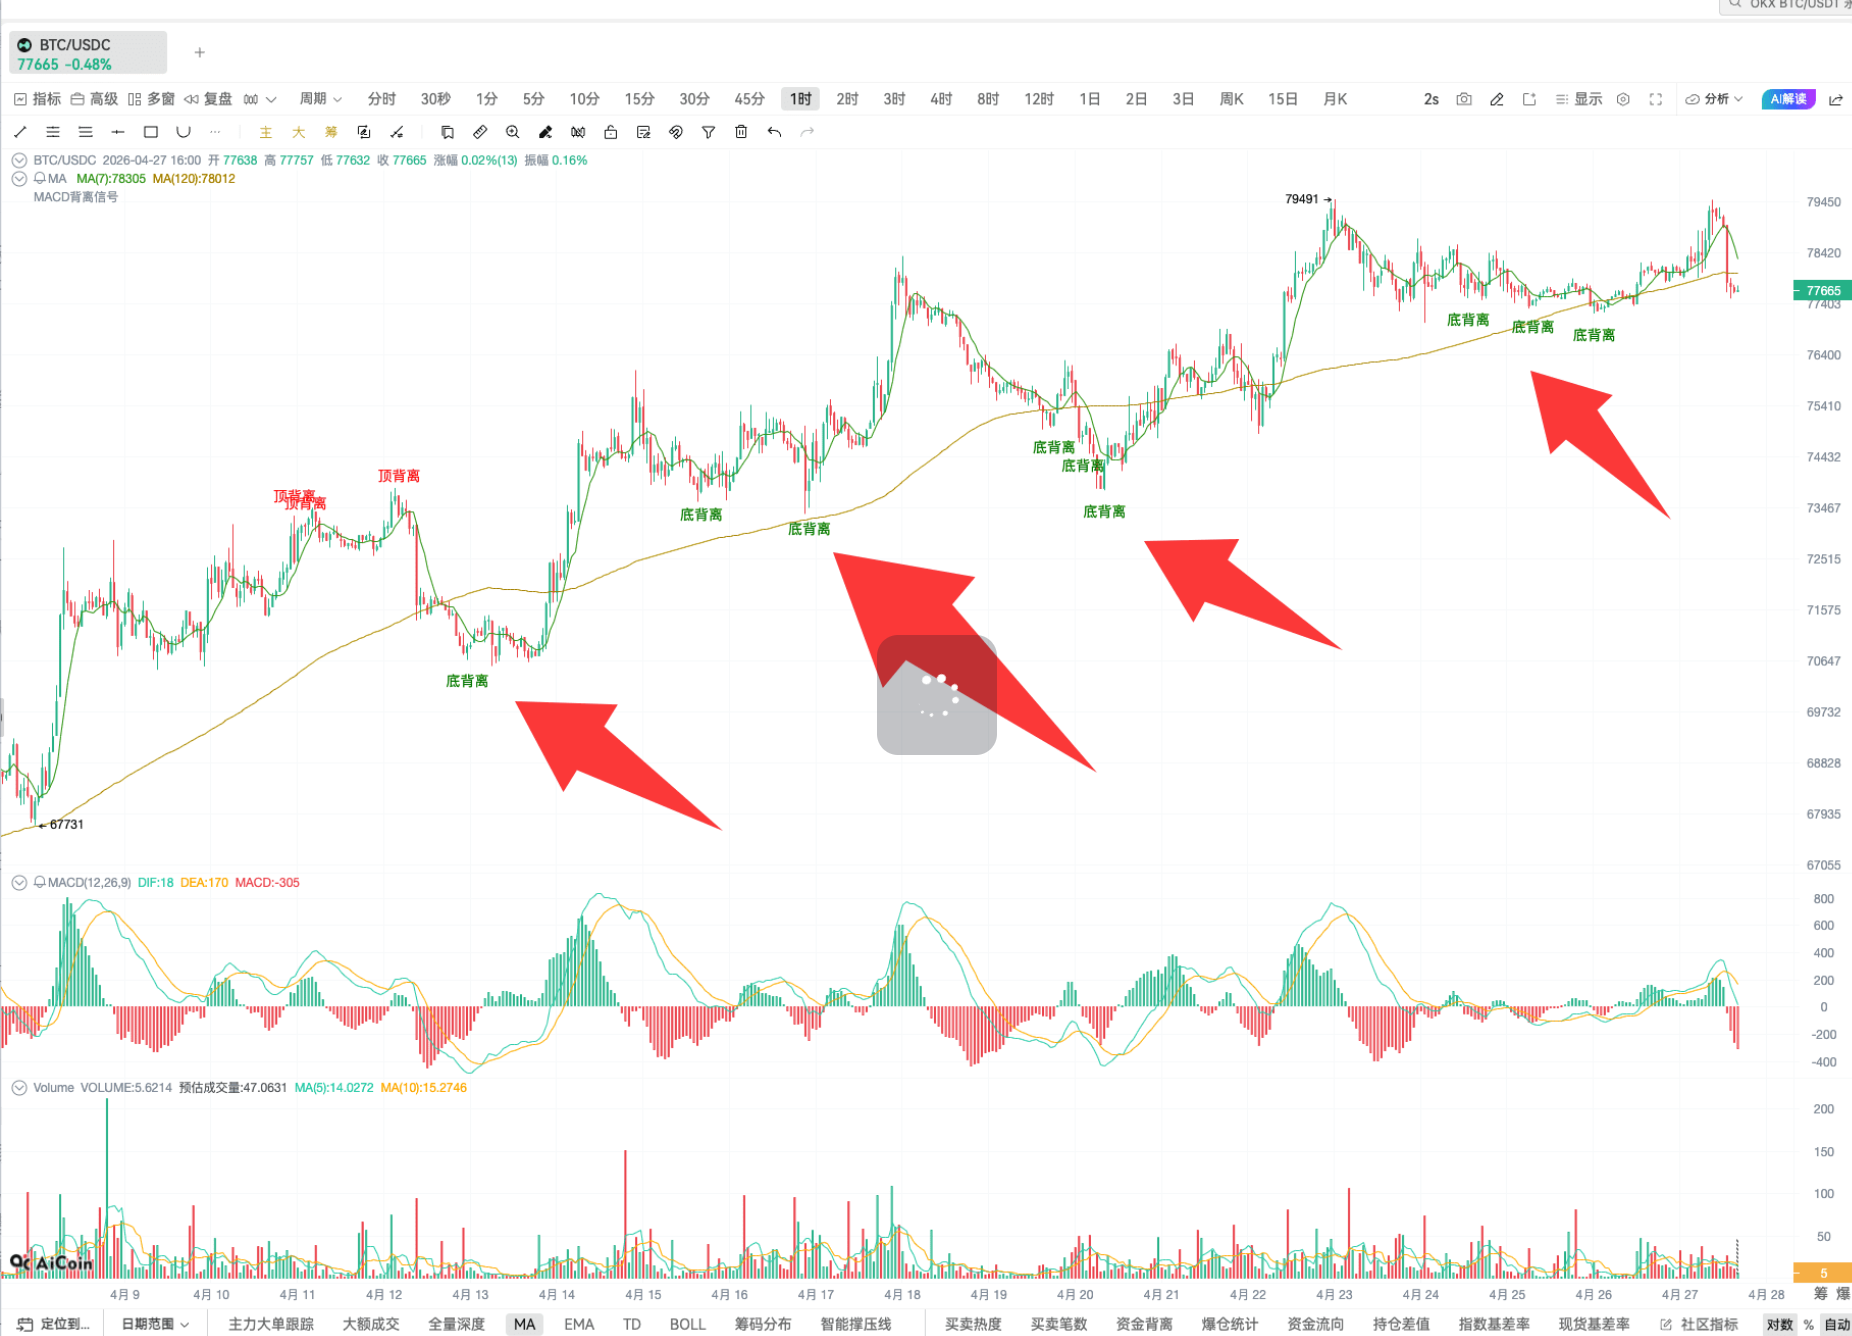
2. Determine Support and Resistance
In trending markets: moving averages often become dynamically support / resistance
For example:
In an upward trend: price retraces → MA20 → rebounds
In a downward trend: price rises → MA20 → continues to fall
Many institutional strategies involve: buying on a retracement to the moving average
 - aicoin - image 4")
3. Determine Buy and Sell Signals (Moving Average Cross)
The classic strategy:
(1) Golden Cross
Short-term moving average crosses above long-term moving average, for example: MA50 crossing above MA200 is usually seen as: start of an upward trend
(2) Death Cross
Short-term moving average crosses below long-term moving average: MA50 crossing below MA200 is usually seen as: bear market signal
4. 4 Classic Moving Average Trading Strategies
Strategy 1: Single Moving Average Trend Trading
Logic:
Price > MA → Only go long
Price < MA → Only go short
Commonly used: MA50; simple, suitable for beginners, but easy to lose in a ranging market.
 - aicoin - image 5")
Strategy 2: Dual Moving Average System
This is the most classic signal; we need one fast line (like MA10) and one slow line (like MA40).
- Golden Cross (bullish signal): Fast line crosses from below to above the slow line. This indicates that short-term strength has overcome long-term resistance.
- Death Cross (bearish signal): Fast line crosses from above to below the slow line. This indicates that the short-term trend is starting to deteriorate.
Logic:
Buy: MA10 crosses above MA40
Sell: MA10 crosses below MA40
 - aicoin - image 6")
Strategy 3: Moving Average Arrangement
Bullish arrangement: MA20 > MA50 > MA200, short-term > mid-term > long-term, indicating a very strong upward trend, suitable for holding assets.
Bearish arrangement: MA20 < MA50 < MA200, short-term < mid-term < long-term. This indicates a clear downward trend, do not blindly catch the bottom.
 - aicoin - image 7")
Strategy 4: MA120 “Bull-Bear Boundary” Strategy
We regard MA120 as the “basic judgment standard”:
- Price above MA120: only look for opportunities to go long.
- Price below MA120: only look for opportunities to go short.
Operation mantra:
If the price is above MA120 and MA10 crosses MA40 → go long; once MA10 crosses below MA40, close the position.
 - aicoin - image 8")
5. Advanced: Customize Your MA Strategy
If you want to be more professional, you can try writing a small script to achieve personalized indicators.
Open Custom Indicators - Indicator Editor - AI Write Indicator, send your indicator requirements, and the code will be automatically generated. Example:
Send AI Command: Write a moving average strategy, buy logic: MA10 crosses above MA40, mark text “buy”; sell logic: MA20 crosses below MA40, mark text “sell”, support alert.
 - aicoin - image 9")
Example code:
// @version=2
// Calculate 10-period simple moving average.
ma10 = ma(close, 10);
// Calculate 20-period simple moving average.
ma20 = ma(close, 20);
// Calculate 40-period simple moving average.
ma40 = ma(close, 40);
// Buy signal condition: ma10 crosses above ma40.
buy = crossup(ma10, ma40);
// Sell signal condition: ma20 crosses below ma40.
sell = crossdown(ma20, ma40);
// Trading logic
exitLongAmount(sell, price='market', amount=1, id='1');
exitShortAmount(buy, price='market', amount=1, id='2');
enterLongAmount(buy, price='market', amount=1, id='3');
enterShortAmount(sell, price='market', amount=1, id='4');
// Drawing logic
plotText(buy, title='Buy', text='Buy', color='green', refSeries=close, placement='bottom');
plotText(sell, title='Sell', text='Sell', color='red', refSeries=close, placement='top');
// Alert logic
alertcondition(buy, title='MA10 crosses above MA40 buy signal', direction='buy');
alertcondition(sell, title='MA20 crosses below MA40 sell signal', direction='sell');
Moving averages are your friends, but do not be overly reliant on them. In trending markets (one-sided rises or falls), MA is a magical tool; however, in sideways markets (prices bouncing up and down), MA frequently issues false signals. Learning to combine multiple moving averages to observe trend strength is a necessary path for advanced traders.
Join our community to discuss and grow stronger together!
Official Telegram community:
t.me/aicoincn
AiCoin Chinese Twitter: https://x.com/AiCoinzh
Group chat - Wealth Group:
https://www.aicoin.com/link/chat?cid=10013
免责声明:本文章仅代表作者个人观点,不代表本平台的立场和观点。本文章仅供信息分享,不构成对任何人的任何投资建议。用户与作者之间的任何争议,与本平台无关。如网页中刊载的文章或图片涉及侵权,请提供相关的权利证明和身份证明发送邮件到support@aicoin.com,本平台相关工作人员将会进行核查。