First, let's talk about the technical aspect:
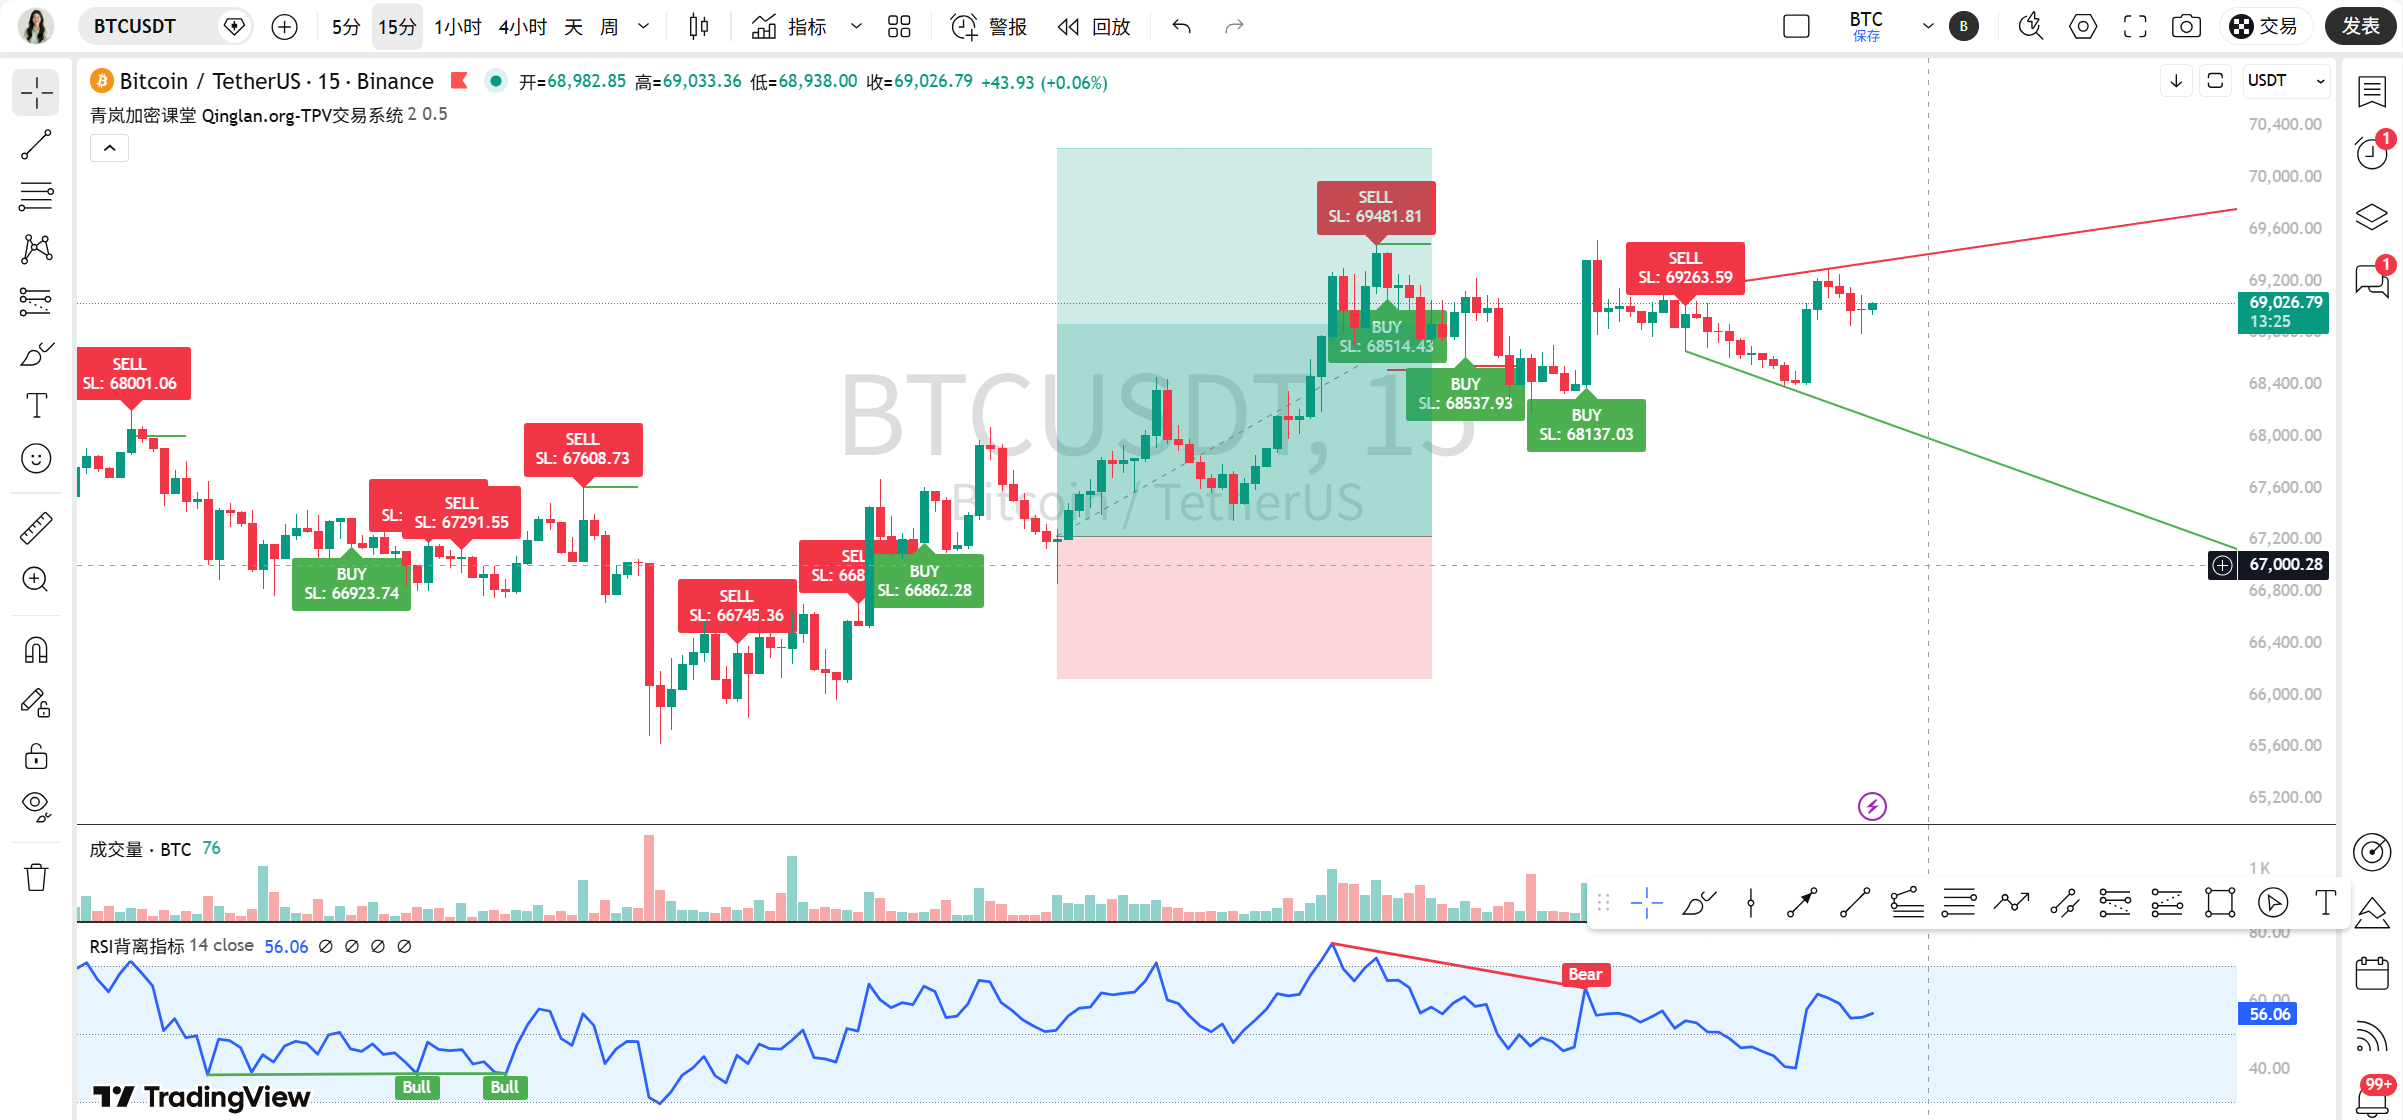
15-minute chart: A clear oscillating pattern. The price is oscillating between 68400 and 69400 in this range. The three lines MA5, MA10, and MA20 are almost twisted together, indicating a very tight balance of short-term bullish and bearish forces. MACD is repeatedly jumping around near the zero axis, with the bars alternately red and green, and RSI is also swaying above and below the 50 midpoint. Simply put, there is no direction, just waiting for a decision.
1-hour chart: The short-term trend leans bullish, but momentum is weakening. You see, the price is still above all major moving averages (MA5/10/20), which indicates a bullish arrangement. However! The fast and slow lines of MACD are showing signs of flattening or even turning downward at high levels, and the red bars, although short, have appeared. RSI has also dropped back to around 60 from the overbought area above 70. This indicates that the upward momentum may take a breather for a while, needing to digest.
4-hour chart: A key rebound period. A positive signal has appeared here: MACD has formed a golden cross below the zero axis, and the green bars are expanding. The price has also moved above MA5 and MA10, trying to attack MA20 (approximately around 69200). This is a sign attempting to reverse from a downtrend, but it needs confirmation to see if it can effectively break through and hold.
Daily chart: Long-term remains within an adjustment channel. The price is suppressed below MA20 (around 67600) and MA60, with an overall oscillating and bearish structure. However, the green bars of MACD have begun to slightly emerge, and downward momentum seems to be diminishing, but it is still too early to talk about a reversal.
Key levels to remember:
Upper resistance: First at 69400-69600 (15-minute upper edge + 4-hour MA20), with strong resistance at 70500-71000 (previous high area).
Lower support: In the short term, look at 68400-68600 (15-minute lower edge + 1-hour MA20). If it breaks below here, it may test 67500-67700 (daily MA20 + former platform).
News to spice it up:
Today's core news can be summed up in two words: "easing." Trump's remarks about "the war with Iran coming to an end" directly caused crude oil to plummet over 30%, and global risk assets (U.S. stocks, Japanese and South Korean markets) rebounded in response. This is potentially good news for Bitcoin, as easing geopolitical tensions and inflation worries may prompt some funds to flow back into high-risk assets. However, there is also bearish hedging: the U.S. Bitcoin ETF saw a net outflow of 5409 BTC in one day, and meanwhile, some mining companies and institutions (like Grayscale) are moving BTC to exchanges, which may indicate some selling pressure.
Our prediction and trading strategy:
Overall, in the medium to long term (daily), it remains an oscillating bottoming pattern, while in the short term (1-4 hours) there is a need for a rebound, but momentum is insufficient, and in the ultra-short term (15 minutes) it is just random oscillation.
Therefore, in terms of operation, we should "play large and do small, respond flexibly":
For the aggressive traders (catching rebounds): you can try a small position for long near the support area of 68400-68600, with a stop loss below 68200, targeting 69400, and if it breaks through, then look for 70000. Remember, this is just to bet on a short rebound, in and out quickly.
For the conservative traders (waiting for a breakout): then patiently wait for direction selection. If the price can stabilize above 69600 with volume, consider following up with long positions, targeting 71000. If it effectively breaks below 68400, it may once again probe down to 67500; at that point, observe for signs of stabilization before making any plans.
Currently (within the oscillating range): the best strategy is to sell high and buy low, operating in reverse near the upper and lower edges of the range, with strict stop losses.
Finally, here's a trading golden quote for everyone:
“The market develops in hesitation and ends in celebration. When both bulls and bears are pulling back and forth in a small space, what you need to do is not gamble on direction but to prepare your ammunition for the moment when one side finally exhausts itself.” Let's stay patient and wait for the opportunity together.
For more quantification and analysis of real-time news impact on market sentiment, it has been updated in my Qinglan Crypto Classroom: www.qinglan.org
免责声明:本文章仅代表作者个人观点,不代表本平台的立场和观点。本文章仅供信息分享,不构成对任何人的任何投资建议。用户与作者之间的任何争议,与本平台无关。如网页中刊载的文章或图片涉及侵权,请提供相关的权利证明和身份证明发送邮件到support@aicoin.com,本平台相关工作人员将会进行核查。