Cryptocurrency Circle Liying: Bitcoin (BTC) Latest Market Analysis
Article published on 2026.3.10-----00:20
Current price of Bitcoin is 68850, Liying believes that the current candlestick pattern shows a strong rebound momentum after a continuous decline. However, the bullish candle has a long upper shadow, indicating selling pressure around 69000. The latest 2-hour candlestick has formed a spinning top with long upper and lower shadows, and a small body, indicating a divergence between both sides at the high levels, and the market has entered a consolidation or hesitation phase. The MACD on the 2-hour chart has formed a golden cross, enhancing short-term upward momentum. The RSI still has room for upward movement. The EMA on a 2-hour chart has formed a short-term bullish alignment. Currently, it has broken through the price, which may turn into support, and there is a high probability that it will further probe upwards in the short term, with a focus on bullish positions for now, considering resistance later for potential short positions.
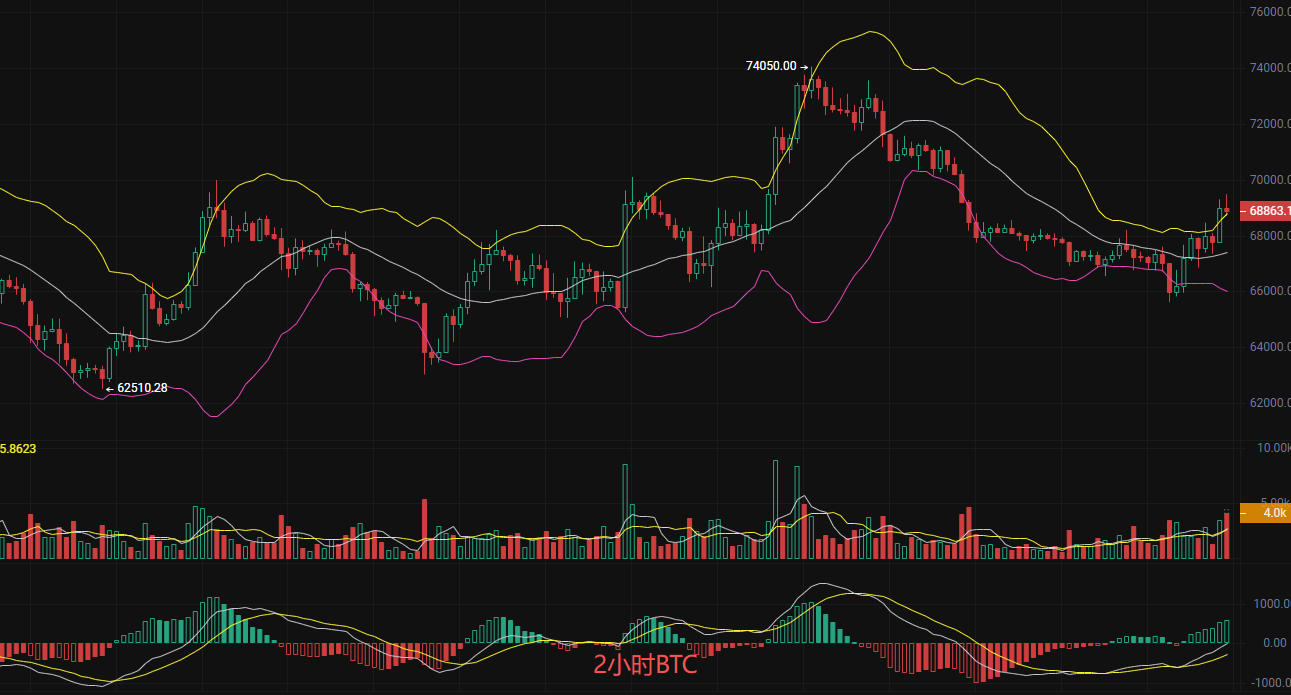
Short-term reference:
Bullish position at 68000 and 67000, exit below 66500, targeting above 69500 aiming for 70500
Bearish position at 69500 and 70000, exit below 70500, targeting below 68000 aiming for 67000
Ethereum (ETH) Latest Market Analysis
Before publication, the current price of Ethereum is 2022, Liying sees that the current candlestick on the 2-hour chart shows a strong bullish momentum, but the latest candlestick near 2030 shows selling pressure. The daily candlestick has recovered yesterday's loss and reached a recent new high, indicating a short-term pullback demand. The MACD on the 2-hour chart has formed a golden cross, indicating strong bullish trend. The RSI on the 2-hour chart still has room for upward movement, but caution is needed for potential pullback risks after entering the overbought zone. The EMA on the 2-hour chart has stabilized above all short-term, medium-term, and long-term moving averages, showing a very strong trend. Liying reminds everyone that the critical resistance point has not yet been reached, and there is still demand for further upward movement, focusing on bullish positions for now, waiting to consider potential bearish positions after the market extends further.
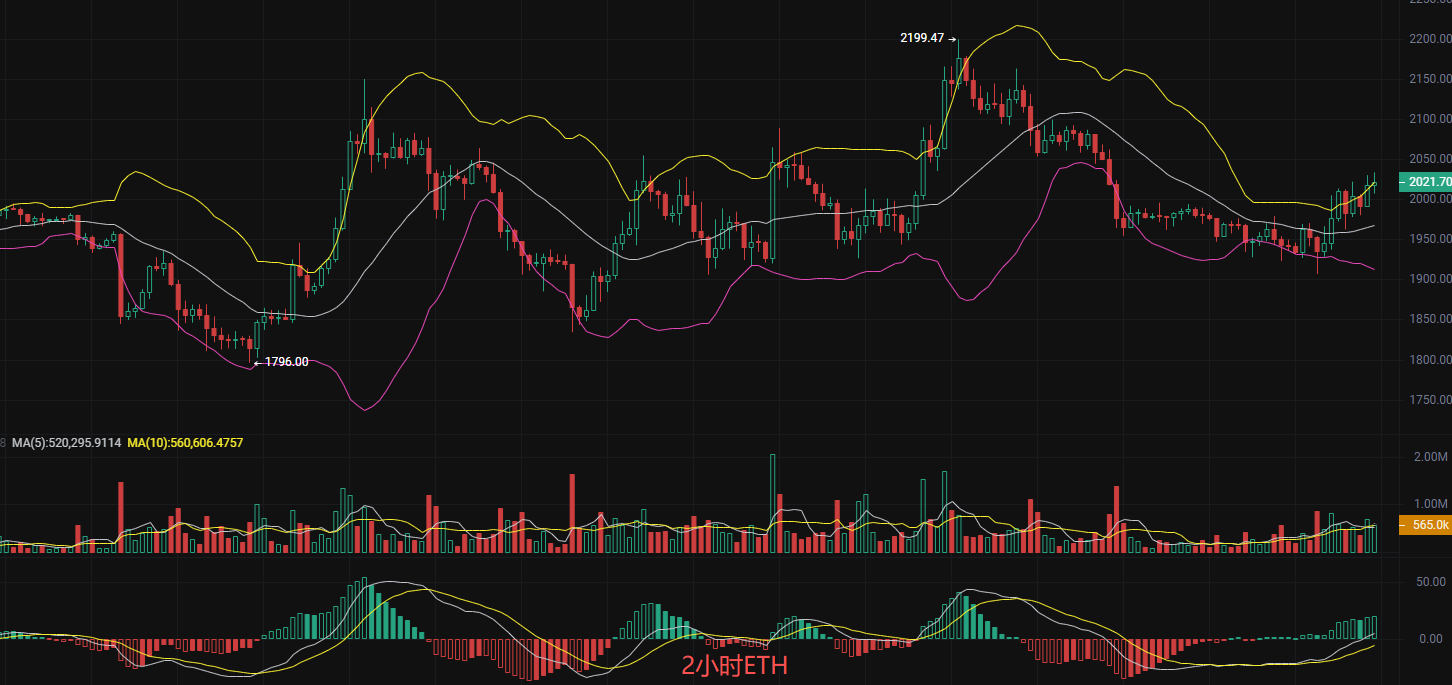
Thought process reference:
Bullish position at 1900 and 1850, exit below 1800, targeting above 2000 aiming for 2150
Bearish position at 2100 and 2150, exit below 2200, targeting below 2000 aiming for 1950
The above content is exclusively original by Liying, please indicate the source when reprinting! The timing of article publication review has delays, market conditions change rapidly, and the above suggestions are for reference only, with risks to be borne by yourself. I hope Liying's appearance will be helpful to you!

The content of the article is real-time and for reference only, with risks to be borne by yourself.
免责声明:本文章仅代表作者个人观点,不代表本平台的立场和观点。本文章仅供信息分享,不构成对任何人的任何投资建议。用户与作者之间的任何争议,与本平台无关。如网页中刊载的文章或图片涉及侵权,请提供相关的权利证明和身份证明发送邮件到support@aicoin.com,本平台相关工作人员将会进行核查。