Today is Sunday, let's continue analyzing the market, based on multi-timeframe technical analysis:
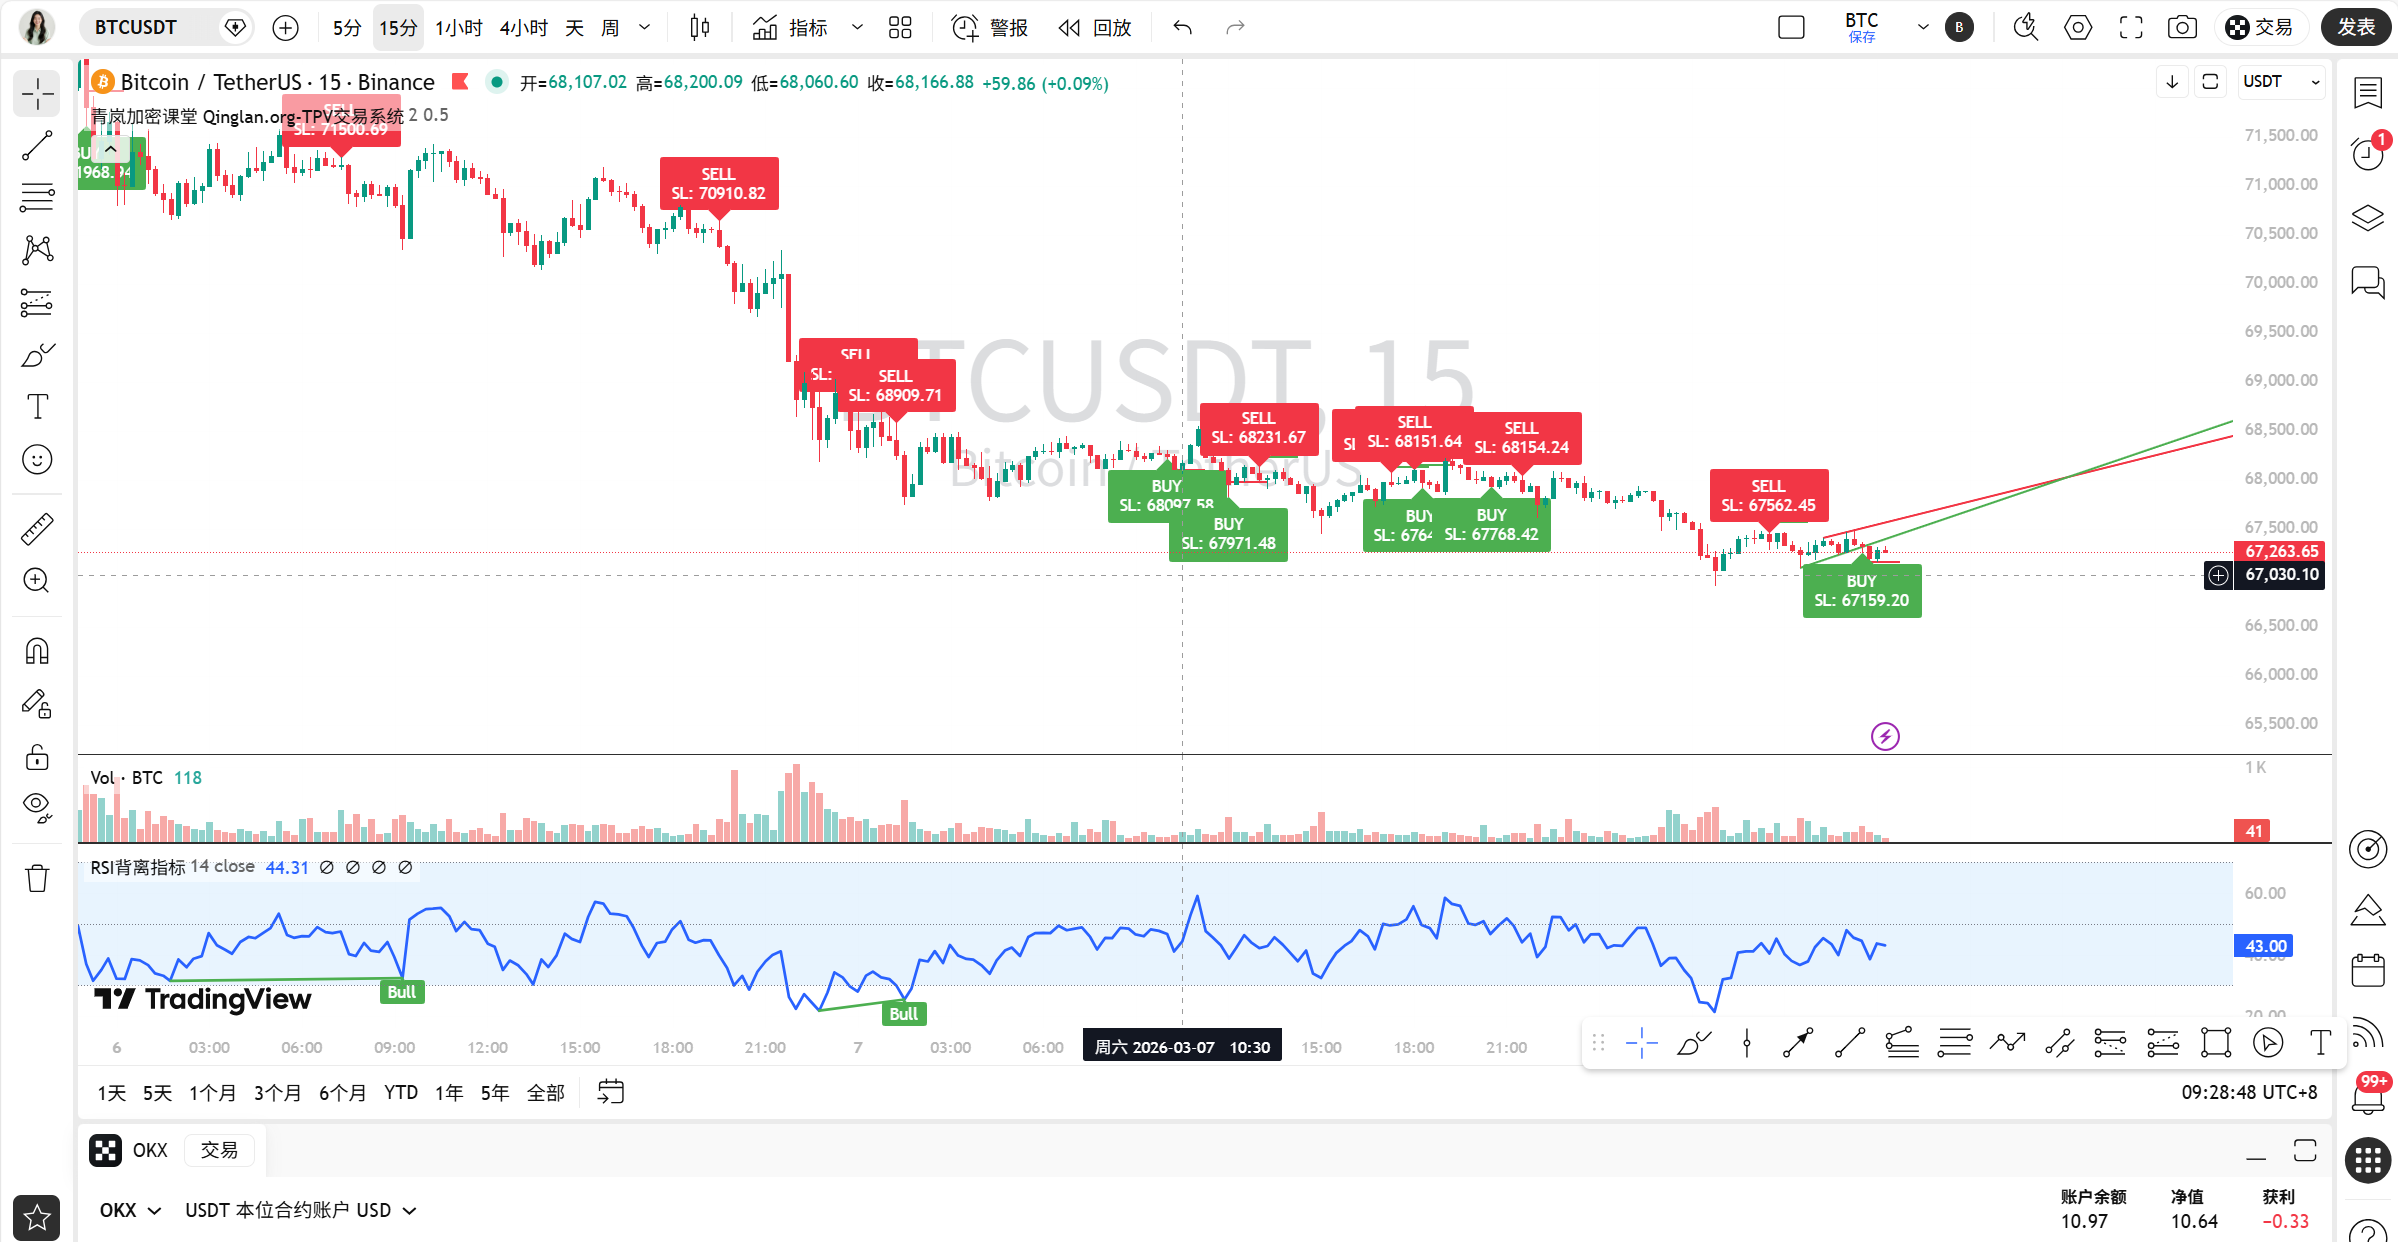
15-minute chart (ultra-short term): Oh, this trend is a bit grinding. The price is repeatedly oscillating within the small range of 67000-68000, with the MA5, MA10, and MA20 moving averages all converging together, a typical directionless oscillation. The MACD is entangled repeatedly below the zero axis, and the RSI is hovering between 40-50, indicating that the buying and selling forces are temporarily balanced and both are waiting.
1-hour chart (short term): The trend is weak, in a clearly defined downward channel. You can see that all moving averages (MA5, MA10, MA20) are in a bearish arrangement, with the price firmly pressed below. Although the MACD's fast and slow lines (DIF/DEA) are still underwater, there are signs that the green bars (BAR) are shortening, indicating that the downward momentum might be weakening, but it is certainly not the time for reversal.
4-hour chart (mid-term): This timeframe provides a clearer view, showing a standard downward trend. The price has been declining from the high point of around 73600 on March 5, constantly creating lower lows. The MA moving averages are also in a bearish arrangement. The fast and slow lines of the MACD continue to move downward below the zero axis, with long green bars, showing that the mid-term downward trend is very clear, and there have been no signs of a stop in the decline.
1-day chart (long-term): The daily level is quite critical. The price has broken through the earlier important support platform (approximately in the 68000-70000 area) and is now struggling around 67000. From a structural perspective, it resembles the right shoulder of a "head and shoulders" pattern, which is a potential bearish formation. The MACD has formed a death cross at a high position above the zero axis and has begun to diverge downwards, which is a signal to be highly alert for mid to long-term weakening.
Combining news and market sentiment:
On the news front, it can be said to be "ice and fire." On one hand, there are industry advantages, like the surge in crypto payment financing and record levels of stablecoin transactions, which reflect ecological prosperity. On the other hand, geopolitical risks (related conflicts with Iran and the U.S.) and macroeconomic concerns (stagflation risks, Federal Reserve resolutions) cast a huge shadow over the market. The most critical point is that multiple news pieces directly point to "BTC falling below 67000 USD" and issue a "deep bear market warning," such concentrated bearish headlines will greatly affect market sentiment and retail investor confidence. In addition, the news about ETH co-founders potentially dumping large amounts of ETH may also drag down BTC.
Comprehensive judgment and trading ideas:
Mixing technical analysis and news, the conclusion is relatively clear:
Trend direction: The mid to long-term (4-hour, daily) trend is clearly downward, while the short term (1-hour, 15-minute) is in a weak oscillation after a decline. Overall, the bears are dominant.
Key levels:
Upper resistance: First look at 68000 (the upper edge of the recent oscillation range and a psychological level), stronger resistance is at 69000-70000 (previous support turned resistance, also a key area on the daily level).
Lower support: The nearest support is at 67000 (the current hovering level), if it breaks, the next important support to watch is the 65000-65500 area.
Reversal patterns: Currently, there is no clear bottom reversal pattern. We need to observe if a bullish candlestick combination like "morning star" or "hammer" can appear near the key support levels (like 65000), along with an increase in trading volume and indicators (like MACD) showing bullish divergence, before considering the possibility of trend reversal.
Our trading idea: In the current bearish trend and panic sentiment, it is not advisable to blindly catch the bottom. Aggressive traders can adopt a "short on rebounds" strategy, such as when the price rebounds to the 67800-68200 area, and the 1-hour chart shows signs of stagnation (long upper shadow, RSI above 50 showing weakness), then test short positions lightly, with a stop loss above 68500, targeting 67000 and 65500. For the more conservative students, continue to patiently observe, waiting for the market to give clearer directional signals, such as a solid bullish candlestick closing on the daily level that stabilizes above key resistance, or the aforementioned bottom reversal patterns, before considering opening long positions.
Remember, trading is not about who is braver, but about who is more patient and disciplined. In unclear trends or against the trend, holding back is the best operation.
Today's golden quote: Sow in times of market panic, harvest in times of market frenzy, but most importantly, you need to ensure that you survive until the season of harvest.
For more quantitative breakdowns on how real-time information affects market sentiment, it has been updated in my Qinglan Crypto Class: www.qinglan.org
免责声明:本文章仅代表作者个人观点,不代表本平台的立场和观点。本文章仅供信息分享,不构成对任何人的任何投资建议。用户与作者之间的任何争议,与本平台无关。如网页中刊载的文章或图片涉及侵权,请提供相关的权利证明和身份证明发送邮件到support@aicoin.com,本平台相关工作人员将会进行核查。