Okay, let’s combine the technical and news aspects:
Short-term (15-minute & 1-hour chart): High-level fluctuations, weakening momentum, with pullback pressure.
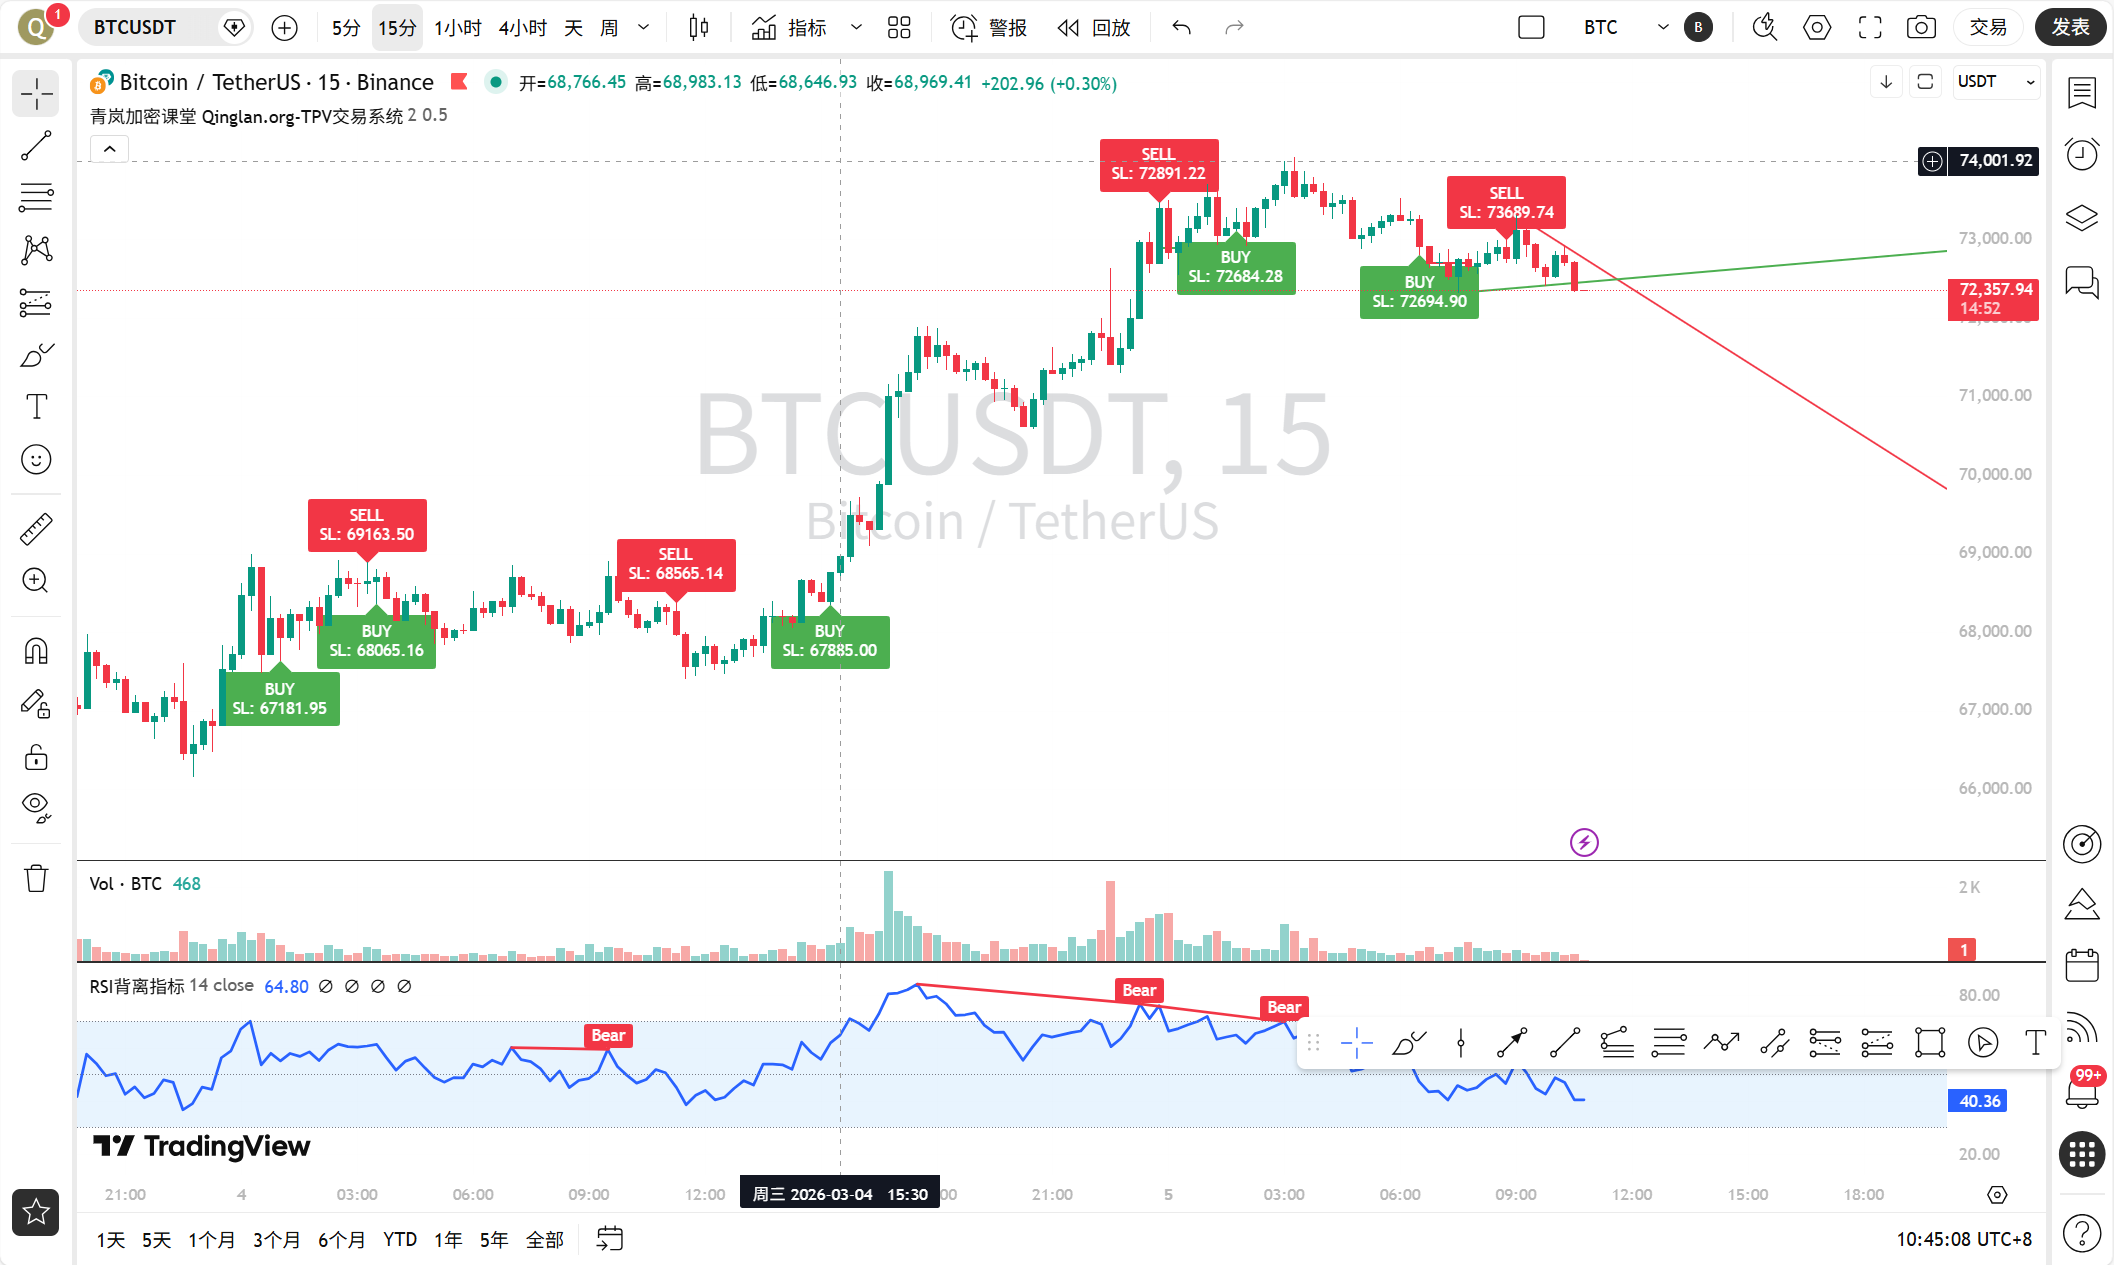
Trend: The 15-minute chart shows that after the price surged and retreated from last night’s (March 4th) high of $74,000, it has mainly fluctuated narrowly in the $72,500-$72,800 range this morning. The 1-hour chart is more evident; after reaching a new high above $74,000, the MACD’s fast and slow lines (DIF and DEA) have formed a bearish divergence—prices hit new highs, but the indicators did not keep up and instead began to turn down, with the histogram also consistently shortening above the zero axis. The RSI has dropped from the overbought area (above 80) to around 60.
Key Level: Short-term support is at $72,000 (near the previous small platform and MA20 moving average); if it breaks down, it may test $71,000. The resistance above is at the previous high of $74,000-$74,200.
News Validation: Although there is positive news (such as Lamborghini accepting Bitcoin payments and institutions continuously buying), messages like "a $113 million liquidation in one hour" and "Goldman Sachs warns of possible correction in global stock markets" indicate that after a rapid market surge, emotions are beginning to diverge, with profit-taking and short-term risk-averse sentiments heating up.
Medium-term (4-hour chart): The upward trend is intact but has entered an accelerated consolidation phase.
Trend: The bullish arrangement on the 4-hour chart is very beautiful, with MA5 > MA10 > MA20, and the price is firmly stable above all moving averages. However, the last two candlesticks have formed long upper shadows, indicating significant selling pressure above $74,000. Although MACD is still in a strong zone, the momentum of the red bars has begun to slow down.
Key Level: Strong support is at the $70,000 round number, which is also a critical breakthrough point and where the MA10 moving average is located. Resistance remains at the previous high of $74,000, and only after breaking this can new upward space open up.
News Combination: News like "BlackRock accumulating 17,600 Bitcoins" and "Institutional spot demand as core driving force" constitute a solid foundational logic for the medium-term trend, supporting the logic of "there are buyers at the dip." However, "The Federal Reserve's Beige Book reveals a wait-and-see sentiment" and "Geopolitical conflicts are intensifying," bringing uncertainty to the market, making the rise not a smooth journey.
Long-term (Daily chart): Bullish pattern is clear, in the primary rising wave phase.
Trend: The daily chart speaks for itself, showing a clear upward trend. The price has broken through the previous consolidation range, and the moving average system is in bullish arrangement. After another golden cross above the zero axis, MACD is diverging upwards, with the energy bars very strong. Although the RSI is close to 70, indicating some overheating, in a strong bull market, the RSI can remain at high levels for a long time.
Key Level: The key long-term support is in the $68,000-$69,000 area (previous highs turned into support and where the MA5 moving average is). As long as this level is not effectively broken, the bull market pattern remains unchanged. There is no clear historical resistance above; it is mostly psychological levels and profit-taking pressure.
News Positioning: Long-term positive news is very dense: Trump supports crypto legislation, Morgan Stanley has finalized the custodian for Bitcoin ETF, a16z plans to raise $2 billion to establish a new fund, Circle is minting a large amount of USDC... all of these continuously provide funding and confidence for the market, constituting the underlying logic for a long-term bullish outlook.
Comprehensive forecast and trading strategy:
In summary: The long-term bullish trend remains unchanged, the medium-term is in an acceleration phase of the trend, and the short-term is facing technical pullback pressure.
For short-term traders: It is not advisable to chase the highs at the moment. You can pay attention to whether the price can find support and stabilize around $72,000. If it stabilizes and a small cycle (like 15 minutes) shows a bottom divergence or the RSI turns upward after being oversold, you may consider going long with a light position, targeting near the previous high. If it directly breaks below $72,000, it may test down to $71,000 or even $70,000, at which point you can observe the strength of support before deciding.
For medium to long-term holders: The key is to hold on to the core position. This wave of the market is driven by spot ETFs and institutional demand, showing strong trends. You can regard $70,000 as an essential mid-term risk control reference. If a pullback occurs to the $68,000-$70,000 range, it is a good opportunity for those with light positions to incrementally add to their holdings.
Overall Strategy: Primarily buying on dips, cautiously chasing highs. Utilize pullbacks in small cycles to find better entry points near key support levels, while strictly setting stop-losses.
For more quantitative breakdowns of the impact of real-time news on market sentiment, updates can be found in my Qinglan Crypto Class: www.qinglan.org
Finally, I’d like to share a trading maxim that reflects my current mindset: “The trend is your friend, but an overly excited friend might end up costing you; patiently waiting for your position is more important than chasing every market fluctuation.” See you next time!
免责声明:本文章仅代表作者个人观点,不代表本平台的立场和观点。本文章仅供信息分享,不构成对任何人的任何投资建议。用户与作者之间的任何争议,与本平台无关。如网页中刊载的文章或图片涉及侵权,请提供相关的权利证明和身份证明发送邮件到support@aicoin.com,本平台相关工作人员将会进行核查。