At the beginning of March, Bitcoin prices experienced a phase of rising, and yesterday it even directly reached above 70,000, breaking the range box, with a maximum reaching the 74,000 mark, showing a clear willingness of bulls to fight back. However, there are densely packed resistance points above, and to achieve better upward movement, it still needs to break through step by step. This rhythm requires the verification of time.
The weekly chart is gradually starting to strengthen, with the MACD bearish energy gradually weakening, showing a trend of testing the middle track for a rebound. Today is Thursday, and it is still unknown whether the market can stabilize, especially since the non-farm data will be released tomorrow night, combined with recent geopolitical news, the overall market situation is still very tricky. We hope the bulls can firmly maintain the strong pattern of this week.
The only issue on the daily chart is the failure to achieve a consecutive bullish trend. Even though there was a consecutive bullish trend earlier, it was already half a month ago, and at most only two consecutive bullish candles, while the continuation strength is insufficient, and the technical formation is still in a suppressed state, therefore it cannot yet be defined as a strong reversal. Additionally, recent bullish candles have often quickly turned into bearish ones after appearing, so today's daily closing shape is crucial; if today can close with a bullish candle extending the rebound, it means the trend will definitely stabilize at 74,500. Coupled with the consecutive bullish candles belonging to a breakthrough rebound's effective consecutive bullish candles, the bulls will officially dominate. Whether the bulls continue to fight back or peak and fall back will hinge on today. It is crucial to pay close attention; today is by no means an ordinary trading day!
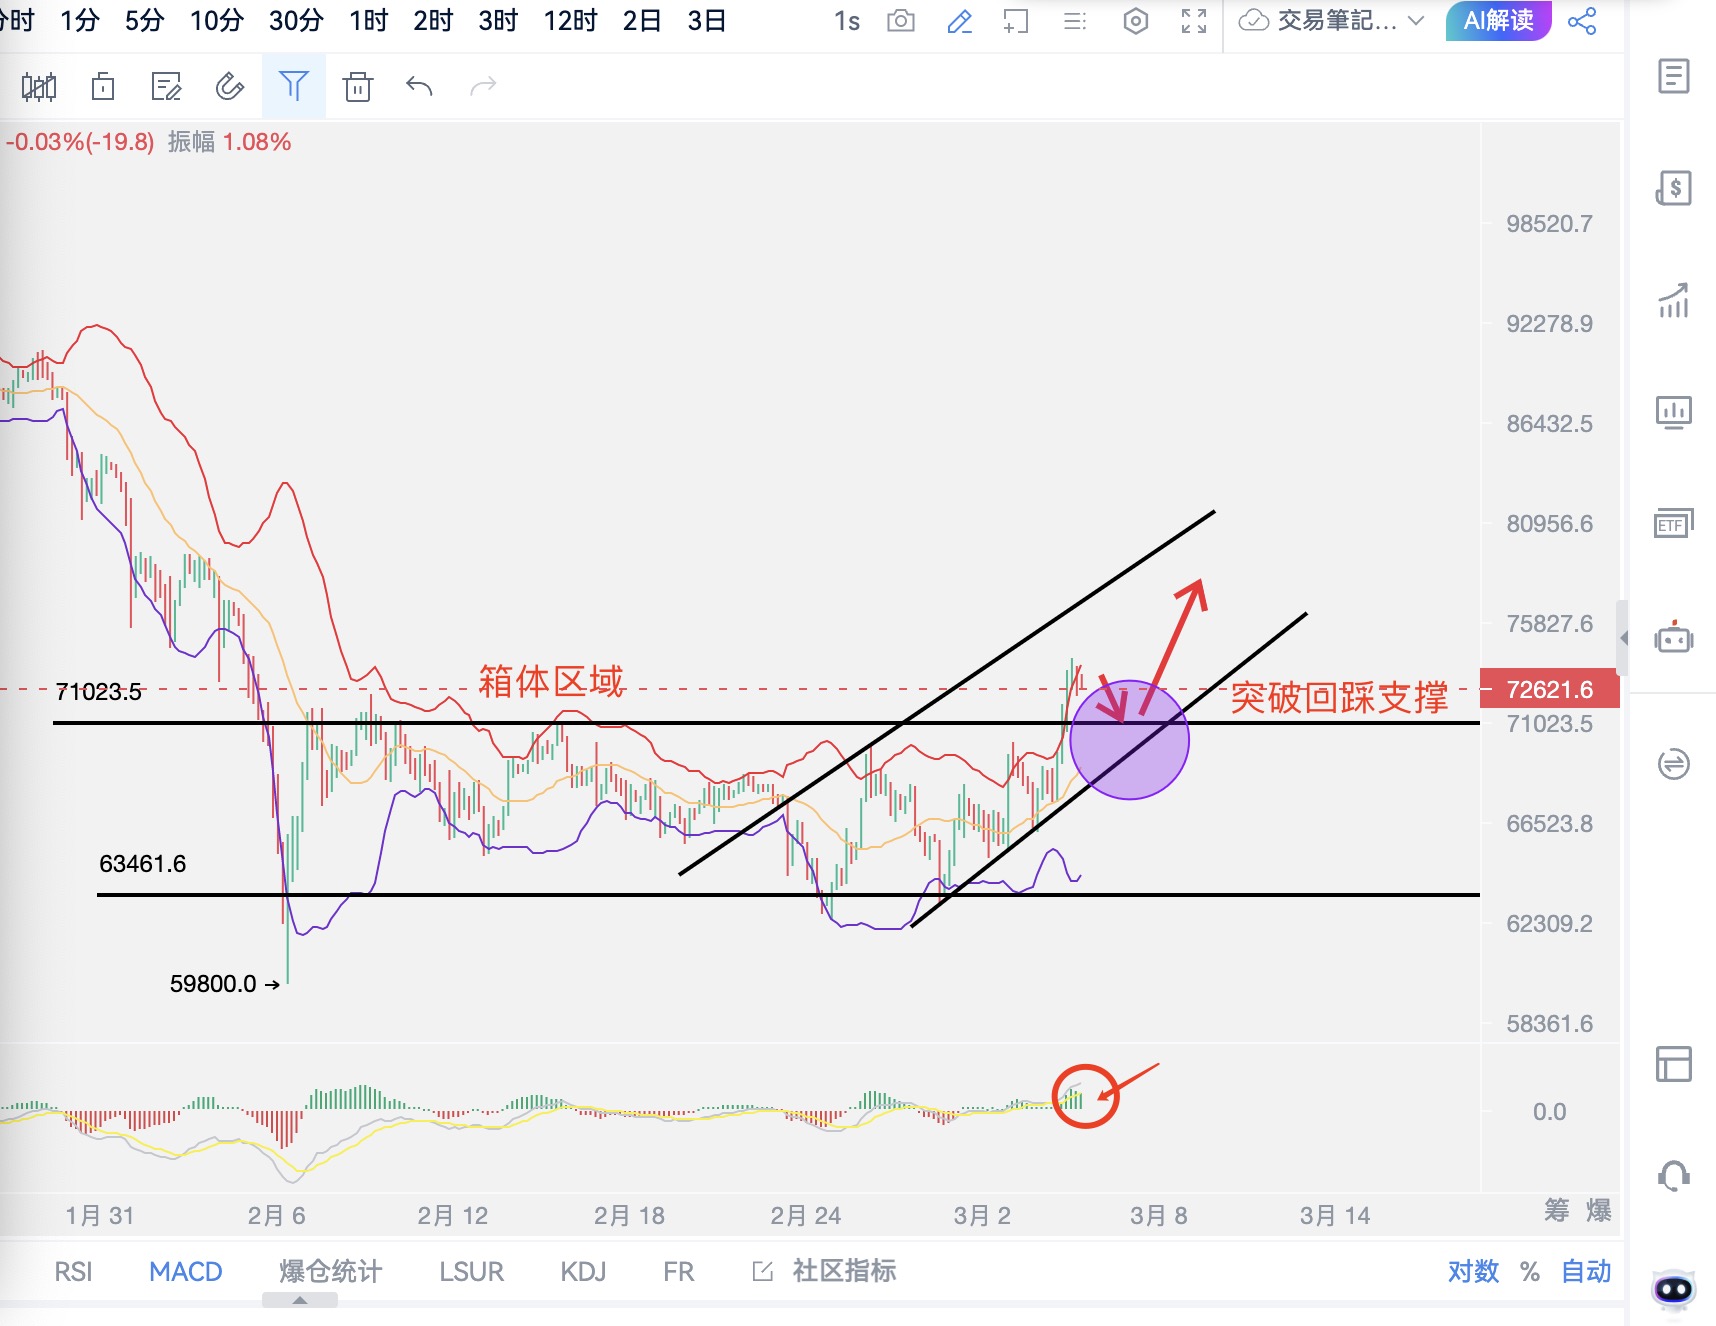
The four-hour cycle is the core of market dynamics; only with a small cycle maintaining a strong shape can the daily and weekly charts continue to strengthen. Currently, the four-hour market structure is clear, and the four consecutive bullish candles are climbing step by step, making the subsequent pullback space very limited, as the bulls are still the main theme of the market. If the market shows a very strong trend, a price retracement to the 71,500-72,000 area can be used to set up long positions looking for a rebound; this is the first ideal long entry point and a relatively safe pullback entry point. If the price unexpectedly weakens afterward, be mindful of the daily level's 70,000 integer point's top and bottom conversion support; the countermeasure plan is already prepared, just need to execute according to the trend!
Follow the public account, what can relieve worries, only Jiang Wei, a treasure analysis blogger full of emotional value, sharing trading education for free, bringing stable strength and clear guidance in a restless trading market, traversing through three rounds of bull and bear markets and years of practical trading experience, specializing in naked K, trend, Dow theory, Gann, harmonics, Chan theory, wave theory, and other technical analyses, gathering into personal unique insights.

免责声明:本文章仅代表作者个人观点,不代表本平台的立场和观点。本文章仅供信息分享,不构成对任何人的任何投资建议。用户与作者之间的任何争议,与本平台无关。如网页中刊载的文章或图片涉及侵权,请提供相关的权利证明和身份证明发送邮件到support@aicoin.com,本平台相关工作人员将会进行核查。