Technical Analysis:
Let’s look from short to long.
15-minute chart: In the last dozen or so hours, the price has fluctuated around $68,000, forming a small box. The three moving averages MA5, MA10, and MA20 have all merged together, indicating an unclear short-term direction. The MACD’s DIF line is above the zero axis, but the histogram (MACD Bar) has been showing multiple green bars (negative values) continuously, and they are getting longer, indicating that the short-term upward momentum is fading, showing signs of weakness. The RSI is hovering around 50, which is also a typical feature of a fluctuating market.
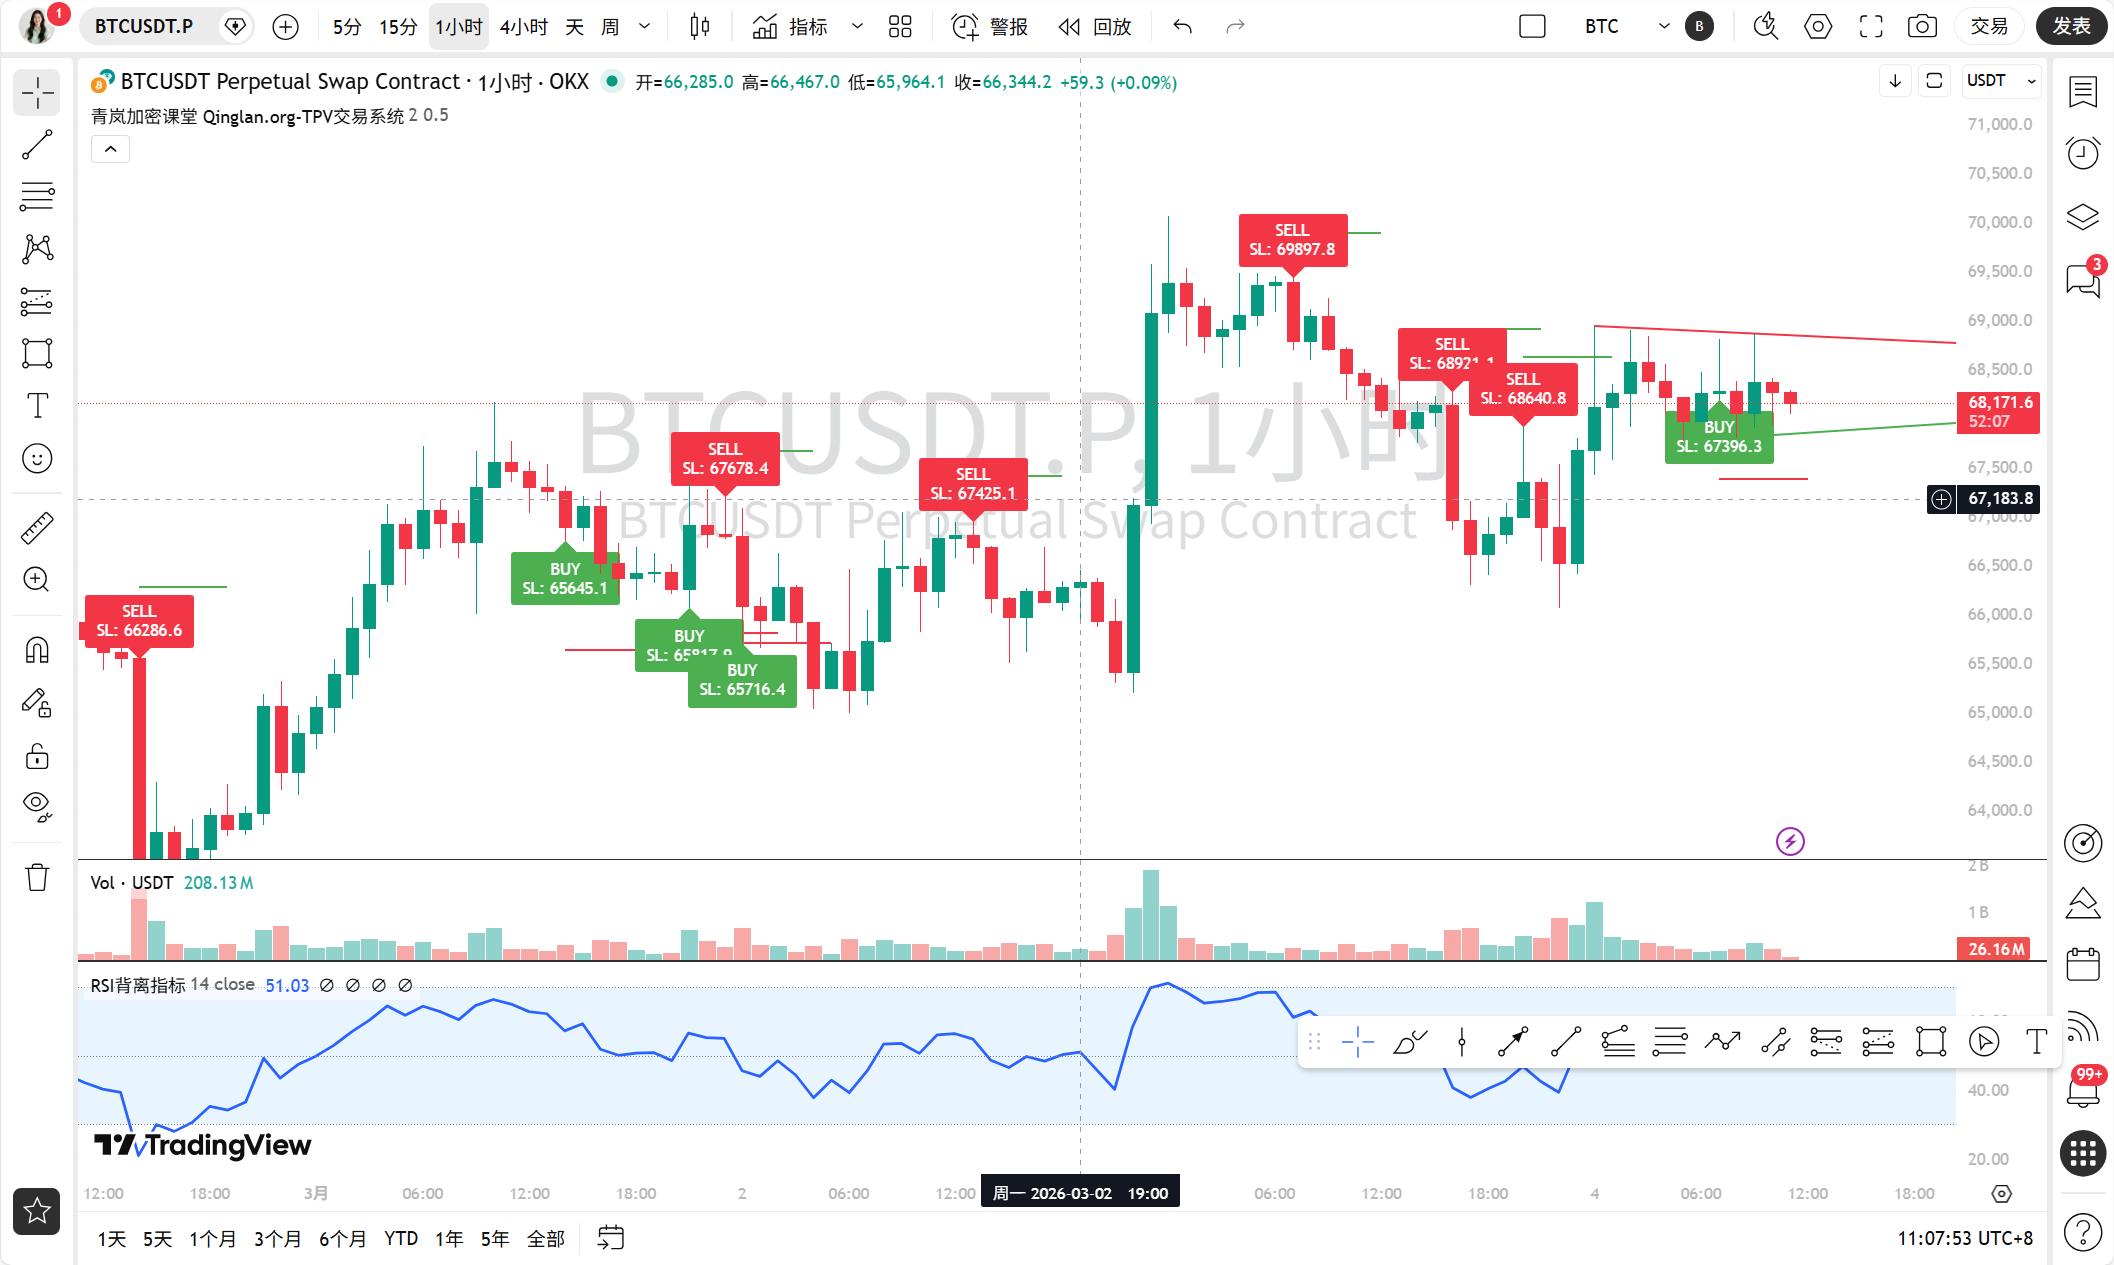
1-hour chart: The trend is somewhat clearer than the 15-minute chart. After rebounding from last night's low, the price is currently above all short-term moving averages (MA5, MA10, MA20), which is a short-term bullish signal. The MACD has just formed a golden cross above the zero axis not long ago, with the histogram turning red, but the length of the red bars is shortening, indicating that the strength of the upward movement is weakening and requires new momentum. The RSI is around 55, neither too hot nor too cold.
4-hour chart: This is a key timeframe. The price is fluctuating within a larger range of $67,000 to $69,000. The MA20 moving average (purple) is an important medium-term support, and the current price is above it. However, the situation with the MACD is interesting: after the price set a recent high near $70,000 on March 2, the recent high (about $68,900) is lower than before, but the high point of the MACD’s DIF line is higher than before, forming a potential top divergence, which is a bearish signal that requires caution. The RSI is around 57 and is still considered healthy.
1-day chart: The long-term trend is still in a downward channel. You can see, since the peak in mid-January, the highs have been continuously decreasing and the lows are also moving down. Although there was a strong rebound at the end of February, it has dropped back in recent days. The MACD is in deep water (far below the zero axis), but the green bars (negative value bars) are continuing to shorten, which is a signal that the downward momentum is slowing, belonging to a breathing or bottom-building phase in a long-term downward trend. The RSI is at 46, not yet returning above the 50 dividing line for bulls and bears.
News Integration:
On the news front, today is truly a "tale of two extremes."
Negative news is very concentrated: Geopolitical risks are the main feature! Iran controls the Strait of Hormuz, the South Korean stock market is circuit-breaking, and global risk-averse sentiment is intensifying, leading to a surge in gold and silver. Panic in traditional markets often spills over into the crypto market, leading to selling pressure. Meanwhile, a whale address has flipped from taking profits on long positions to shorting, with a massive amount of holdings; Ray Dalio at Bridgewater has once again expressed a bearish view on Bitcoin; the crypto fear index has also dropped to "extreme fear."
There is also good news, but it is more long-term and structural: for example, Binance is actively obtaining licenses and launching stock tokens; Visa is expanding its stablecoin partnerships; a state in the U.S. has passed a Bitcoin rights bill; and some institutions are bottom-fishing ETH. However, in light of the current geopolitical and risk-averse sentiment, these positives seem a bit like “too far water to quench immediate thirst.”
Comprehensive Forecast and Trading Ideas:
When considering the timeframes and news together, the conclusion becomes clear:
Short-term (15 minutes - 1 hour): Given that the arrangement of moving averages on the 1-hour chart is decent, it may continue to fluctuate around $68,000, with a slight possibility of testing the resistance at $69,000, but pressure above will be significant.
Medium-term (4 hours): This is the period that needs the most attention. The potential top divergence signal on the 4-hour chart, combined with the collective negative news, leads me to take a cautious bearish view on the medium-term trend. I believe that after some fluctuations, the probability of testing $67,000, or even the previous low around $66,000, is increasing.
Long-term (daily): The downward trend remains unchanged, and the current rebound seems more like a continuation of the decline. A true reversal requires the daily chart to stabilize above $70,000 and form a bottom structure, which is not yet visible.
Key Levels:
Resistance above: First, there is resistance in the range of $69,000-$69,200 (recent high), with strong resistance at the psychological level of $70,000.
Support below: In the short term, look at $67,800-$68,000 (dense moving average area), and if it falls below, then $67,000, followed by $66,000-$66,300 (previous low area).
Our Trading Ideas:
Aggressive traders: May consider shorting lightly when the price rebounds to the range of $68,800-$69,200 and shows signs of upward fatigue (such as long upper shadows, RSI overbought), with stop-loss above $69,500 and targets looking towards $68,000 and $67,000.
Cautious traders: It is recommended to mainly observe and not to chase highs. Patiently wait for the price to make directional choices. If it effectively breaks below $67,800 with volume, one can follow the trend and short lightly. If it unexpectedly breaks strongly above and stabilizes at $69,500, then the bearish logic needs to be reassessed.
Spot players: The current position is not suitable for large-scale accumulation, so patiently wait for better prices. If it falls to the strong support area of $66,000-$67,000, one can begin to accumulate in batches.
Finally, let me share a trading quote, which also reflects my mindset at the moment: “The market gives birth to opportunities in panic and buries risks in enthusiasm. Currently, patience is more precious than courage.” Let’s keep calm together and wait for the market to provide clearer signals!
For more quantitative disassemblies on how real-time news impacts market sentiment, it has been updated in my Qinglan Crypto Class: www.qinglan.org
免责声明:本文章仅代表作者个人观点,不代表本平台的立场和观点。本文章仅供信息分享,不构成对任何人的任何投资建议。用户与作者之间的任何争议,与本平台无关。如网页中刊载的文章或图片涉及侵权,请提供相关的权利证明和身份证明发送邮件到support@aicoin.com,本平台相关工作人员将会进行核查。