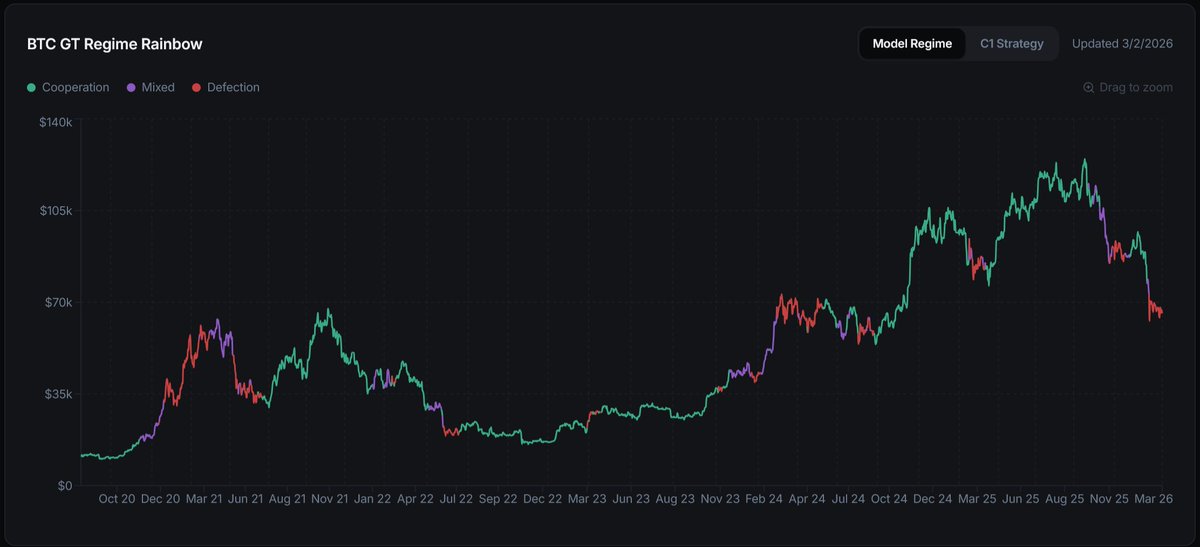
Our analyst @that1618 built the Game Theory Rainbow Chart. It identifies when Bitcoin players are coordinating to accumulate and when they're acting in self-interest.
It breaks into two regimes. Cooperation is when volatility drops, long-term holders start tilting up and exchange balances go down. Players are working together to keep price low and buy more.
Defection is the opposite. Volatility spikes, whale inflows pick up, funding and open interest stay elevated.
What's interesting is how differently these regimes behave. Defection burns out fast. Cooperation is sticky. Once it takes hold, the longer it runs the more likely it continues.
Right now we're 25 days into a defection regime which is unusually long.
On the chart, green zones represent cooperation. Orange zones represent optimized cooperation regimes that have persisted long enough to signal durability.
Historically these have been the most attractive periods for allocation.
免责声明:本文章仅代表作者个人观点,不代表本平台的立场和观点。本文章仅供信息分享,不构成对任何人的任何投资建议。用户与作者之间的任何争议,与本平台无关。如网页中刊载的文章或图片涉及侵权,请提供相关的权利证明和身份证明发送邮件到support@aicoin.com,本平台相关工作人员将会进行核查。


