Let's first look at the larger cycle to determine the direction.
Daily level (long-term trend): The current price (~68900) is firmly above all short-term moving averages (MA5/10/20). MA5 (67273) has already turned upwards, which is a positive signal. Although the MACD is still underwater, the green bars (BAR) have significantly increased for two consecutive days, and the fast and slow lines (DIF/DEA) are strongly converging, indicating that the downward momentum is exhausted and the long-term trend is shifting from decline to bottom building and rebound. Key resistance is in the prior high point area of 70000-71000, with support near MA5 (67200).
4-hour level (mid-term trend): This cycle is the clearest! After a deep pullback at the end of February, the price broke through the upper boundary of the previous trading range (around 66800) with a massive bullish bar last night (March 2), forming a standard "ascending triangle" breakout pattern (as mentioned in news item 18). The moving averages are currently in a bullish arrangement (MA5 > MA10 > MA20), and the MACD has continued to increase after a golden cross above the zero line, clearly indicating a mid-term upward trend. The first support level after the breakout is around the breakout point 66800-67000.
Now let's look at the smaller cycles to find the rhythm.
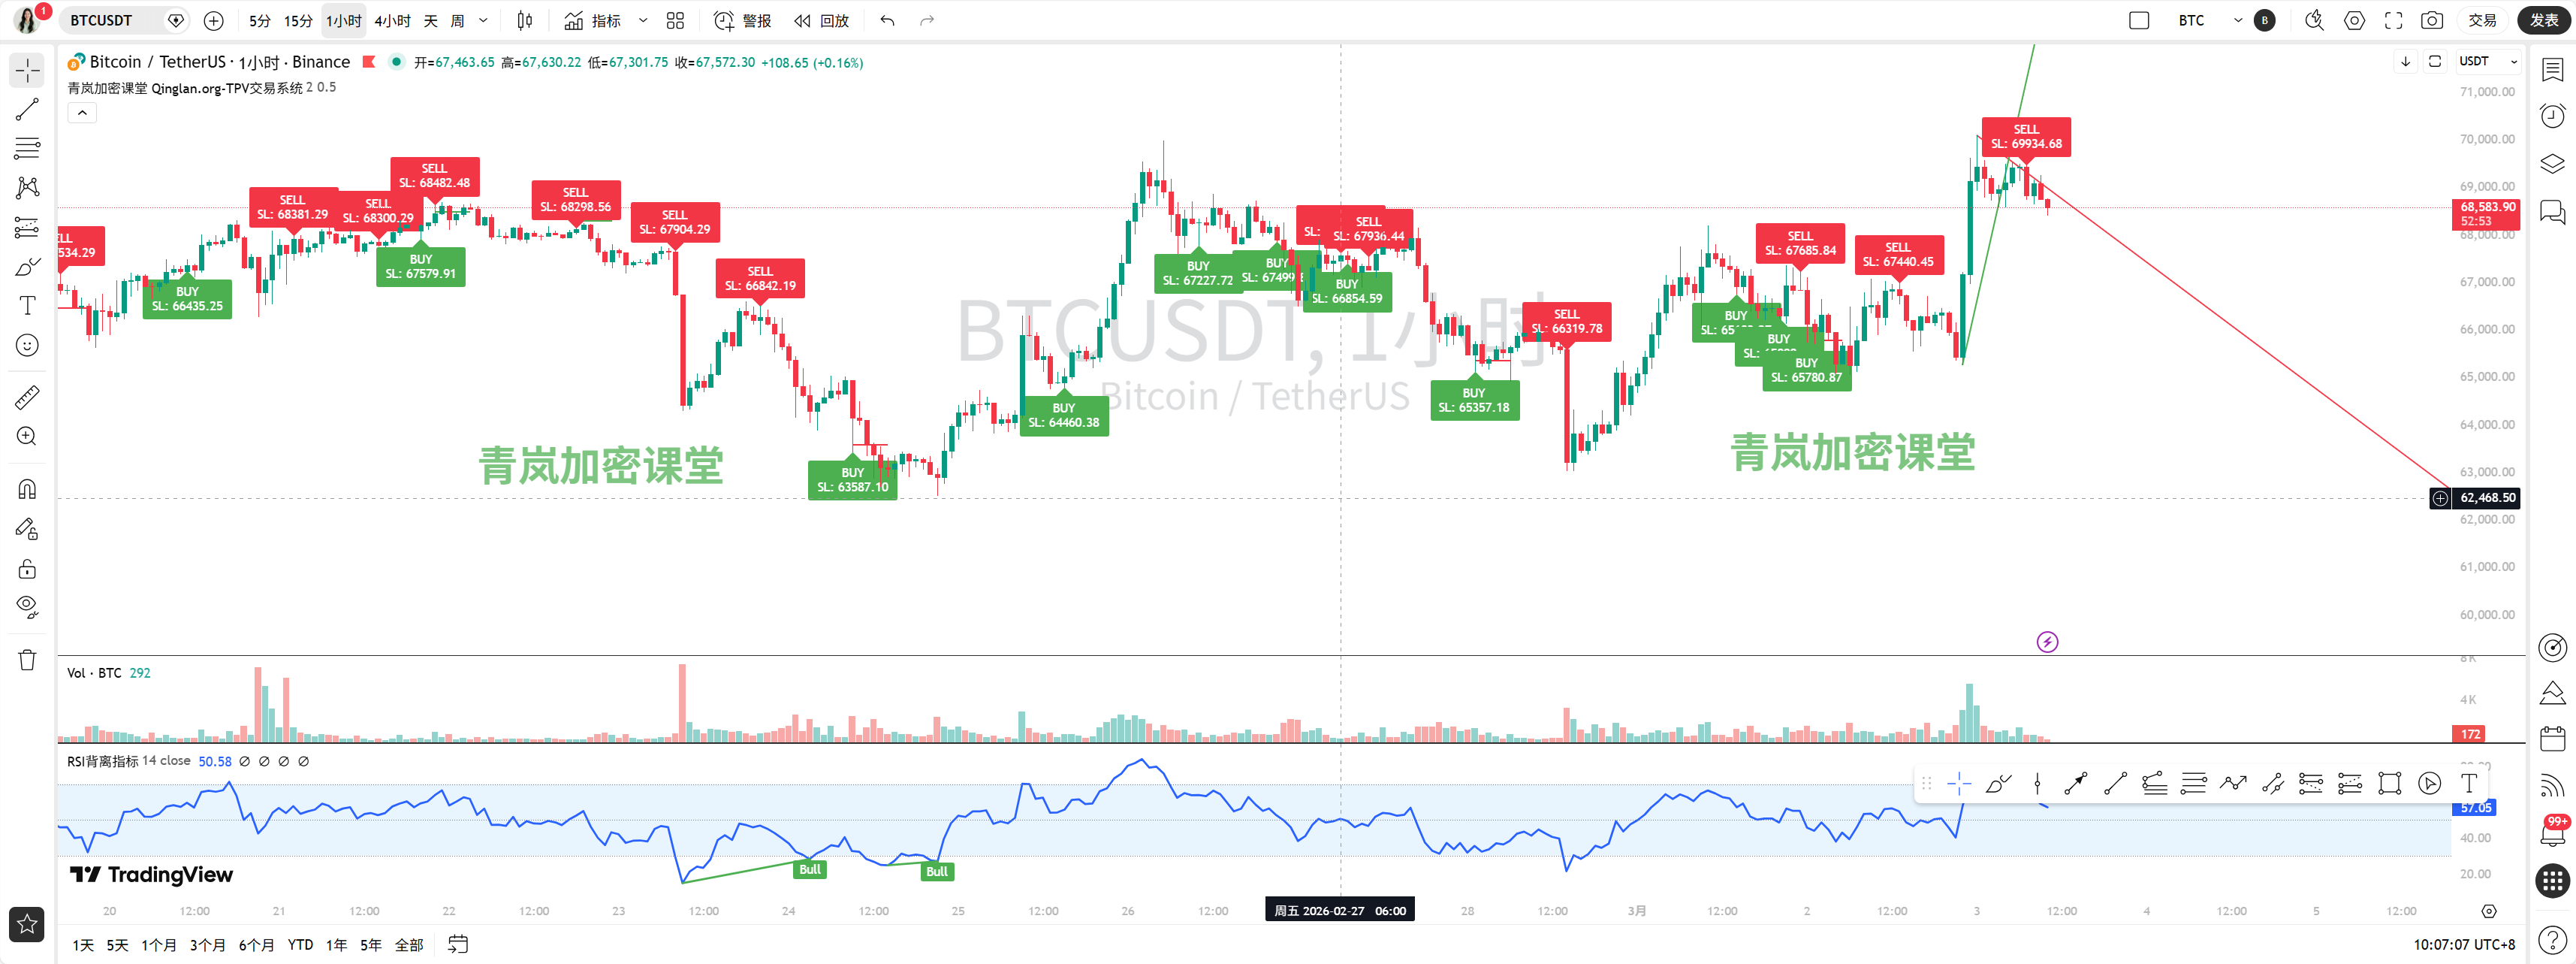
1-hour level (short to mid-term trend): The trend resonates with the 4-hour, with moving averages in a good bullish arrangement. After last night’s violent surge, the price is currently consolidating at a high level (69000-70000), which is a healthy process of digesting profit-taking. The MACD shows signs of flattening at a high level, and the RSI is around 70, indicating short-term overbought conditions, which may require some consolidation or slight pullback to correct the indicators. The trend remains upward, but in the short term, it may enter a consolidation phase.
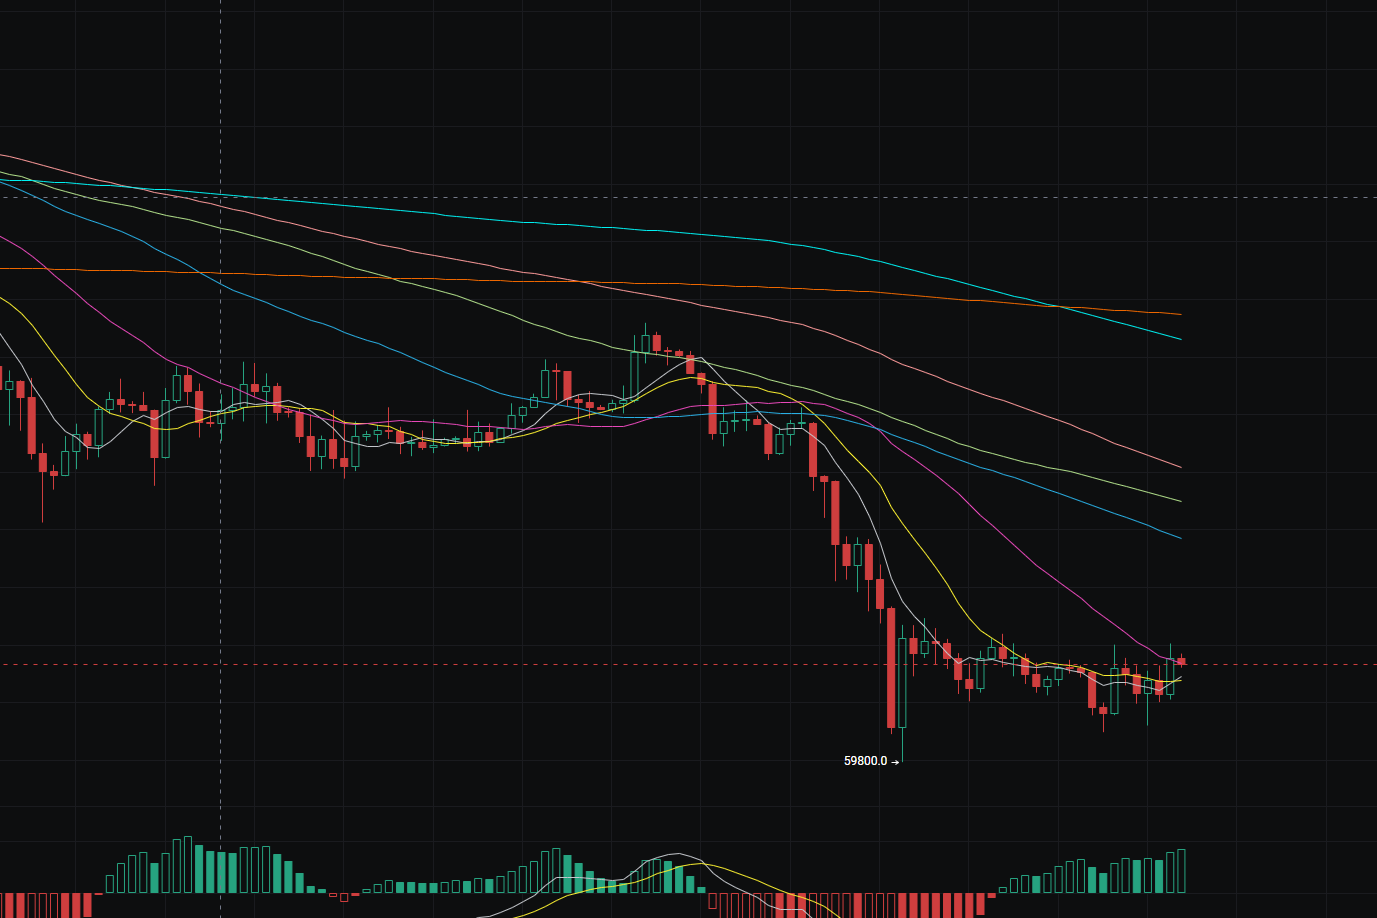
15-minute level (short-term trend): It perfectly illustrates the "surge-consolidation" process. After spiking up and retreating in the early morning, the price has formed a small box-shaped fluctuation between 68700-69400. The three lines MA5, MA10, MA20 are gradually converging, and the MACD is repeatedly swirling above the zero line, which is a typical short-term oscillation pattern, waiting for a direction choice.
Combining news and technical analysis for predictions:
On the news front, geopolitical issues (US-Iran conflict) are currently the core catalyst (items 8, 13, 16, 27, etc.). Historical data shows that at the onset of geopolitical crises, Bitcoin often acts as "digital gold" or a safe/risk asset, exhibiting significant volatility; last night’s violent surge is a testament to this. Meanwhile, VanEck's CEO indicated that “Bitcoin is bottoming” (item 4), crypto funds are raising capital significantly (item 23), and technical breakout patterns (item 18) are resonating, greatly boosting market confidence.
However, we must also recognize the risks: large whales are showing signs of shorting (item 45), and funding rates still indicate bearish sentiment in the market (item 42), signifying that there is still major disagreement between bulls and bears, caution is needed when chasing highs.
Comprehensive prediction and trading thoughts:
Therefore, our conclusion is very clear:
Trend direction: A mid to long-term (daily, 4-hour) upward trend has been established; in the short term (1-hour, 15-minute), it is in a high consolidation phase after an upward movement, digesting overbought conditions.
Key levels: Strong support is at 66800-67000 (the breakout point and 4-hour MA5), strong resistance is at 70000-71000 (previous psychological high). The lower support of the short-term consolidation range is at 68700, and the upper resistance is at 69500-69800.
Trading thoughts:
Follow the trend: The core idea is to buy on dips. The ideal entry position for long positions is in the 4-hour support area of 67000-67300, with a stop loss placed below 66500.
Follow through on breakouts: If the price breaks out effectively and stands firm at 70000 with volume, one can cautiously enter long positions, targeting 72000-73000.
Cautious high chasing: It is not advisable to heavily chase highs before a firm breakout in the 69500-70000 resistance zone. In the current 15-minute oscillation range, skilled traders can attempt to sell high and buy low, but conservative traders are advised to watch and wait for clearer direction.
For more quantifiable breakdowns of how real-time information affects market sentiment, please check my Qinglan Crypto Class: www.qinglan.org
Finally, I would like to leave everyone with a trading saying:
“When a trend comes, respond to it and follow it; when there is no trend, observe and remain still. The current trend is clear, what we need to do is wait for that pullback that belongs to our trading system.” Remember, do not let the market’s noise disrupt your rhythm, executing according to plan is the way to success!
免责声明:本文章仅代表作者个人观点,不代表本平台的立场和观点。本文章仅供信息分享,不构成对任何人的任何投资建议。用户与作者之间的任何争议,与本平台无关。如网页中刊载的文章或图片涉及侵权,请提供相关的权利证明和身份证明发送邮件到support@aicoin.com,本平台相关工作人员将会进行核查。