Hello, I am your old friend, Odaily specially invited market analyst Cody. Today is the seventh day of the first lunar month, and the Spring Festival holiday is basically coming to an end.
From the market performance, this week's market situation is similar to what we analyzed in our previous article — the rhythm is slow, mainly fluctuating, and there is no obvious directional volatility.
Bitcoin mainly operated in the $65,500 to $70,000 range over the past week, with an overall price structure maintaining a fluctuating consolidation, failing to effectively break through the upper pressure, and there are temporarily no signs of further weakening in volume at the lower levels.
So in this context, what is more suitable to do this week is not to hastily judge the trend direction, but to observe the structural changes within the range of fluctuations.
It is precisely in this phase of "slowing down of mainstream asset rhythms" that we can extend our focus to some relatively independent targets.
Therefore, this week's article will introduce a new cryptocurrency analysis for the first time — HYPE, combined with the results of a completed short-term operation, analyzing its current position and possible trading opportunities from the daily structure and wave perspective.

Core summary of the trading weekly report:
• Strategy execution (short term) effect verification: Based on strategy discipline, we did not carry out short-term operations last week, as Bitcoin price did not reach the anticipated pressure area.
• Strategy execution (medium term) effect verification: Bitcoin followed the established medium-term strategy last week, continuing to hold short positions opened at $89,000 (1x leverage), closing last week with approximately 24.01% profit, with a maximum profit of about 32.58% during the period.
• Core viewpoint (short term) verification: Bitcoin fluctuated between $65,500 and $70,000 last week. The current trend is consistent with our prior prediction of the market's fluctuating pattern.
• HYPE: Analysis of trend structure and short-term operational opportunities. (See detailed explanation in Figure 1)
Below, we will review market predictions, strategy execution, and specific trading processes in detail.
1. HYPE trend structure interpretation and short-term operation review:
HYPE daily candlestick chart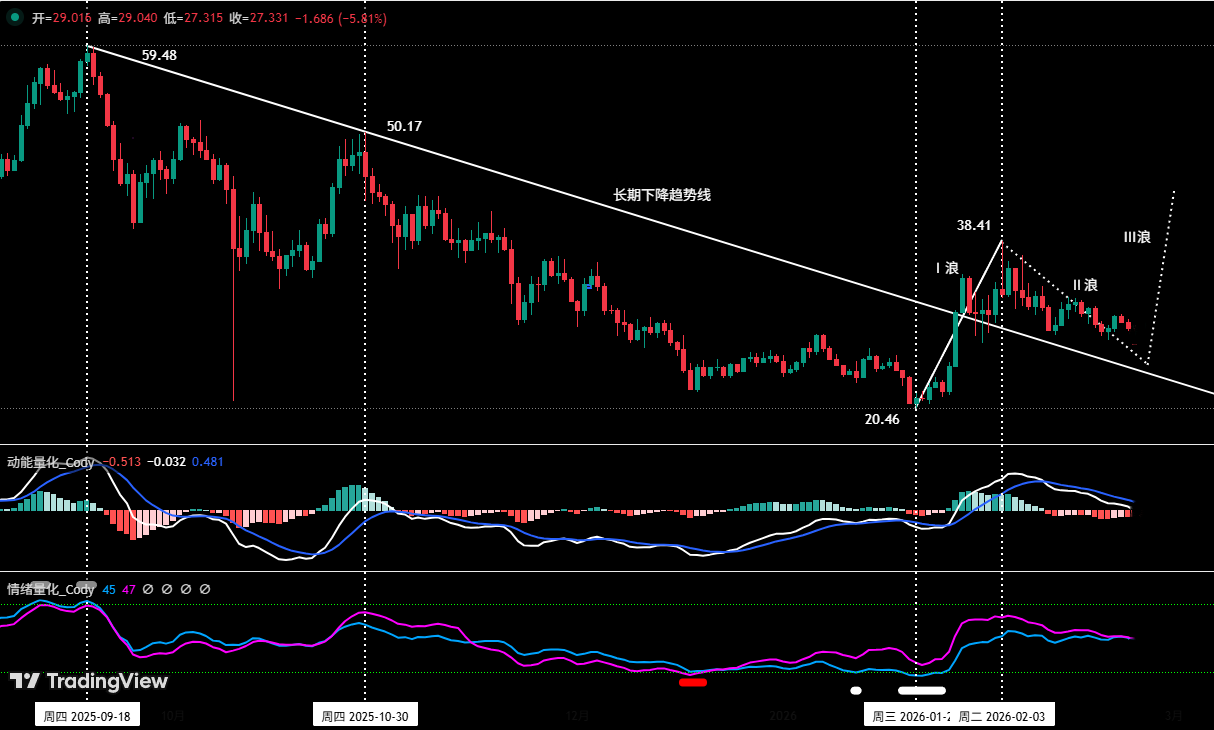
Figure One
1. Daily level structural framework (See Figure One)
HYPE stabilized around $20.46 on January 21, 2026, and began an independent upward trend. Currently, the price has confirmed a breakthrough of the long-term downtrend line connecting the September 2025 (approximately $59.48) and October 2025 highs (approximately $50.17), indicating a potential shift from the earlier bearish structure.
The daily trend structure can be initially divided as follows: (Based on the market situation after January 21)
• Wave 1 (Driving Wave): From January 21 ($20.46) to February 3 ($38.41), completing a rising wave segment.
• Wave 1 bottom prediction signals: Through self-constructed quantitative model analysis, at the end of Wave 1 (around January 21), the following occurred:
• Momentum quantitative model: shows momentum divergence signals.
• Sentiment quantitative model: triggered bottom warning signals (white horizontal bar in the chart).
The above signals together reinforced the prediction of Wave 1 forming an important bottom on January 21 ($20.46).
• Wave 2 (Corrective Wave): From February 3 ($38.41) to now, representing a correction of Wave 1.
• Key confirmation conditions for establishing Wave 3:
• Confirmation signals for the starting point of Wave 3:
a. If the subsequent price does not fall below the February 19 low of $27.73, that point can be confirmed as the end of Wave 2 and the starting point of Wave 3.
b. If the subsequent price falls below $27.73, but remains above the January 21 low of $20.46, then the current market situation is considered a continuation of Wave 2, and Wave 3 may not have started yet, necessitating the search for the next bottom signal.
• Confirmation signals for the endpoint of Wave 3:
The high point of Wave 3 must exceed the Wave 1 peak of $38.41. Only by clearly breaking through the previous high can the continuation of the upward trend be confirmed; otherwise, it may still belong to a rebound within a wide range of fluctuations or a downward structure.
2. HYPE short-term operation (1x leverage long)
• Opening decision: Based on the adjustment after the first rising trend at the hourly level, and the first pullback after the momentum line of the momentum quantitative model broke the zero line, with the price positioned above the key support area.
• Closing decision: The closing price was near the technical resistance level of $30.97.
• Transaction summary: This operation successfully captured the hour-level rebound wave segment, achieving a profit of approximately 4.71%.
2. Bitcoin's fluctuating market continuation: (02.16-02.22)
1. Short-term operation strategy review:
Since Bitcoin’s price did not reach the key pressure area set last week, and the self-constructed momentum quantitative model and spread trading model did not trigger top signals, we strictly executed the established short-term strategy and did not open positions last week.
2. Medium-term operation strategy review:
Medium-term strategy: Continue to hold 60% short positions opened around $89,000, earning 24.01% by the end of last week.
3. Last week's core point review:
Pressure point: $72,000 to $74,500 area
Support point: near $65,000
3. Bitcoin technical indicator analysis: Comprehensive judgment based on multiple models and dimensions
Combining market operations, I conducted an in-depth analysis of several technical indicators of Bitcoin based on the self-constructed trading system, from the perspectives of multiple models and dimensions.
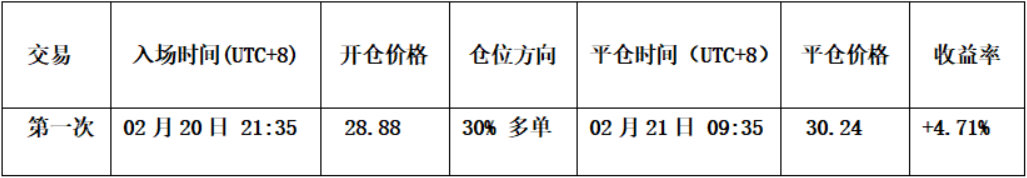
1. As shown in (Figure Two), from the weekly chart analysis:
Bitcoin weekly candlestick chart: (momentum quantitative model + sentiment quantitative model)
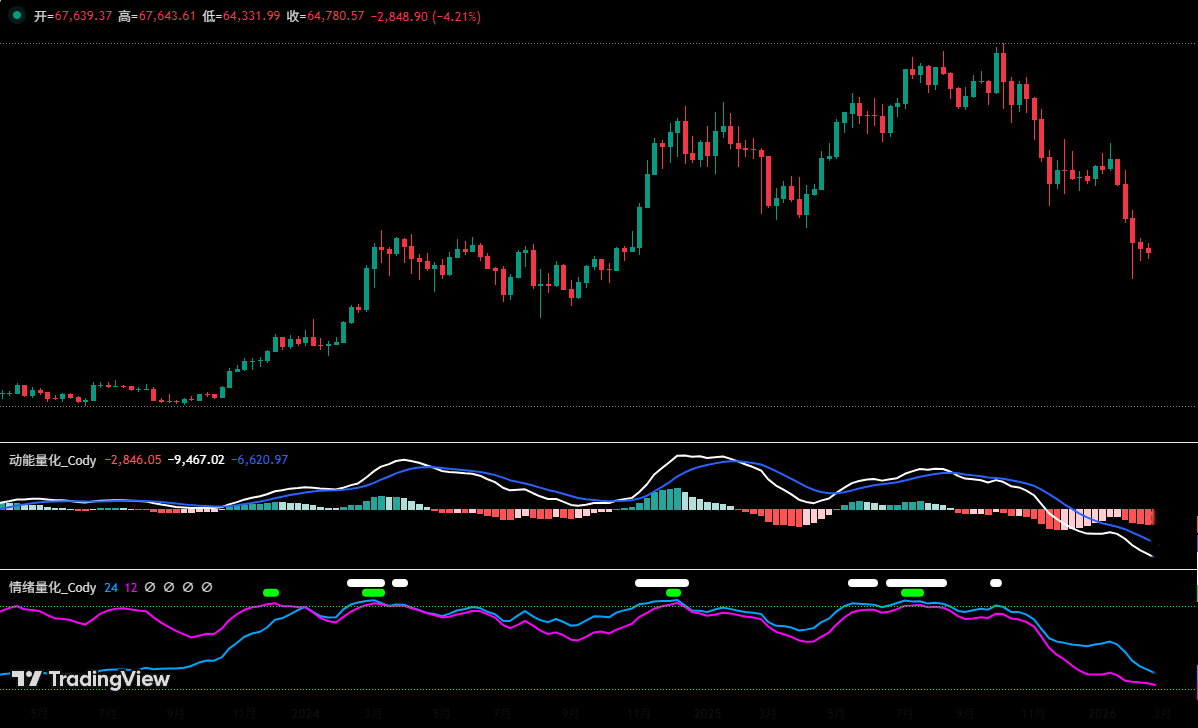
Figure Two
• Momentum quantitative model: Technical indicators show that the momentum line is simultaneously declining, with negative energy bars gradually amplifying for 4 consecutive weeks, without showing any momentum divergence signals.
Momentum quantitative model indicates: Bitcoin price decrease index: high
• Sentiment quantitative model: The blue sentiment line value is 27, with zero intensity; the purple sentiment line value is 10, with zero intensity, with a peak value of 0. This means that the market has not yet shown over-sold panic sentiment.
Sentiment quantitative model indicates: Bitcoin price bottom support index: neutral
• Digital monitoring model: No bottom digital monitoring signal has appeared.
Digital monitoring model indicates: No digital bottom signal has appeared; last week's candlestick closed with a small bearish line decreasing approximately 1.73%. The market shows that Bitcoin prices have exhibited a "high point moving down, low point rising" pattern for three consecutive weeks, overall constructing a converging shape.
The above data indicates: Bitcoin weekly bearish trend, narrowing decline. It is likely belonging to a declining continuation pattern.
2. As shown in (Figure Three), from the daily chart analysis:
Bitcoin daily candlestick chart: (momentum quantitative model + sentiment quantitative model)
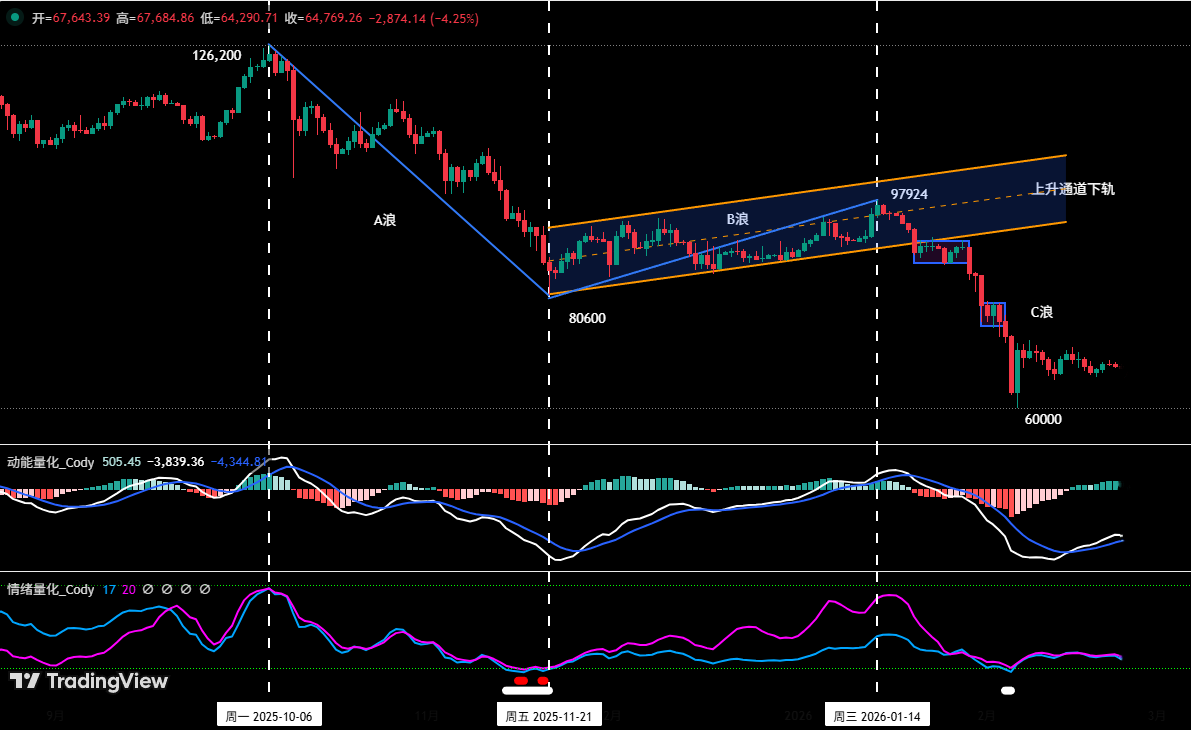
Figure Three
• Momentum quantitative model: Last week, the overall market presented a "narrow range sideways fluctuation" pattern. The momentum line formed a "golden cross" below the zero line and then moved upward, with positive energy bars gradually expanding.
Momentum quantitative model indicates: bullish rebound momentum is being released, with volume changes needing to be observed.
• Sentiment quantitative model: After the earlier sentiment quantitative model triggered the bottom warning signal (white point), the sentiment line’s direction turned upward. Currently, the blue sentiment line value is 20, with zero intensity; the purple sentiment line value is 22, with zero intensity. The two lines are almost sticking together, slowly exiting the oversold area.
Sentiment quantitative model indicates: The sentiment line turning upward, the validity of the bottom warning signal has been verified by the market; however, the sticking state of the two sentiment lines indicates that mid-line and short-line buying momentum is inactive, and Bitcoin's rebound strength is relatively weak.
The above data suggests: The daily bearish trend has not changed; in the short term, an oversold rebound trend continues.
4. This week’s market prediction: (02.23-03.01)
1. Bitcoin’s upward central formation (based on the market after the February 6 low):
Bitcoin 4-hour candlestick chart
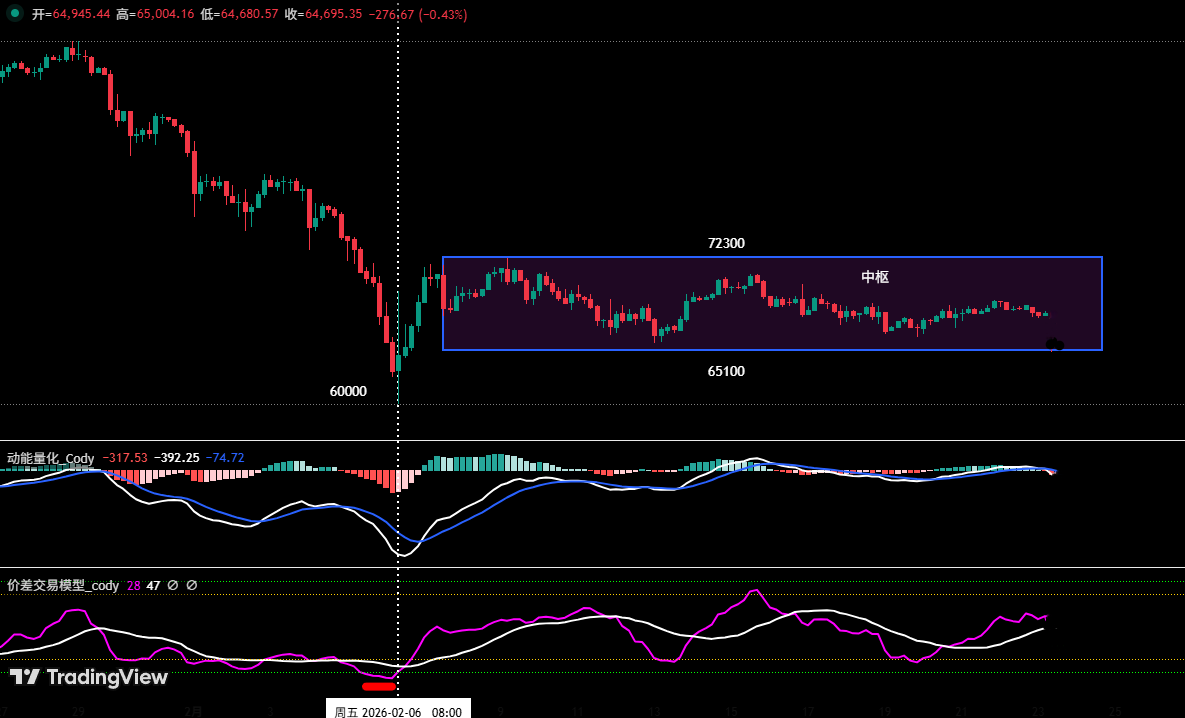
Figure Four
Using Bitcoin 4 hours as the operating cycle:
• Central determination: The 4-hour chart indicates: There is a high probability of constructing an “upward central” structure, with the upper resistance at approximately $72,300 and the lower support at about $65,100.
• Core deduction and operational plan:
• Situation One (Failure to Breakthrough): If the subsequent Bitcoin price rebound fails to effectively stand above the central upper track (around $72,300), the central fluctuation pattern will be maintained. In terms of operations: longs should consider reducing positions at high points.
• Situation Two (Successful Breakthrough): If the subsequent Bitcoin price rebound effectively stabilizes above the central, it will confirm a successful breakthrough. In terms of operations: The upward trend may continue, longs can be held temporarily, waiting for liquidation signals.
• Situation Three: If the subsequent Bitcoin price adjustment effectively breaks below the central lower track (around $65,100), it will again test the support effect of the February 6 low.
2. This week’s core viewpoint: Focus on the struggles for gains and losses near the central upper and lower tracks. The strategy should firmly execute the principle of “reduce positions at high points (longs), control risks”.
3. Core pressure points:
• First pressure area: $72,300 to $74,500 area (near the April 2025 low)
• Second pressure area: $79,500 to $80,600 area (near the starting point of Wave B)
4. Core support points:
• First support point: near $65,000 (previous K-line low point)
• Second support point: $60,000 to $62,500 area (near the February 6 low)
• Third support point: around $57,400 (near the 210-week moving average)
5. This week’s operating strategy (excluding the impact of unexpected news): (02.23-03.01)
1. Medium-term strategy: Maintain 60% short positions. If rebound effectively breaks through $74,500, the position can be reduced to 40%.
2. Short-term strategy: Utilize 30% position, set stop-loss points, and seek "spread" opportunities based on support and resistance levels. (Using 30 minutes/60 minutes as the operating cycle).
3. Given that the mid-term market direction is bearish, short-term operations should follow the principle of "act according to the trend, short at the high points." To dynamically respond to the complex evolution of the market and in combination with the signals emitted by the self-built trading model, we propose two short-term operation plans A/B:
• Plan A: If the price rebounds near the central upper track $72,300:
• Opening a position: When the rebound reaches that resistance level triggering a阻信号 and combining with model top signals, a 15% short position can be established.
• Risk control: Initial stop-loss for shorts set above $75,500.
• Closing: When it drops near an important support level combined with model signals, positions can be gradually liquidated for profit.
• Plan B: If the price rebounds near $74,500:
• Adding a position: When the rebound meets resistance in that area combined with model top signals, an additional 15% short position can be added.
• Risk control: Initial stop-loss for shorts set above $75,500.
• Closing: When it drops to the support level combined with model signals, positions can be gradually liquidated for profit.
6. Special reminder:
1. When opening a position: Immediately set the initial stop-loss level.
2. When profit reaches 1%: Move the stop-loss level to the opening cost price (break-even point) to ensure capital safety.
3. When profit reaches 2%: Move the stop-loss level to the 1% profit position.
4. Ongoing tracking: Following this, for every 1% further profit, the stop-loss level will be moved 1% simultaneously, dynamically protecting and locking in profits.
The financial market is changing rapidly, and all market analyses and trading strategies need to be dynamically adjusted. All viewpoints, analytical models, and operational strategies mentioned in this article originate from personal technical analysis, and are for personal trading logs only, not constituting any investment advice or operational basis. The market has risks, investments require caution, please do not make decisions based on this.
免责声明:本文章仅代表作者个人观点,不代表本平台的立场和观点。本文章仅供信息分享,不构成对任何人的任何投资建议。用户与作者之间的任何争议,与本平台无关。如网页中刊载的文章或图片涉及侵权,请提供相关的权利证明和身份证明发送邮件到support@aicoin.com,本平台相关工作人员将会进行核查。


