Original title: When Bitcoin Bottoms
Original link: @abetrade
Compiled by: Peggy, BlockBeats
Editor's note: When Bitcoin is experiencing lackluster performance, while gold and US stocks continually reach new heights, the narrative that "funds are rotating from precious metals to crypto assets" is once again gaining popularity in the market. This article does not draw trading conclusions based on this intuitive judgment but instead returns to the data itself, systematically examining whether there exists a verifiable long-term relationship between Bitcoin and gold.
Through correlation and cointegration analysis, it can be seen that Bitcoin and gold do not exhibit a robust mean-reversion or "one rises while the other falls" structural relationship. The so-called rotation is more of a post-event explanation rather than a repeatable, verifiable market mechanism. Bitcoin is neither a safe-haven metal nor a stock index; it is an independent market with extremely high volatility and an evolving structure.
The article further points out that in determining Bitcoin's bottom, it is more useful to focus on the real factors that dictate market direction, such as positions, derivatives structure, and sentiment clearout, rather than applying analogies from other assets. Historical experience shows that most true bottoms form when almost everyone has already given up.
Below is the original text:
The crypto market is currently not very hot. Just as stock and metal prices continue to reach historical highs, crypto assets have been stuck on the "pain train" since last October.
Recently, there has been a pervasive statement: "Funds are rotating from precious metals to crypto assets, and it's going to happen at any moment." Unfortunately, those who express this view are often well-known "talking heads" in the industry, and their only consistently profitable PnL comes from the interaction share they receive monthly on platform X.
I want to take some time to analyze whether this so-called "rotation from precious metals to crypto" actually has a substantial basis (spoiler alert: it doesn't), and then share some key turning points in crypto market history, along with how you can identify these moments.
The Relationship Between Bitcoin and Gold
First, an obvious question arises: if you want to find some relationship between gold peaking and Bitcoin’s performance, the premise is that gold itself must frequently "peak." However, in fact, there have been very few significant peaks for gold in the past decade.
"Getting pumped" is certainly exhilarating, but when throwing out opinions online, it’s best to have data to back it up so you don't sound like a complete fool. In the past decade, gold has only experienced three significant corrections: in 2018, 2020, and 2022. In other words, there are only three data points. Just this alone is enough to stop me from continuing my investigation; however, in order to complete this article, let’s delve a bit further.
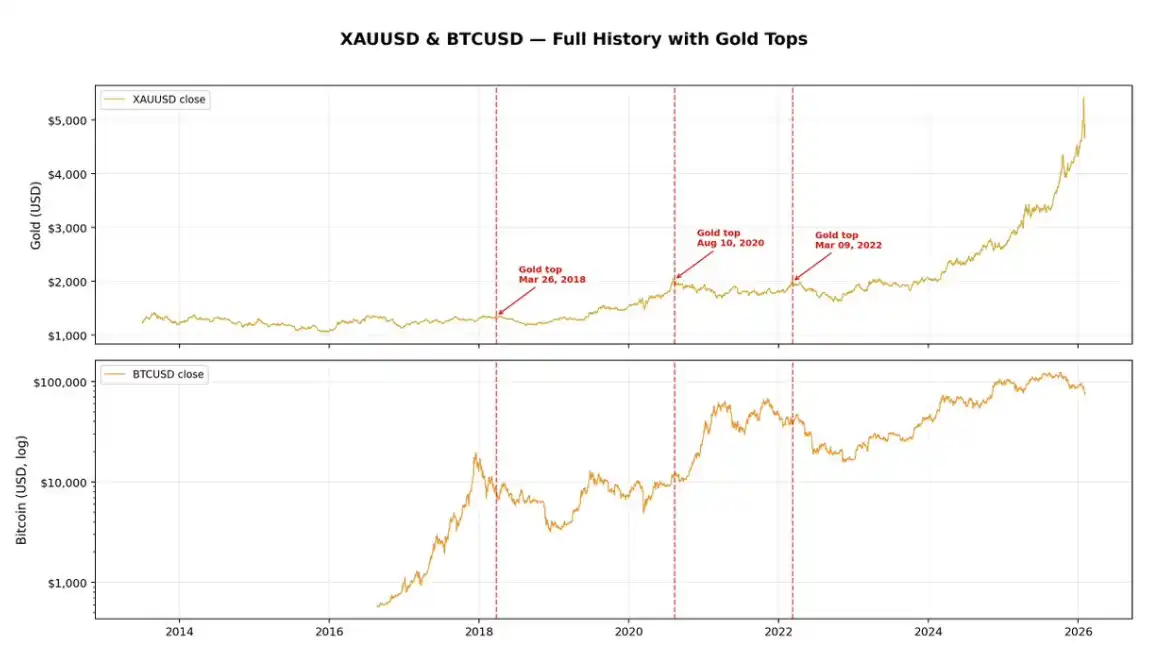
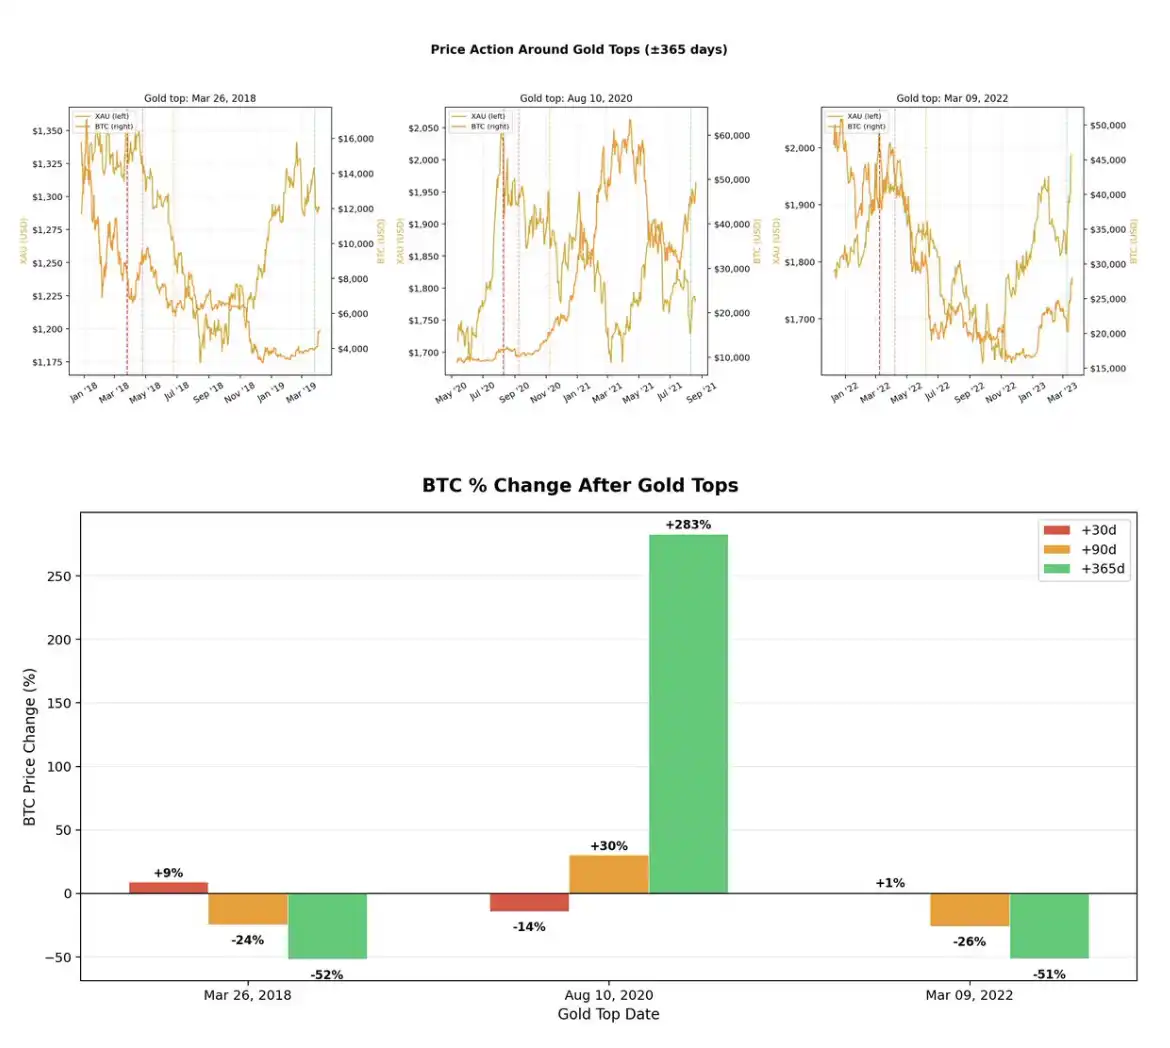
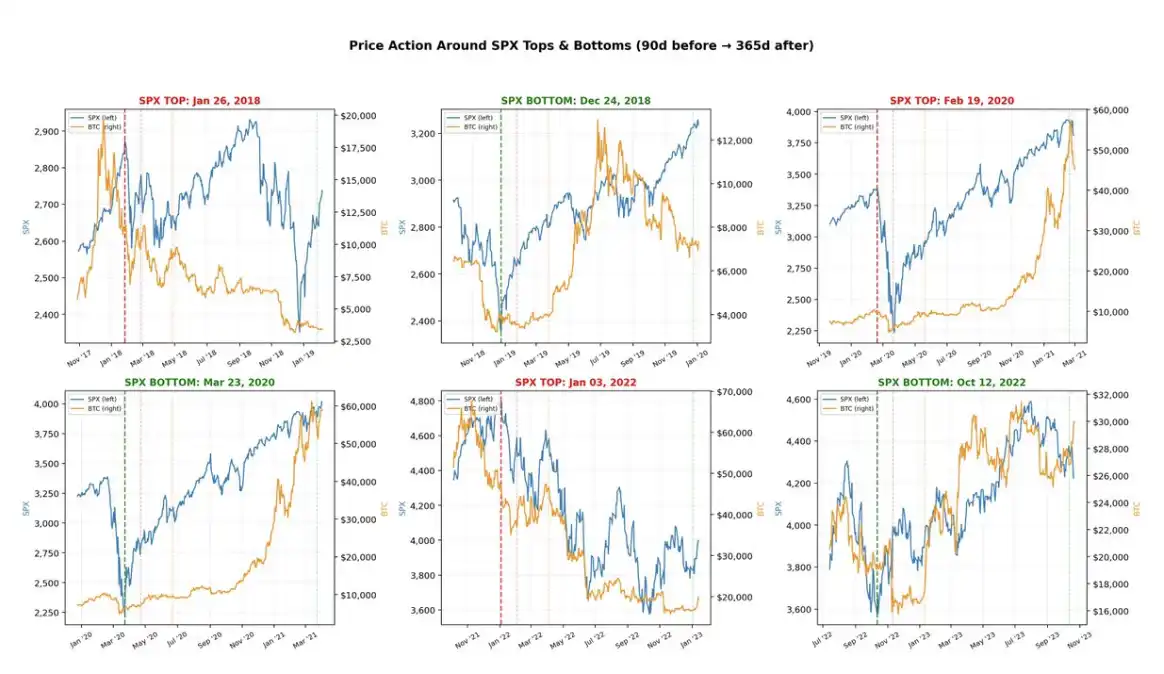
If you look at the chart above, you'll find that during the three phases of gold's highs, two actually occurred before Bitcoin's downward trend, specifically in 2018 and 2022. The only time Bitcoin strengthened after a gold correction was during the 2020 period of typical "risk-on" frenzy.
In the data from the past roughly ten years, the overall correlation coefficient between Bitcoin and gold is close to 0.8, which is not surprising—because in the long term, both markets have been rising. However, correlation cannot answer the real questions you care about.
If you want to determine whether there exists a relationship of "one rises while the other falls, strong and weak rotation, and eventual return," merely looking at correlation is not enough; you need to look at cointegration.
Cointegration
Correlation measures: whether two assets "rise and fall together" in daily fluctuations.
Cointegration, however, asks a different question: do these two assets maintain a stable relationship over the long term, such that once deviated, they will be pulled back together?
You can imagine this as two drunk people trying to walk home together:
They may each stumble and sway, taking messy routes (non-stationary), but if the two are tied together by a rope, they cannot stray too far apart. That "rope" is the cointegration relationship.
If the narrative "funds are rotating from gold to crypto assets" really has substantive content, then you should at least see a cointegration relationship between Bitcoin and gold—meaning that when gold surges significantly while Bitcoin lags, there should be some real force in the market that pulls both back onto the same long-term trajectory.
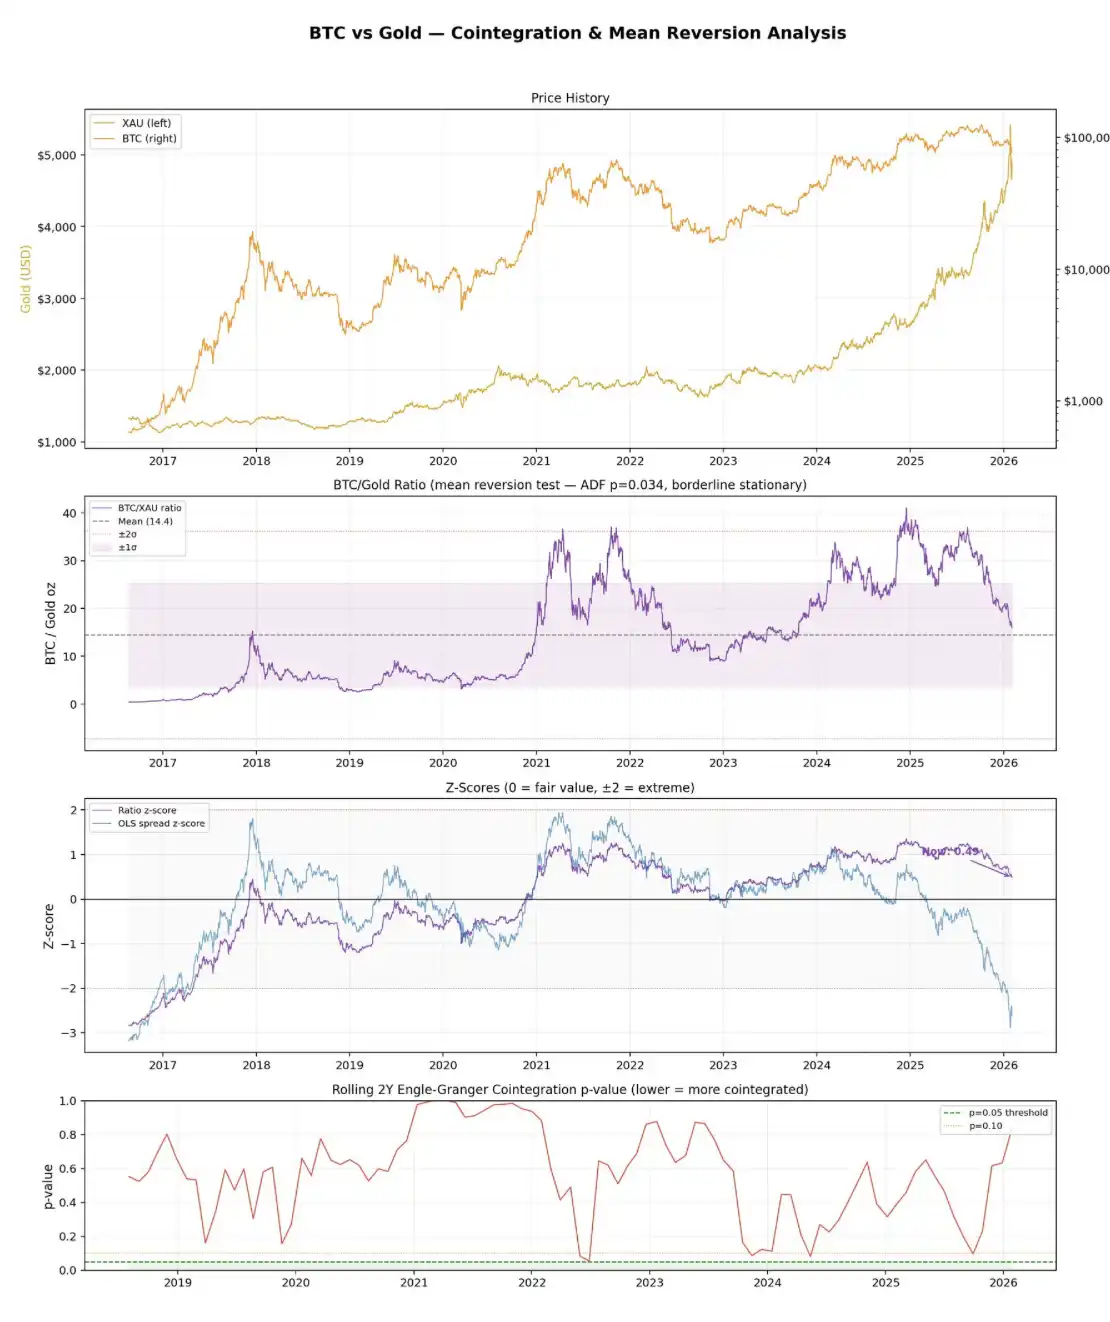
Combining the chart above, the data actually conveys the following message: the Engle–Granger cointegration test found no cointegration relationship.
The full sample p-value of 0.44 is far higher than the usual significance threshold of 0.05. Further examining rolling two-year windows, none of the 31 intervals showed a cointegration relationship at the 5% significance level. At the same time, the price difference residual itself is also non-stationary.
A simpler BTC / gold ratio appears slightly "optimistic," but not much. Applying the ADF test to this ratio only shows it to be marginally stationary (p = 0.034), implying it may have very weak mean-reversion characteristics. However, the issue is that its half-life is approximately 216 days, or nearly 7 months—slow to an absurd degree, almost completely drowned out in noise.
At current levels, Bitcoin's price is approximately equivalent to 16 ounces of gold, about 11% higher than the historical average of 14.4. The corresponding z-score is -2.62, suggesting that historically, Bitcoin appears "cheap" relative to gold.
But the crux is here: this reading is primarily driven by gold's recent parabolic rise, rather than any reliable mean-reversion relationship that would pull them back together.
In fact, there is no robust cointegration relationship. They are essentially two completely different kinds of assets: gold is a mature safe-haven asset; Bitcoin is a high-volatility risk asset that just happens to show an upward trend within the same timeframe.
If you have no idea what all this means, here is a super brief version of statistics:
The Engle–Granger test is the standard method for determining cointegration relationships. It first regresses the two assets and then checks whether the regression residuals (i.e., the "price difference" between them) are stationary—whether they fluctuate around a stable mean rather than drifting indefinitely. If the residuals are stationary, it indicates that there is a cointegration relationship between the two assets.
The ADF test (Augmented Dickey-Fuller) is used to test whether a time series is stationary. Essentially, it tests whether there is a "unit root," which simply means whether this series will diverge in a trending manner or revert back to the mean.
A p-value below 0.05 means you can reject the "unit root" hypothesis, considering the series to be stationary, indicating mean-reversion.
The half-life describes how quickly mean-reversion occurs. If a price difference has a half-life of 30 days, it means that after it is widened, it will take about a month to restore half of the deviation.
Short half-life = valuable for trading;
Long half-life = basically only useful for "holding long and praying."
Ultimately, I have always felt that trying to fit Bitcoin into any traditional financial asset relationship is absurd. Most of the time, people just use this comparison to cater to the narrative that best suits their position at the moment: today Bitcoin is "digital gold," tomorrow it becomes "leveraged Nasdaq."
In contrast, its correlation with the stock market is much more real. Over the past five years, Bitcoin's tops and bottoms have been highly synchronized with the S&P 500 (SPX)—up until now, where SPX remains firmly near historical highs, while Bitcoin has already retraced 40% from its peak.
For this reason, you should view Bitcoin as an independent existence. It is not a metal—no one would consider an asset with an annualized volatility exceeding 50% as a safe haven asset (by comparison, gold's annualized volatility is around 15%, and even so, it is considered relatively high volatility among "store of value" assets).
It is also not a stock index—Bitcoin has no constituent stocks; it is essentially just a piece of code.
Over the years, Bitcoin has been continuously fitted with various narratives: payment tool, store of value, digital gold, global reserve asset, etc.
These claims sound great, but the reality is that this is still a relatively young market, and it is difficult to assert whether it possesses clear and stable practical uses beyond being a "speculative asset." At the end of the day, treating it as a speculative asset is not a problem; the key is to maintain a clear and realistic understanding of this point.
The Bottom
Trying to reliably find the bottom of Bitcoin is extremely difficult—of course, no market is easy, but Bitcoin’s issue is that it has changed so rapidly over the years that historical patterns themselves have become increasingly less valuable for reference.
Ten years ago, the market structures for gold and the S&P 500 (SPX) had not changed significantly compared to now;
but in 2015, one of the main uses for holding Bitcoin was still to buy heroin online.
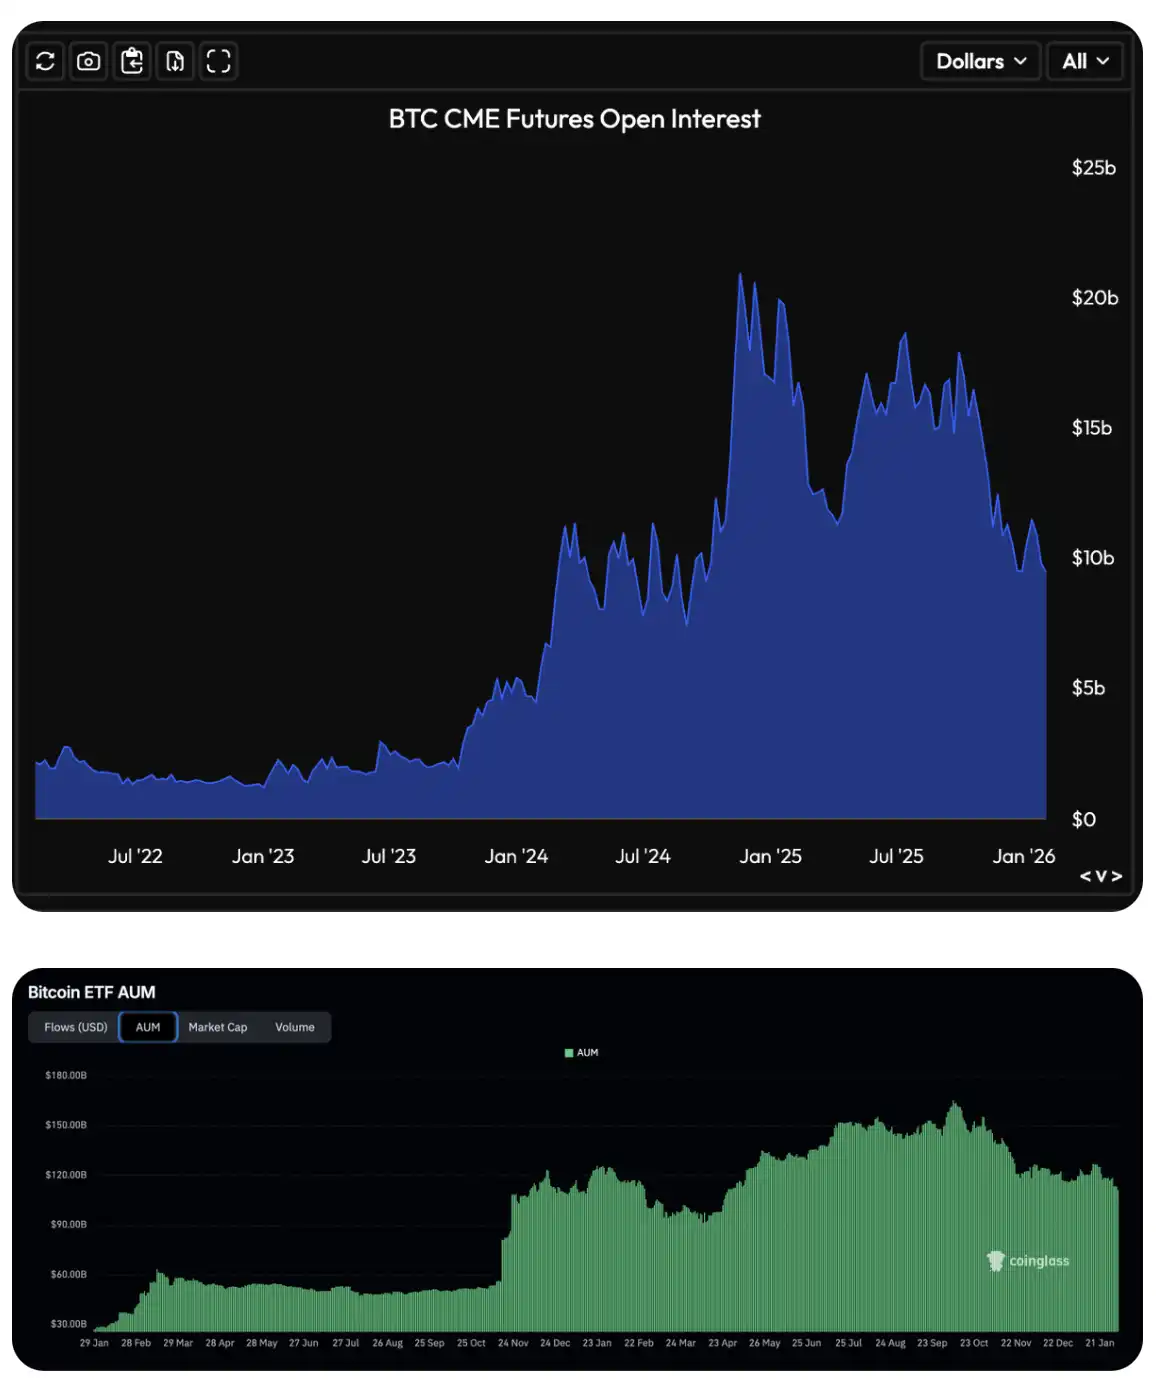
This has clearly undergone a dramatic change. Nowadays, participants in the market are much more "serious," especially after the significant increase in open interest for CME Bitcoin futures and options in 2023 and large-scale institutional funds entering the market after the launch of Bitcoin ETFs in 2024.
Bitcoin is a highly volatile market. If there is one conclusion we can relatively reliably state, it is that market bottoms are often accompanied by severe overreactions in a variety of derivatives and "liquidation cascades."
This signal is reflected both in crypto-native indicators, such as extreme fluctuations in open interest and funding rates, as well as in more institutional indicators, such as options skew and anomalous changes in ETF fund flows.
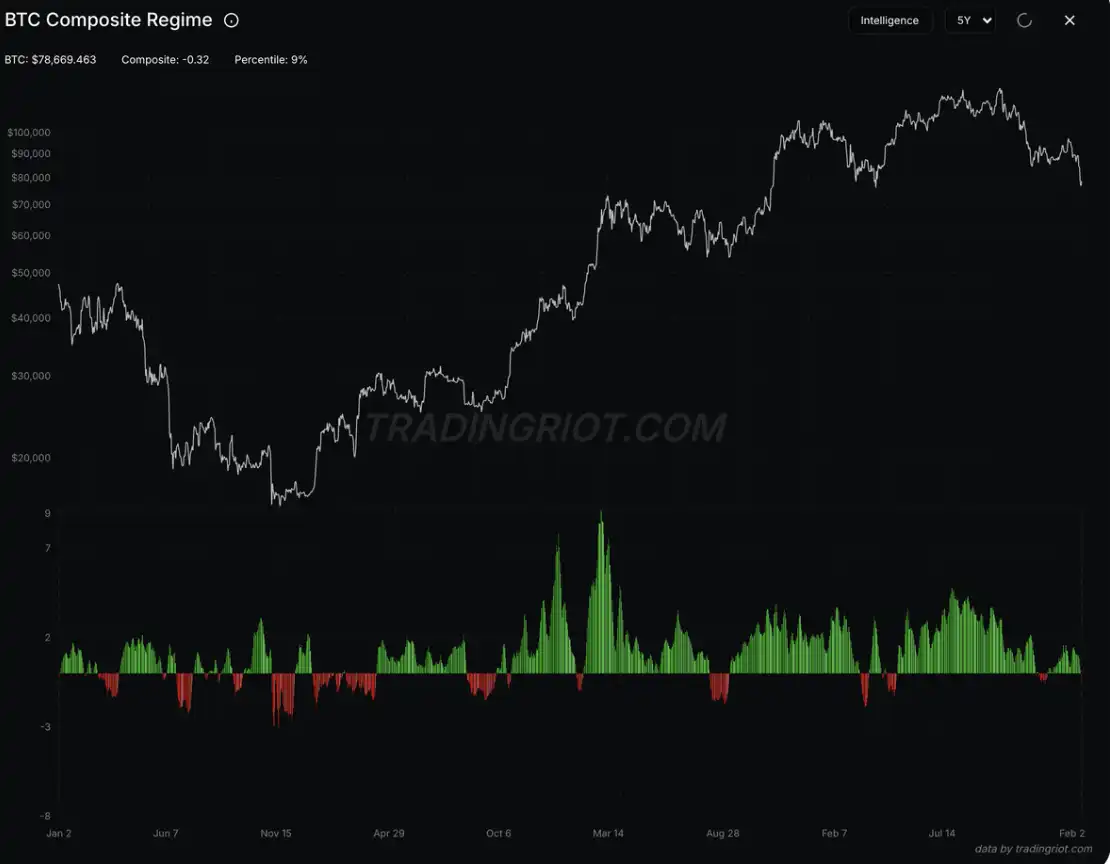
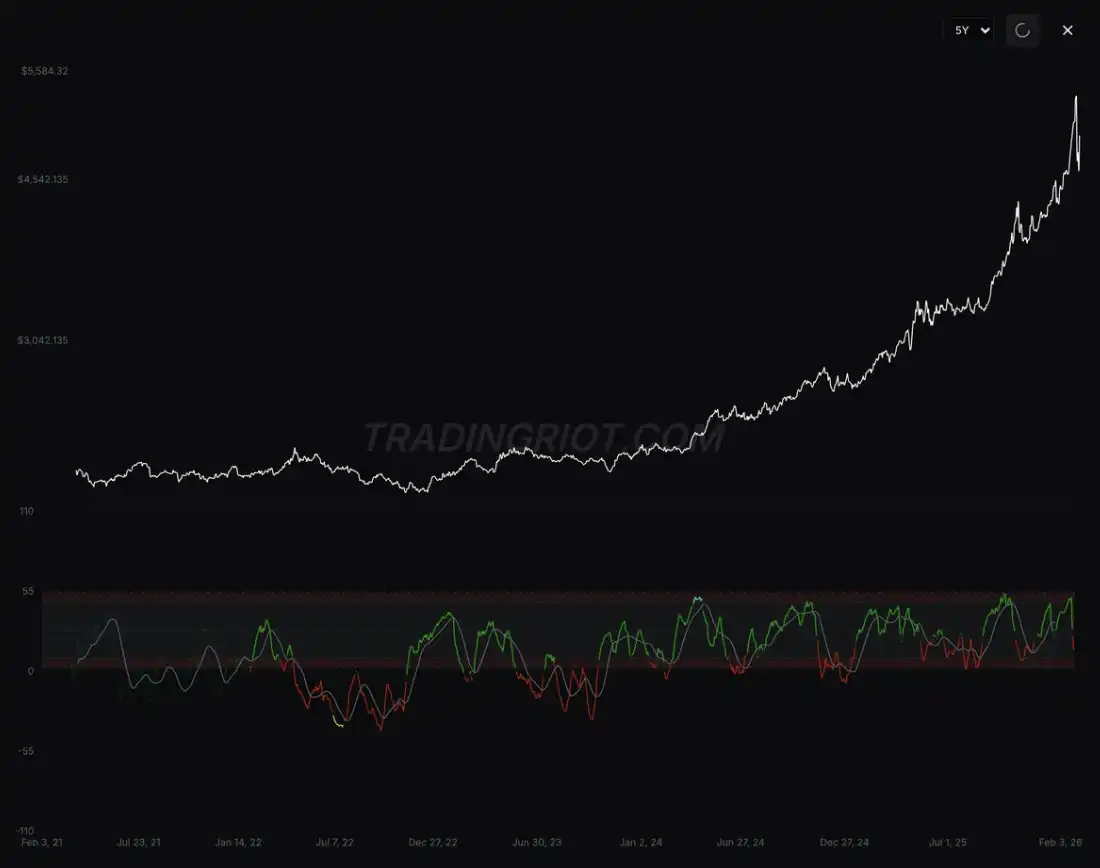
I have personally developed an indicator that integrates these signals into a composite regime for tracking (just to clarify, this indicator is not currently open to the public, I apologize). From the chart, you can see that the areas marked in red typically correspond to phases of extremely low market sentiment: continuous decline in open interest, negative funding rates, traders paying excessive premiums for put options, and realized volatility exceeding implied volatility.
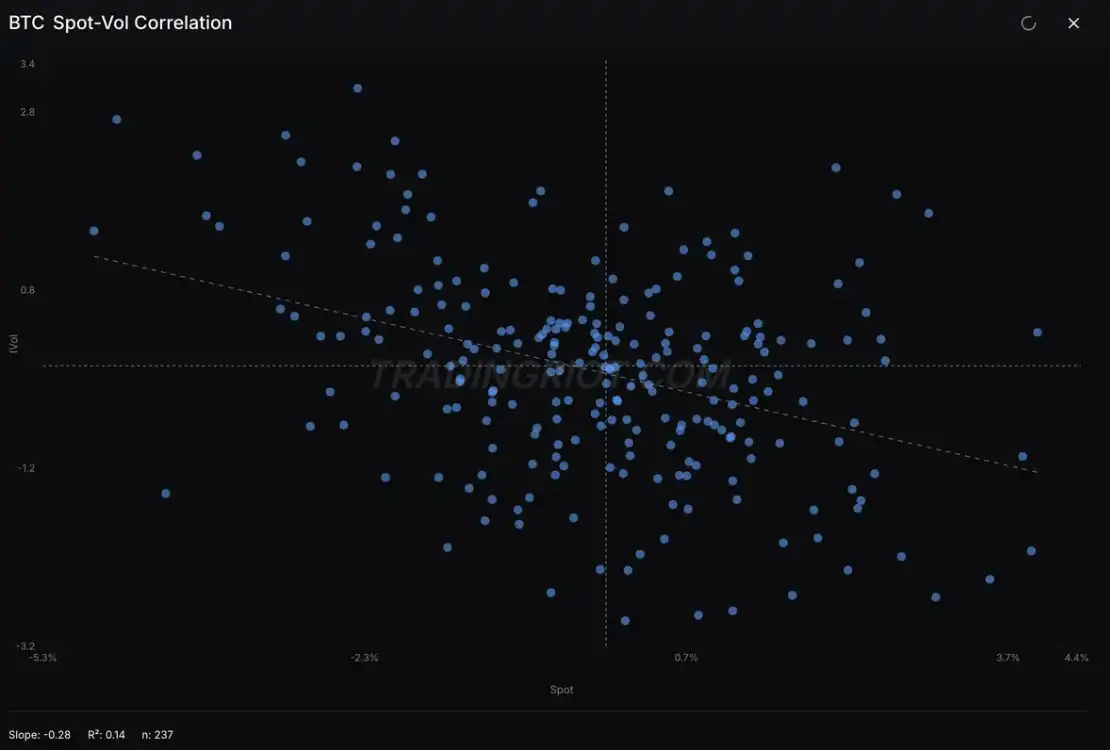
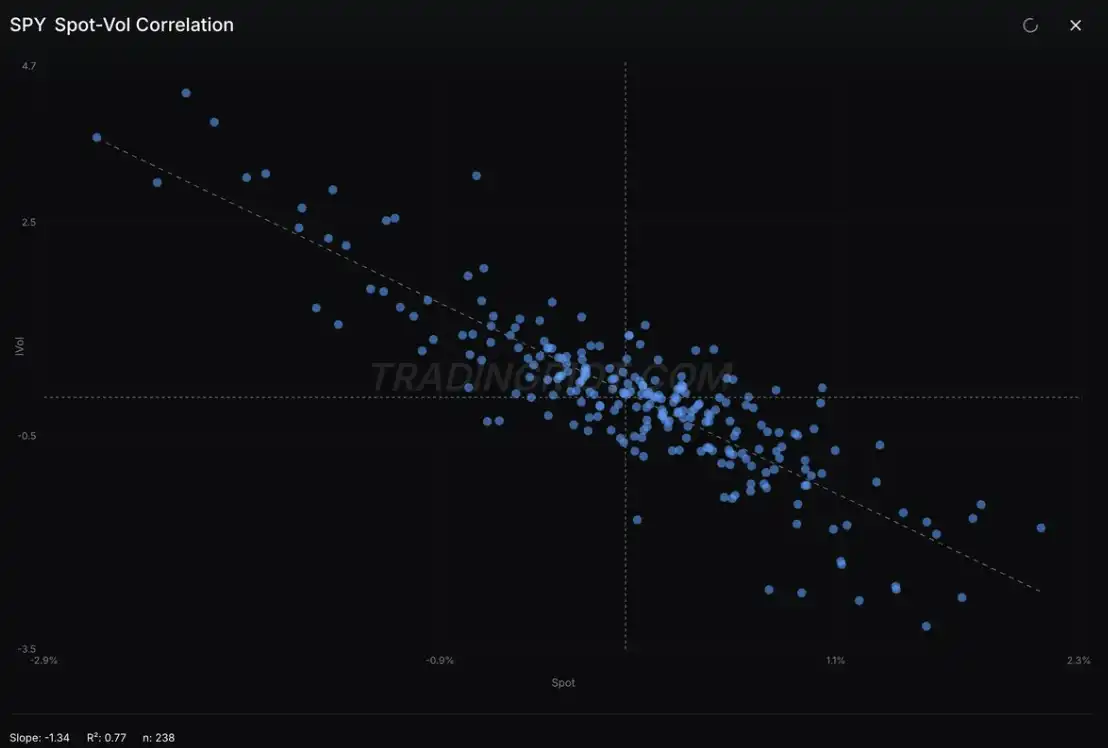
Meanwhile, the spot-volatility correlation in Bitcoin, although still appearing a bit chaotic overall, is increasingly exhibiting characteristics similar to those of stock indices.
Conclusion
If you were looking for "entry point, stop-loss, take-profit," I'm afraid I have to say I'm sorry to disappoint you (though I'm not really that sorry).
The purpose of this analysis is more to clarify a seemingly obvious yet often ignored fact: Bitcoin is an independently operating market. At certain stages, it may appear like gold, and at other times like stocks, but fundamentally, there is no necessary reason for them to synchronously fluctuate over the long term.
If you are currently watching prices continuously decline, trying to judge when a bottom may appear, then rather than applying analogies from other assets, it would be better to focus on the real data that matters to this market. Look at position structures—they often tell the most truthful and brutal stories.
At the same time, don't forget: most true bottoms form when almost everyone has already given up.
免责声明:本文章仅代表作者个人观点,不代表本平台的立场和观点。本文章仅供信息分享,不构成对任何人的任何投资建议。用户与作者之间的任何争议,与本平台无关。如网页中刊载的文章或图片涉及侵权,请提供相关的权利证明和身份证明发送邮件到support@aicoin.com,本平台相关工作人员将会进行核查。


