The Qinglan Crypto Class is now in session! BTC's four cycles + news dual perspectives, helping you step in time with the rhythm of the crypto circle.
1. Technical Analysis: Stalemate and probing under multi-cycle resonance
Short-term (15-minute chart): Weak consolidation, seeking direction
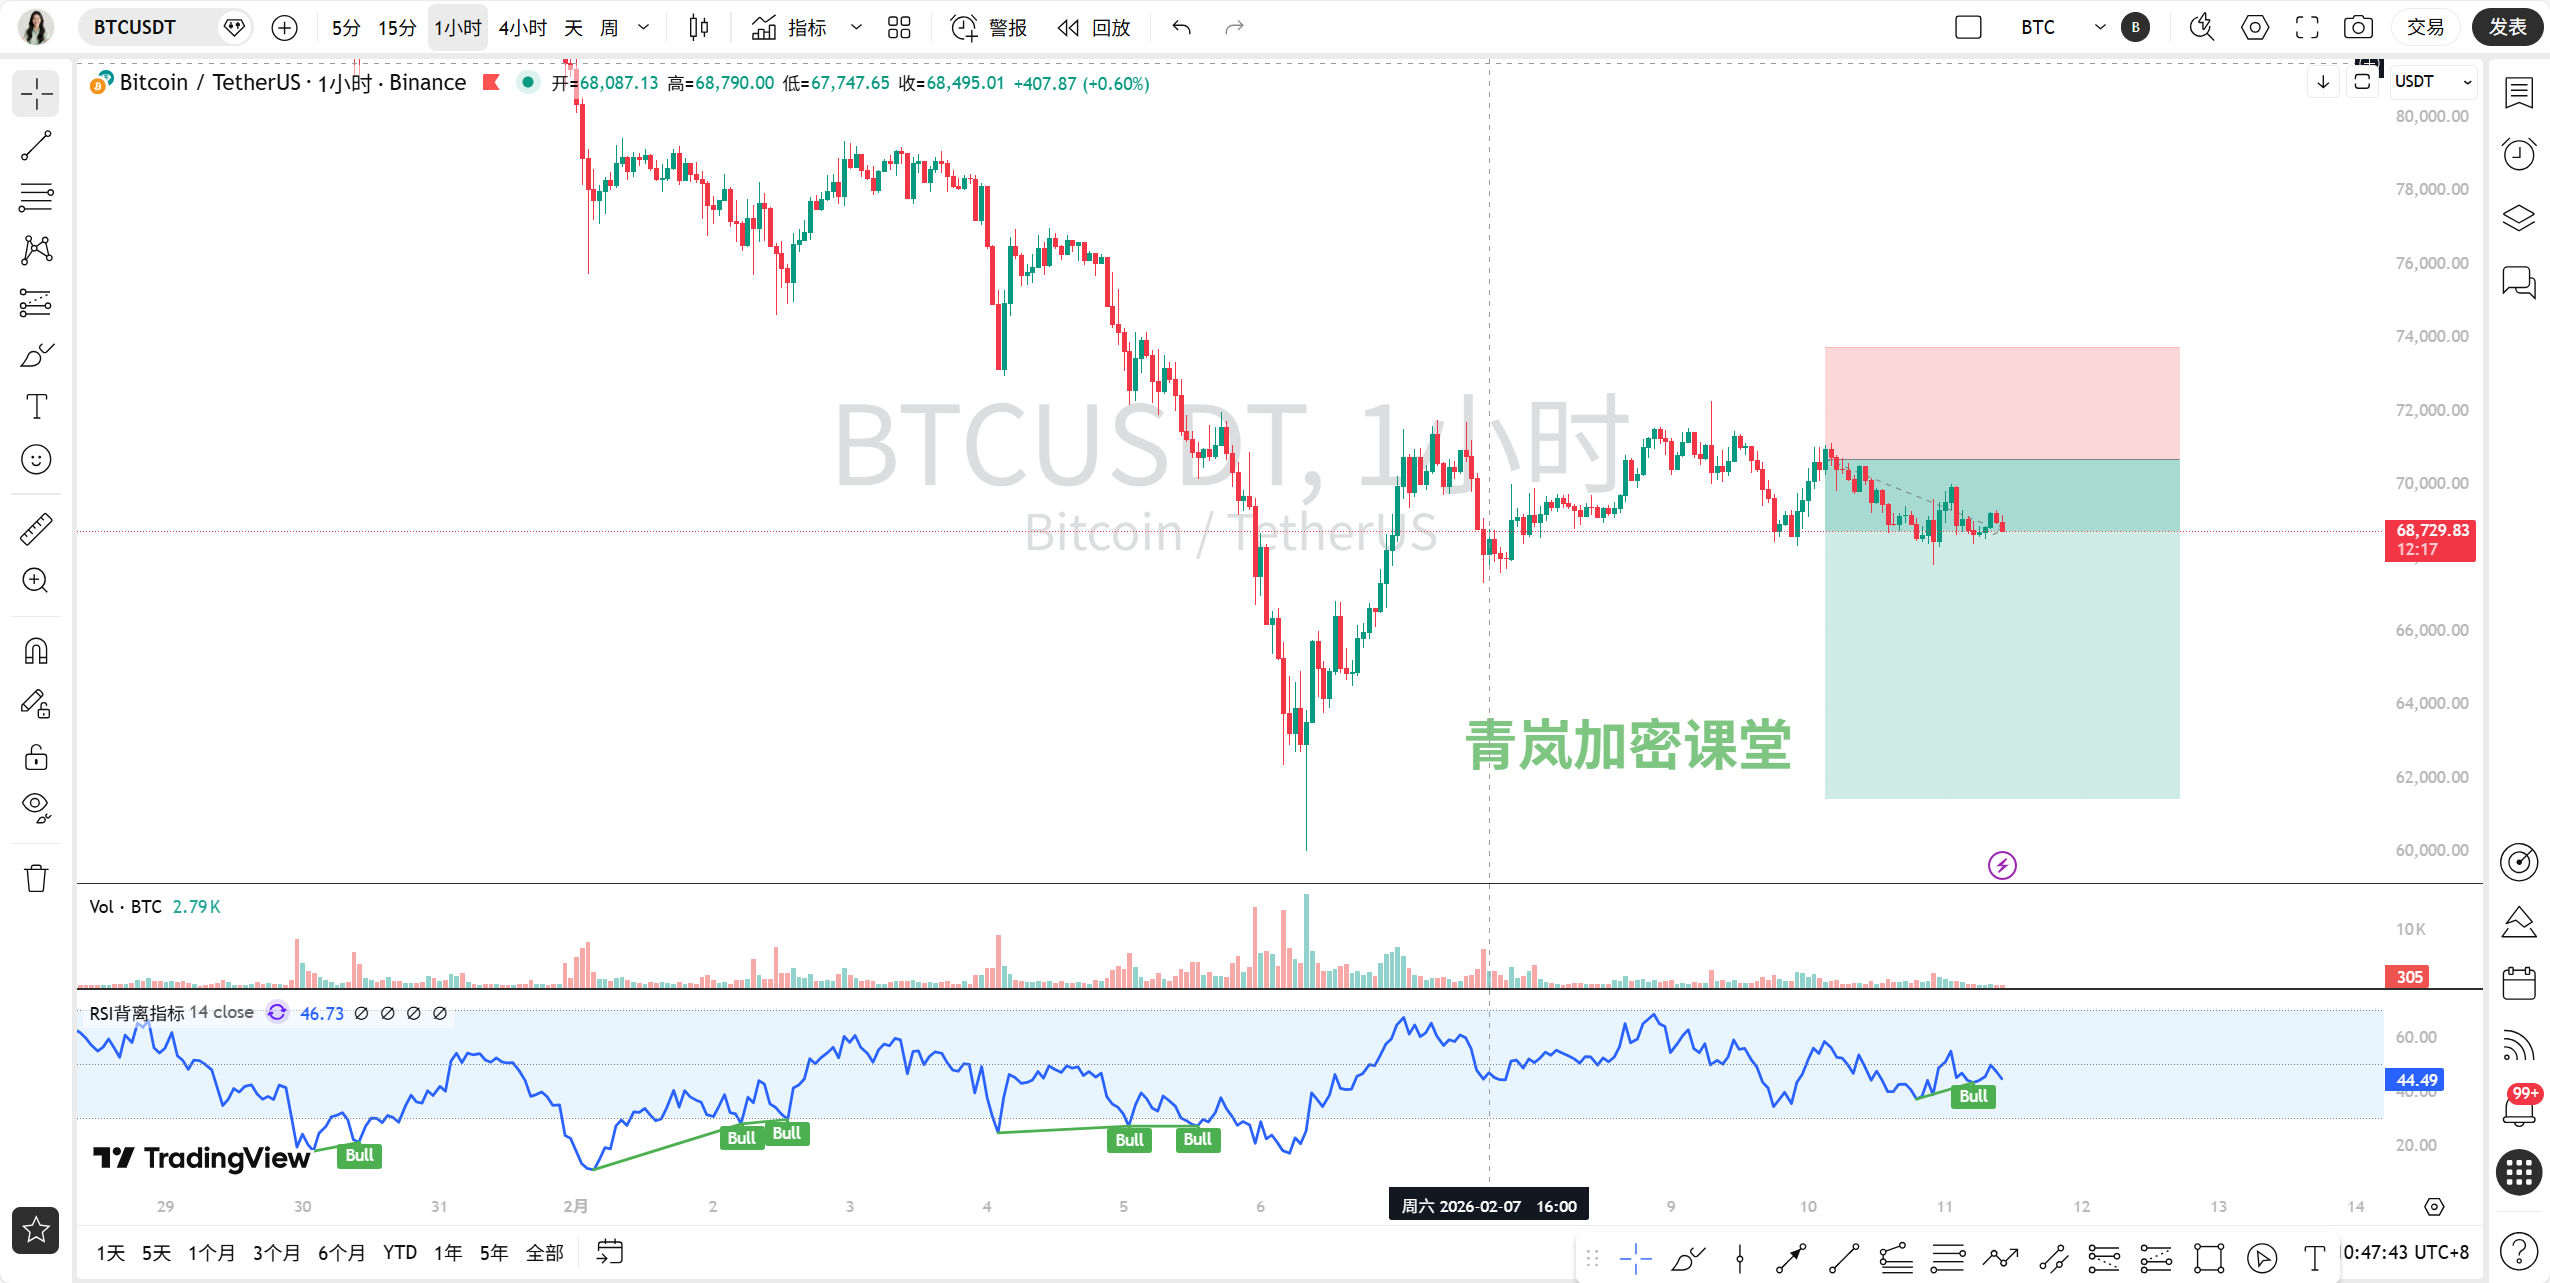
Price is oscillating repeatedly within the narrow range of 68,000-69,500, like a trapped beast. The moving average system (MA5, MA10, MA20) is highly intertwined, indicating a fragile balance has been temporarily reached between bulls and bears at this position. The MACD is fluctuating between crossovers and death crosses below the zero axis, while the RSI hovers in the neutral to weak zone of 40-55, failing to provide a clear direction. The key point is last night's volatility, where the price surged from 69k to nearly 70k and then instantaneously dropped back to 68k in a "rollercoaster," reflecting strong selling pressure above and strong buying support below, but bulls are temporarily unable to form an effective breakthrough. Short-term support is at 68,000-68,200, while resistance is at 69,500-69,800.Medium-term (1-hour chart & 4-hour chart): Weak rebound in a downtrend
The picture is clearer in these two time frames. On the 1-hour chart, the price is firmly suppressed by MA20 (purple line), currently around 69,300, where it turns back down with every rebound. Although the MACD shows signs of a crossover below the zero axis, it is very weak, with the momentum bars (BAR) nearly flattening out, indicating a state of "unable to fall but also unable to rise." The 4-hour chart is more typical, with a standard bearish arrangement of moving averages (MA5 < MA10 < MA20), and the price is operating below all major moving averages, indicating a clear downtrend. The MACD is showing signs of flattening in deep waters (far below the zero axis), suggesting that the downward momentum may be weakening, but there is absolutely no reversal. Key medium-term resistance is at 4-hour MA20, around the 69,800-70,000 area, a dividing line between bulls and bears. Strong support below is near the previous low of 66,000.Long-term (daily chart): Bear market pattern established, in a bottom-seeking phase
The daily chart appears somewhat "bleak." After reaching a peak in mid-January, the price has slid down, breaking below all important medium and short-term moving averages. The MACD has formed a death cross below the zero axis and continues to diverge, with long green bars (negative values), which are typical technical characteristics of a bear market. The RSI struggles around 30, not yet entering the oversold zone, indicating that theoretically there is still downward space. From a structural perspective, we are currently in the lower half of a large downward channel, searching for a solid bottom. In the long term, 66,000 is a psychological and technical double threshold. If it is breached, it may test the 60,000-62,000 area.
2. News Analysis: A tale of two extremes, with extreme panic in sentiment.
Technical indicators are bearish, and news adds "insult to injury":
Macroeconomic bearishness: Two Federal Reserve officials have expressed "hawkish" signals, suggesting that interest rates may remain high for a long period, and that further rate hikes cannot be ruled out. This directly depresses all risk assets, including Bitcoin. The market currently anticipates a 78.4% probability that interest rates will remain unchanged in March.
Pressure on funding: A large whale has transferred 2,500 BTC (worth over $172 million) to Binance, usually seen as a potential preparation for selling. At the same time, despite a slight price rebound, the overall funding rate across the market remains negative, indicating that the contract market as a whole is still bearish.
Market sentiment: The crypto fear and greed index is only at 11, indicating "extreme fear." Cryptocurrencies in U.S. stocks are broadly declining, with institutional reports indicating that Bitcoin's safe-haven properties are weakening, behaving more like high-risk growth stocks.
Positive signals (weak): There are some sporadic good news, such as Goldman Sachs disclosing that it holds $2.36 billion in crypto assets, Hong Kong actively promoting Web3, and on-chain data showing that large holders might be quietly accumulating amid the panic. However, these positives are currently drowned out by macroeconomic bearishness and pessimistic sentiment, resembling a few small sparks in the dark, insufficient to ignite the market.
3. Overall prediction and trading strategy
By blending cycles, technical analysis, and news analysis, the conclusion is:
The market is currently in a short-term weak consolidation phase within a medium to long-term downtrend. Bears control the main trend, but short-term downward momentum is somewhat depleted; bulls are attempting to organize a rebound but face heavy technical resistance and macroeconomic bearish pressure.
Our prediction is: In the short term (the next 1-3 days), it is highly likely to continue fluctuating within the large range of 66,000 - 70,000 to seek a bottom. The chances of a direct V-shaped reversal and strong rally are very low. The more likely scenario is to use time to exchange for space, digesting the panic sell-off and trapped positions above through repeated oscillation.
Trading strategy (for reference):
For short-term traders: Sell high, buy low within the range. Near the resistance area of 69,500-70,000, focus on short positions, with stop-loss placed above 70,500. Near the support area of 68,000-67,500, attempt to build a small position for a bounce, but must enter and exit quickly, with stop-loss set below 66,800. The current price (around 68,900) is at the mid-range, not suitable for opening new positions, recommended to wait and see.
For medium to long-term investors: Do not rush to catch the bottom. The true bottom often requires multiple tests and confirmations. It is recommended to patiently wait for two signals: first, a clear bullish reversal pattern appears on the daily level (such as morning star, bullish engulfing, etc.), and second, the price can effectively stabilize and recover the 4-hour chart MA20 line (70,000 level). Before this, it is safer to keep watching or only use small positions for dollar-cost averaging.
Key risk control level: 66,000. If this level is broken with significant volume, it indicates a continuation of the decline, and the market may begin a new round of bottom testing, necessitating decisive stop-loss actions and a shift to a more conservative strategy.
More on the quantitative breakdown of real-time news impact on market sentiment has been updated in my Qinglan Crypto Class, www.qinglan.org
Finally, Sister Qinglan shares with everyone today’s insight: "Maintain a sliver of clarity in extreme panic, and a degree of caution amidst everyone's fervor. The market's money is endlessly available, but your capital can be completely lost. Trading is not about who is braver, but about who lives longer." Let us proceed steadily and wait for the market to provide clearer signals.
免责声明:本文章仅代表作者个人观点,不代表本平台的立场和观点。本文章仅供信息分享,不构成对任何人的任何投资建议。用户与作者之间的任何争议,与本平台无关。如网页中刊载的文章或图片涉及侵权,请提供相关的权利证明和身份证明发送邮件到support@aicoin.com,本平台相关工作人员将会进行核查。


