Analyst Chen Shu: 2.10 Bitcoin and Ethereum Daily Chart Consolidation Expected to Break Upward
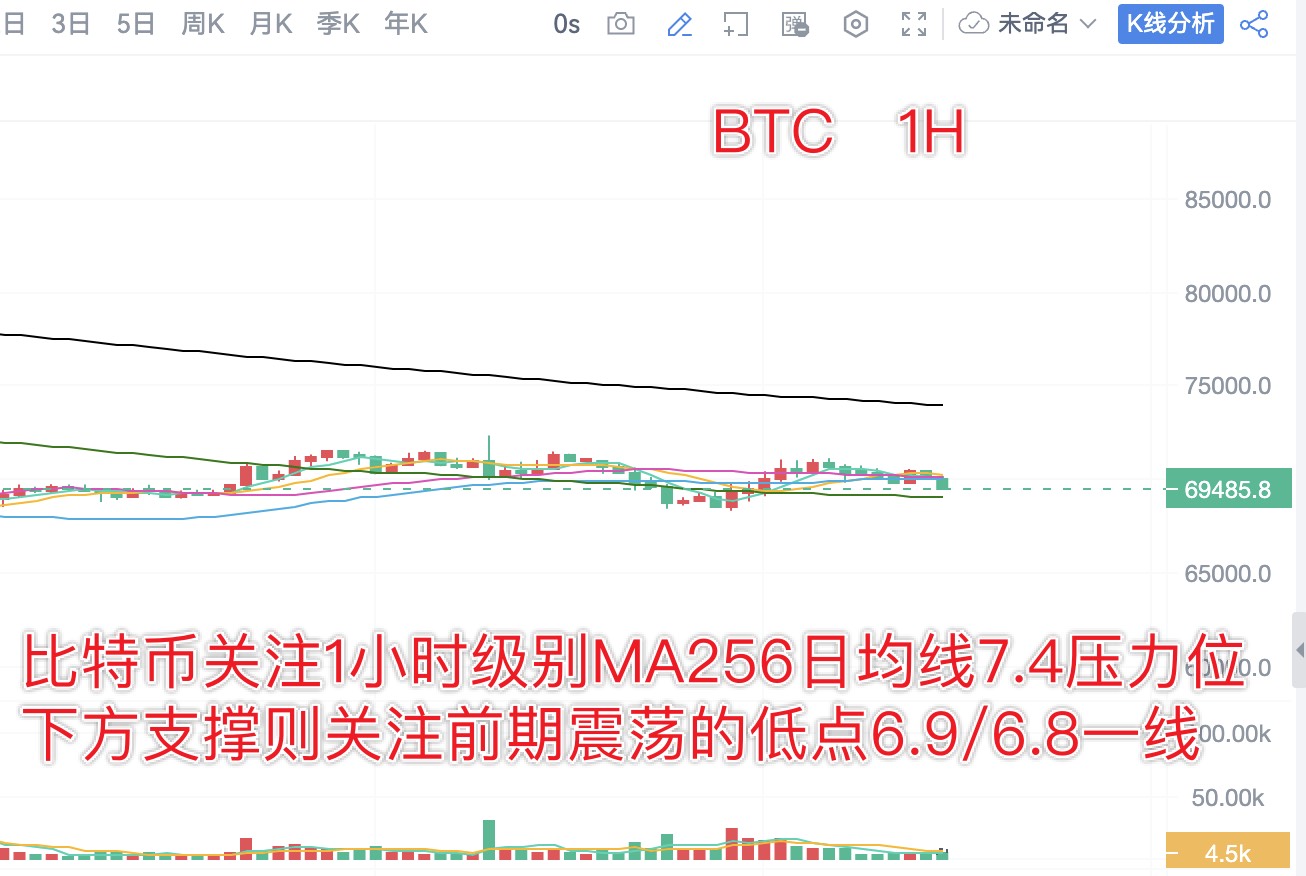
From the daily chart of Bitcoin, it has formed three consecutive small doji candlesticks over the past three trading days, with the price remaining below the MA10 moving average. In the short term, we should pay attention to the breakout direction after the consolidation. If it breaks above and stabilizes above the MA10 moving average, it is expected to continue the rebound momentum and move upward. On the 4-hour chart, the short-term price is currently adjusting with the MA30 moving average and is maintaining above this line. Meanwhile, on the 1-hour chart, the short-term support is focused on the MA120 moving average at the 6.9 level, while the resistance level is at the MA256 moving average at the 7.4 level.
From the daily chart of Ethereum, it has formed three consecutive small red candlesticks while remaining above 2000. Currently, we should pay attention to whether it can maintain the rebound momentum and continue to test upward. The resistance level is focused on the MA256 moving average at the 2220 level on the 1-hour chart, while the support level is at the short-term 2050 level. It is recommended to adopt a slightly bullish strategy in response to the consolidation.
Midday Trading Strategy (Written at: 11:30):
BTC: Buy at 6.9, add to long at 6.8, target 7.1/7.3; sell at 7.25/7.4 and look for a pullback to 2000 points.
ETH: Buy at 2050, add to long at 2000, target 2120/2160; sell at 2180/2250 and look for a 6-100 point pullback.
The daily analysis strategy has a very high win rate! Analysis is not easy, and I hope everyone can give a free follow, save, like, and comment. Thank you all, and feel free to leave comments below; I will reply to each one.

免责声明:本文章仅代表作者个人观点,不代表本平台的立场和观点。本文章仅供信息分享,不构成对任何人的任何投资建议。用户与作者之间的任何争议,与本平台无关。如网页中刊载的文章或图片涉及侵权,请提供相关的权利证明和身份证明发送邮件到support@aicoin.com,本平台相关工作人员将会进行核查。


