Original Title: Bitcoin rockets over 15% to get above $70,000 but options markets are now pricing in a scary new floor
Original Author: Gino Matos, CryptoSlate
Original Translation: Deep Tide TechFlow
Abstract: After a violent rebound from $60,000 to over $70,000 within 24 hours, Bitcoin seems to have regained lost ground, but the underlying logic shows that this is not due to strong spot buying, but rather forced rebalancing and short squeezes triggered by a macro market recovery. This article delves into the causes of this "frightening turmoil" in early February 2026: from the liquidity contraction expectations following Trump's appointment of Kevin Warsh, to the pressure of miners' profits hitting historical lows. Despite the price returning above $70,000, options traders are betting heavily on a potential second dip to $50,000-$60,000 by the end of February, revealing the market's fragile sentiment and complex financial games beneath the "violent rebound" facade. The following is the main text:
Bitcoin soared from $60,000 to over $70,000 in less than 24 hours, erasing a previous brutal drop of 14% that tested all "bottom-fishing theories" in the market.
The speed of this reversal—an intraday rebound of 12%, recovering 17% from the day's low—was intense enough to feel like the dust settling after a liquidation. However, the mechanism behind the rebound tells a different story: it is more a combination of cross-asset stability and forced position rebalancing, rather than large-scale spot demand driven by conviction.
Meanwhile, the derivatives market remains filled with bearish protective positions, with pricing indicating that $70,000 may only be a way station, not a true bottom.
Forced Liquidation Meets Macro Pressure
On February 5, the market opened around $73,100, briefly surged before collapsing, closing down at $62,600. According to CoinGlass data, the single-day drop led to about $1 billion in leveraged Bitcoin positions being liquidated.
This figure alone illustrates the chain reaction of forced selling, but the broader environment is actually worse.
CoinGlass data shows that Bitcoin futures open interest dropped from about $61 billion to $49 billion last week, indicating that the market had already begun deleveraging before the final wave of impact arrived.
The trigger was not the cryptocurrency itself. Media reports characterized this sell-off as a deterioration in risk sentiment, primarily driven by a sell-off in tech stocks and volatility in precious metals—silver once plummeted 18% to around $72.21, dragging down all related risk assets.
Research from Deribit confirmed this spillover effect, noting that derivatives sentiment turned extremely pessimistic: funding rates turned negative, implied volatility term structures inverted, and the 25-delta risk-reversal skew was pushed down to about -13%.
This is a typical "extreme fear" state, where position layouts amplify bidirectional price fluctuations.
Policy narratives added fuel to the fire. According to Reuters, the market reacted strongly to President-elect Donald Trump's choice of Kevin Warsh as Federal Reserve Chairman, interpreting it as a signal for future balance sheet contraction and tightening liquidity.
At the same time, miners are facing immense profit pressure. According to TheMinerMag, hash prices fell below $32 per PH/s, and network difficulty is expected to decrease by about 13.37% within two days. However, this relief mechanism has yet to take effect before prices break below support levels.
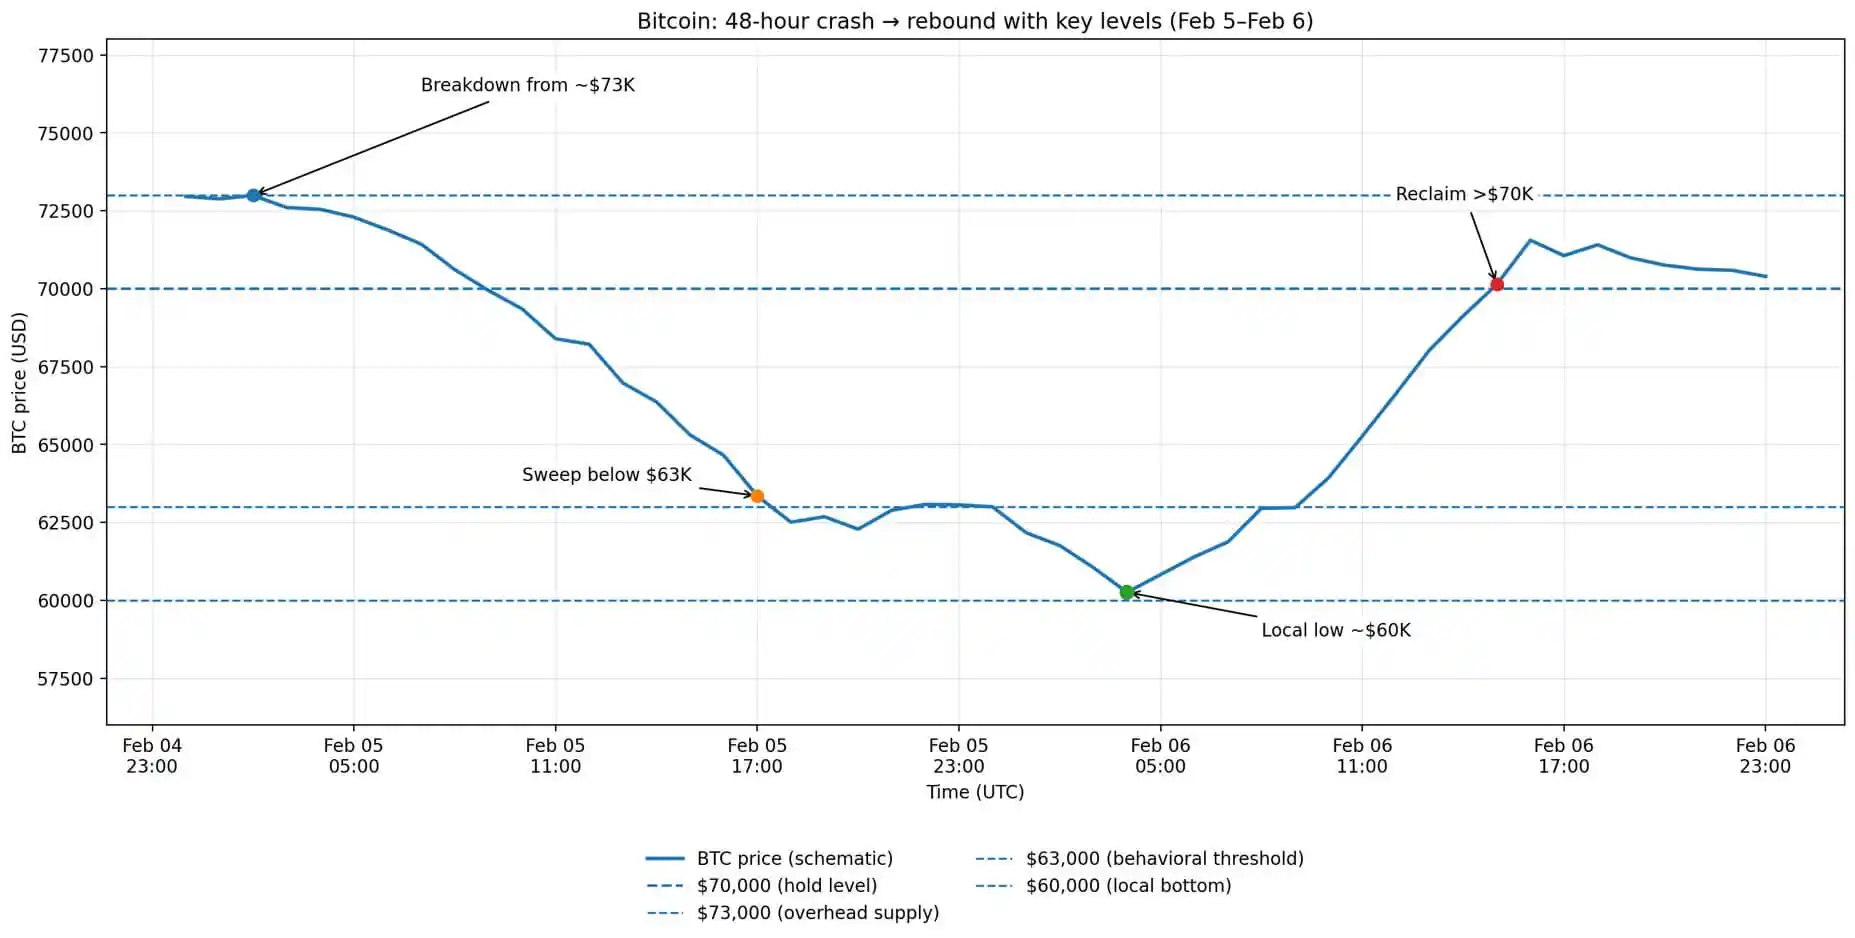
Bitcoin's price movement over 48 hours shows the collapse from $73,000, the sweep below $63,000, the local bottom around $60,000, and the subsequent rebound above $70,000.
Macro Reversal and Squeeze Mechanism
On February 6, the market opened at the previous day's closing price, then fell to an intraday low near $60,000, before surging to a high of $71,422. After three unsuccessful attempts to break through this level, the price retreated below $70,000.
The catalyst did not originate from within the crypto industry, but rather from a sharp turn in cross-asset trends. Wall Street performed strongly: the S&P 500 rose 1.97%, the Nasdaq rose 2.18%, the Dow Jones rose 2.47%, and the Philadelphia Semiconductor Index (SOX) surged 5.7%.
Metal prices rebounded sharply, with gold rising 3.9% and silver rising 8.6%, while the dollar index fell 0.2%, signaling a loosening financial environment.
Bitcoin mechanically fluctuated with this change. The correlation is very clear: when tech stocks stabilize and metals rebound, Bitcoin is lifted through common risk exposure.
However, the violence of this rebound also reflects the position situation in derivatives. The near -13% skew, negative funding rates, and inverted volatility structure created conditions where any macro positive could trigger short-covering and forced rebalancing.
This rebound is essentially driven by liquidity events and amplified by the liquidation of crowded short positions.
Nevertheless, forward-looking signals still lean bearish. Data from Derive shows that in options expiring on February 27, a large number of put options are concentrated at strike prices of $60,000 to $50,000.
Sean Dawson from Derive told Reuters that the demand for downside protection is "extreme." This is not hindsight analysis; traders are clearly hedging against the risk of the next downturn even after the rebound.
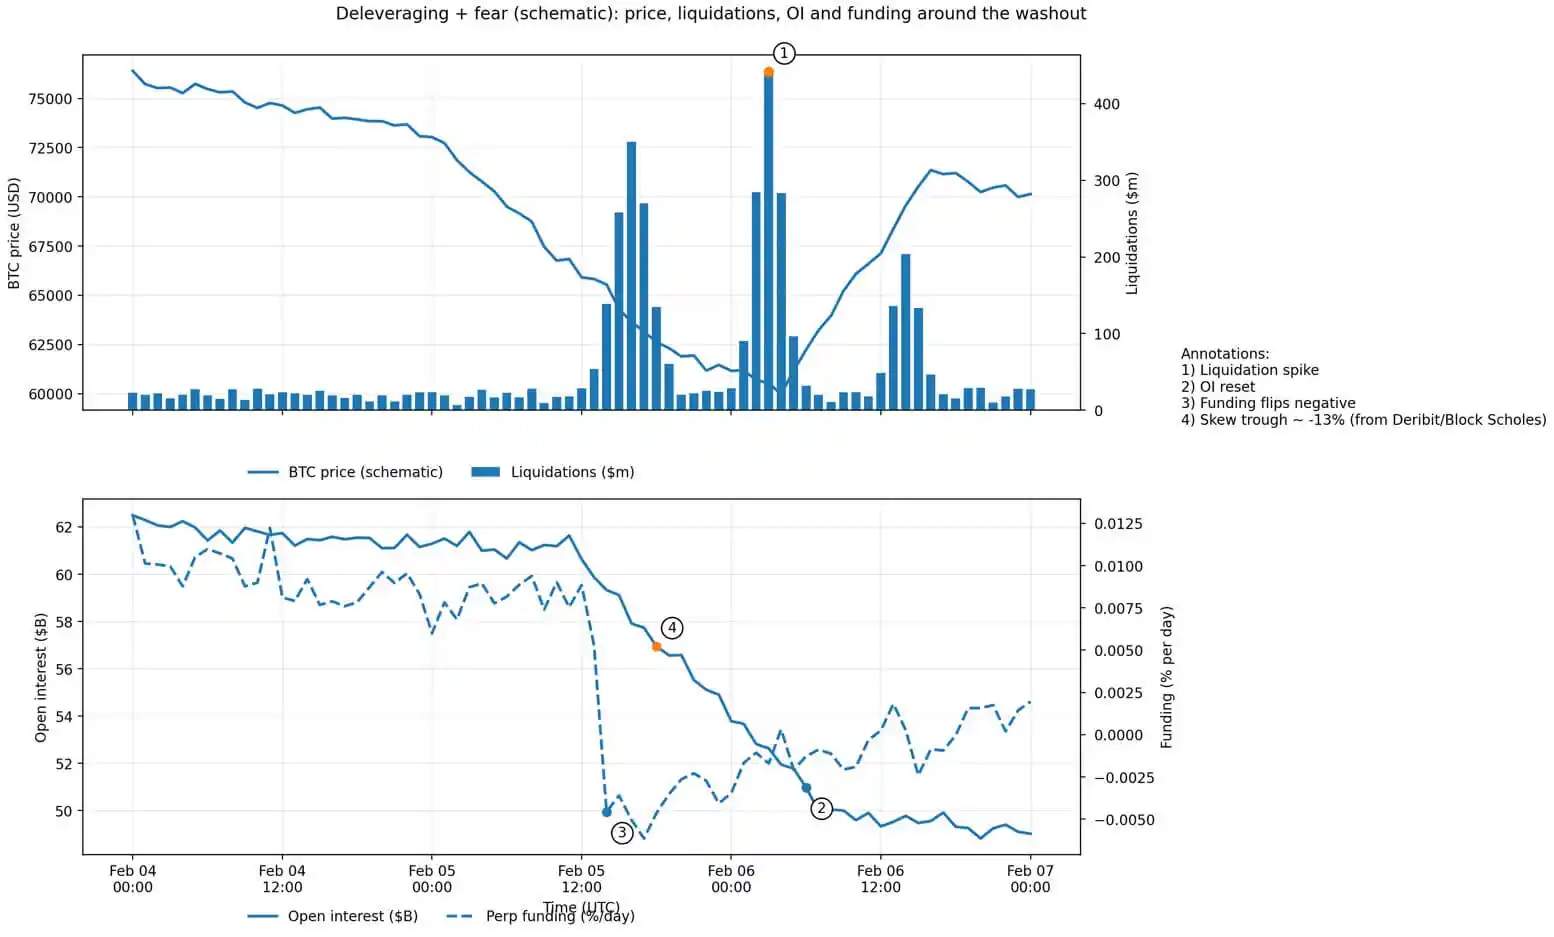
Bitcoin deleveraging chart, showing a surge in liquidations, open interest resetting from $62 billion to $49 billion, negative funding rates, and skew reaching -13%.
Can $70,000 Hold? Analytical Framework
The logic of holding $70,000 is based on three conditions.
First, the macro rebound needs to be sustained, with tech stocks continuing to stabilize, and U.S. Treasury yields and the dollar no longer tightening. This rebound is a clear cross-asset linkage; if U.S. stocks turn down again, Bitcoin will not be able to stand alone.
Second, leverage needs to continue cooling, and no new forced selling should occur. Open interest has already decreased significantly, reducing the risk of a "vacuum drop."
Third, when the difficulty adjustment takes effect, miners' pressure needs to be substantially alleviated. If prices can hold steady during the adjustment window, the expected 13.37% difficulty reduction will lessen marginal selling pressure, stabilizing the hash rate.
There are also three reasons supporting the view of another washout:
First, options positioning still leans bearish. The largest put options at the end of February are concentrated at $60,000-$50,000, which is a forward-looking signal embedded in the market's implied probabilities, rather than a lagging sentiment.
Second, derivatives signals remain weak. The extreme skew, recent frequent negative funding rates, and inverted volatility structure are more characteristic of a "relief rally" under a fear framework, rather than a trend reversal.
Third, ETF flow data shows continued outflows. As of February 5, the monthly net outflow from Bitcoin ETFs reached $690 million. Although data for February 6 has not yet been released, existing patterns indicate that institutional allocators have not yet shifted from "de-risking" to "re-engagement."
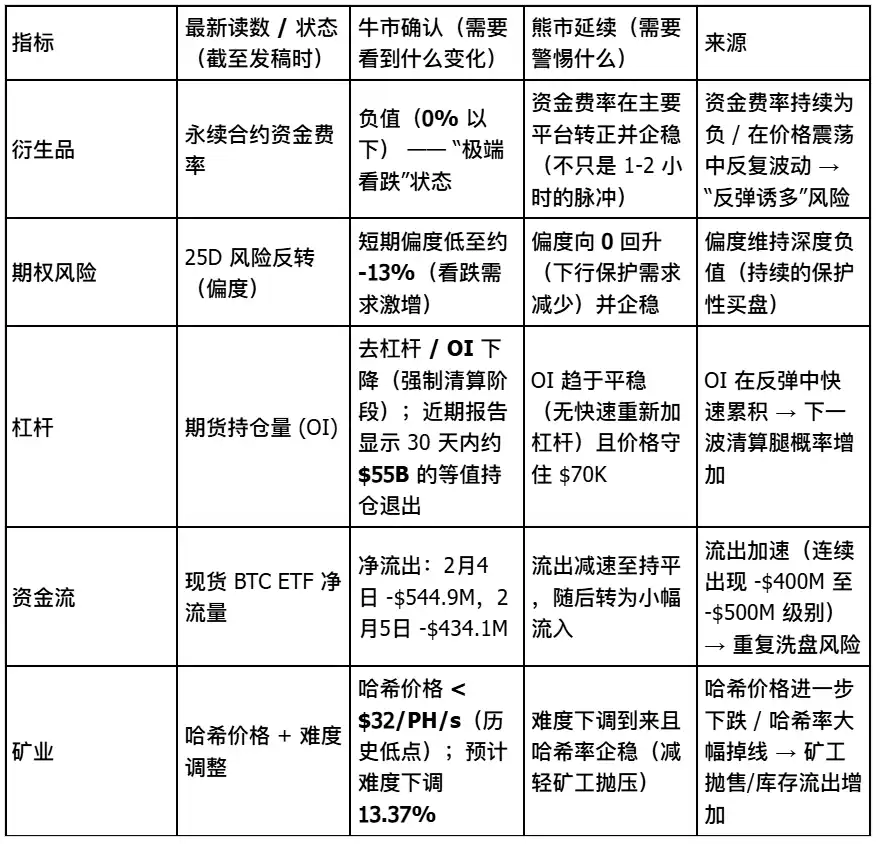
Signal Dashboard
The Real Significance of $70,000
This price level itself has no magic. Its importance lies in the fact that it is above the $66,900 to $70,600 on-chain absorption cluster identified by Glassnode.
Holding $70,000 means that this cluster has absorbed enough supply to temporarily stabilize prices. However, standing firm requires not only technical support but also a return of spot demand, the unwinding of derivatives hedging positions, and stabilization of institutional flows.
The rebound from $60,000 is real, but its composition is crucial. If macro conditions change, cross-asset stability will also reverse.
The forced liquidation of positions created a mechanical rebound, which does not necessarily translate into a sustained trend. Options traders still reflect a significant likelihood of a drop to $50,000-$60,000 within the next three weeks in their pricing.
Bitcoin has reclaimed $70,000, but is currently consolidating below this level. This suggests a pause before the next test, and the success or failure of the next test depends on the sequential occurrence of three conditions: sustained macro risk appetite, slowing or reversing ETF outflows, and a return to normal derivatives sentiment.
The market has provided a violent pullback, but forward curves and flow data indicate that traders have not yet begun to bet on its persistence. $70,000 is not the endgame; it is merely a baseline that determines the outcome of the next phase of the debate.
免责声明:本文章仅代表作者个人观点,不代表本平台的立场和观点。本文章仅供信息分享,不构成对任何人的任何投资建议。用户与作者之间的任何争议,与本平台无关。如网页中刊载的文章或图片涉及侵权,请提供相关的权利证明和身份证明发送邮件到support@aicoin.com,本平台相关工作人员将会进行核查。


