After the weekly report last week ended, Bitcoin briefly dropped to around $60,000. Many friends sent me private messages expressing their concerns about the future trend of Bitcoin. For investors who had positioned themselves around $80,000 or earlier, the pressure from the paper loss is evident, and I completely understand this sentiment—we have all experienced similar moments to varying degrees in different cycles. Anxiety, helplessness, and even the choice to give up.
However, it is precisely at this stage that emotions can more easily become a source of risk than direction. Instead of being led by short-term fluctuations, it is better to stabilize your mindset and reassess your positions and pace. Because moving forward, the market does not rule out the possibility of a temporary rebound, and such fluctuations often provide investors with a window for proactive adjustments: by gradually reducing risk exposure or utilizing more flexible and rapid swing trading to gradually lower costs and relieve pressure, allowing for a more composed response to the upcoming uncertainties.
I hope my article can provide some new ideas when everyone feels confused and lost:

Core Summary of the Trading Weekly Report:
• Analysis of the internal structure of the C wave decline triggered by Bitcoin on January 14. (Detailed explanation in Figure 1)
• Strategy execution (short-term) effectiveness verification: Last week's trading followed the established short-term strategy, completing a second short-term operation (1x leverage), successfully achieving a cumulative profit of approximately 10.72%.
• Strategy execution (mid-term) effectiveness verification: Last week, following the established mid-term strategy, continued to hold a short position established at $89,000 (1x leverage), with a profit of approximately 20.97% by the end of last week, with a maximum profit of approximately 32.58% during the period.
• Core viewpoint (short-term) verification: Last week, under the pattern of weekly and daily bearish market resonance, the price of the coin continuously broke through multiple support levels, ultimately finding support near $60,000. The market trend aligns with our previous expectations for the C wave adjustment.
The following will provide a detailed review of market predictions, strategy execution, and specific trading processes.
I. Analysis of Bitcoin's Adjustment Structure and Future Trend Structure of the C Wave
Bitcoin Daily K-line Chart:
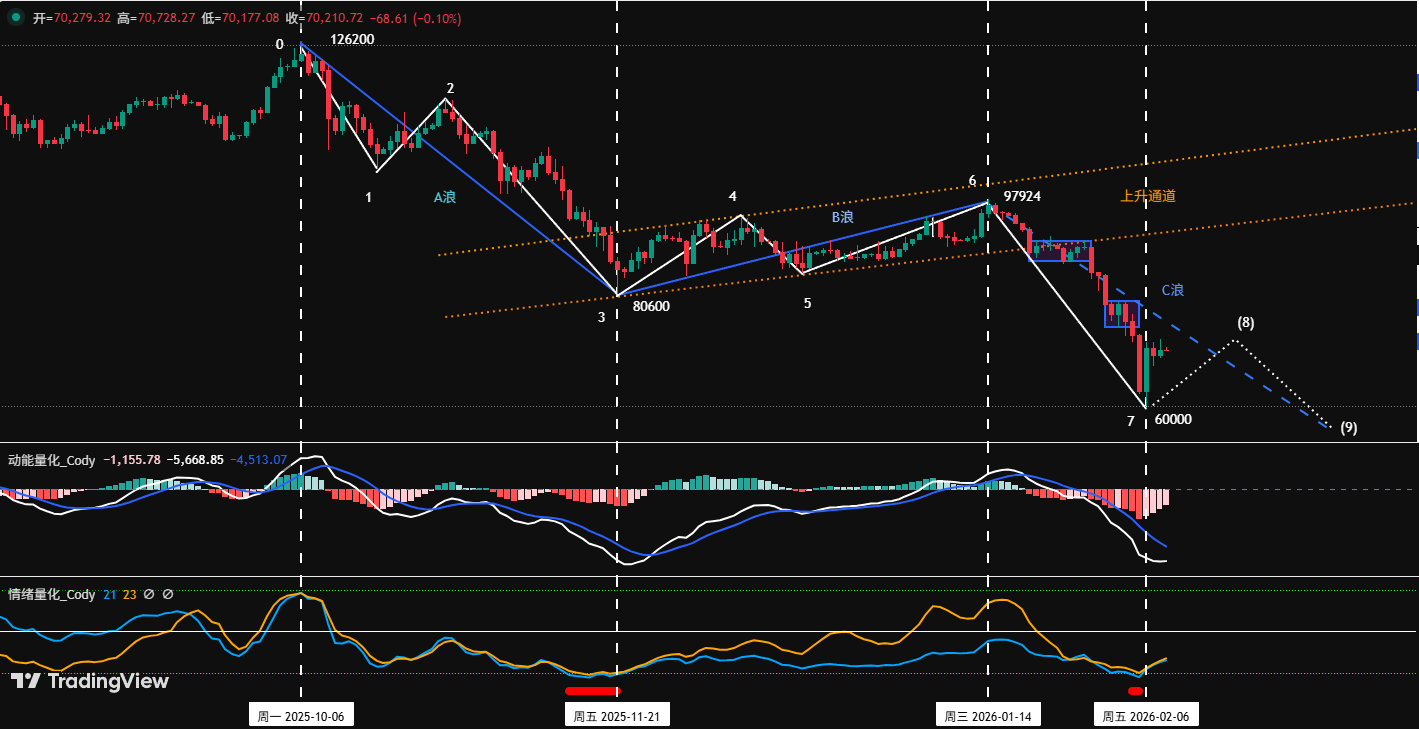
Figure 1
1. Main Structure Analysis:
Currently, the adjustment that began from the high point of $126,200 in October 2025 presents an A-B-C three-wave structure:
• A Wave (driving down wave): From $126,200 (October 6, 2025) to $80,600 (November 21, 2025), lasting 46 days, with a maximum decline of 36%.
• B Wave (rebound correction wave): From $80,600 (November 21, 2025) to $97,924 (January 14, 2026), lasting 54 days, with a maximum increase of 21.5%.
• C Wave (main decline wave): From $97,924 (January 14) to the present, lasting 25 days, with a maximum decline of 38.7%.
2. Sub-structure Analysis: Detailed Analysis of Driving Waves and Adjustment Waves
① A Wave can be divided into a 3-segment structure, namely segments 0-1, 1-2, and 2-3:
• Segment 0-1: From $126,200 (October 6, 2025) to $103,528 (October 17, 2025), lasting 11 days.
• Segment 1-2: From $103,528 (October 17, 2025) to $116,400 (October 27, 2025), lasting 10 days.
• Segment 2-3: From $116,400 (November 21, 2025) to $80,600 (November 21, 2025), lasting 25 days.
② B Wave can also be divided into a 3-segment structure, namely segments 3-4, 4-5, and 5-6:
• Segment 3-4: From $80,600 (November 21, 2025) to $94,589 (December 9, 2025), lasting 18 days.
• Segment 4-5: From $94,589 (December 9, 2025) to $84,450 (December 18, 2025), lasting 9 days.
• Segment 5-6: From $84,450 (December 18, 2025) to $97,924 (January 14, 2026), lasting 17 days.
③ C Wave internal trend structure projection, divided into the following three forms:
First trend structure projection (high probability): C Wave internally presents a 3-segment structure
• Segment 6-7 (first driving down): Target achieved: From $97,924 (January 14, 2026) to $60,000 (February 6, 2026), lasting 23 days, with a maximum decline of 38.7%. (Based on adjustment time and decline, $60,000 is likely the first adjustment low point of the C wave)
• Segment 7-8 (expected rebound): The dashed part in the figure, the rebound segment that is about to or has already started. The rebound height is unlikely to exceed $97,924 (the peak of B wave), with key resistance areas to watch at $72,000-$74,500 and higher at $80,000-$80,600.
• Segment 8-9 (final down segment): The dashed part in the figure, which will initiate the final decline, with theoretical target ranges projected by measuring the amplitude of A wave, the future $60,000 will be broken, and the price will test lower technical support levels.
Second trend structure projection (low probability): C Wave internally presents a 5-segment or more complex structure
This scenario is based on the completion of the first 3-segment structure, where the market has not yet shown clear bottom reversal signals, requiring further judgment based on the adjustment strength and trend structure type at that time. It implies that the adjustment time will be significantly extended, and may evolve into a "descending wedge" or "multiple three-wave" complex structure. This path is usually triggered by continuous macro deterioration or market liquidity exhaustion, and the probability of occurrence in the current environment is relatively low, but cannot be completely ruled out.
Third trend structure projection (very low probability): V-shaped reversal, adjustment has ended, reversal has begun
• Segment 6-7 (first driving down): Target achieved: From $97,450 (January 14, 2026) to $60,000 (February 6, 2026).
• Segment 7-8 (V-shaped reversal): The dashed part in the figure. The rebound is exceptionally strong, not only effectively breaking through the previous high of $97,924 but also maintaining stability above it, while significant positive news in the financial market accompanies it. If this situation occurs, it means that the entire A-B-C three-wave adjustment that started from $126,200 may have ended at $60,000 in a "simplified form." Although the probability is extremely low, the triggering condition (strong breakthrough of $97,924) is clearly identifiable and can serve as a key observation signal for trend reversal.
In summary, the above three trends are merely projections based on market behavioral logic and are not inevitable paths. Regardless of how the market evolves, one should always remember the principle: "The market is always right."
II. Review of Bitcoin's Trading Strategy and Key Levels Last Week (02.02~02.08)
- Short-term Trading Strategy Review: As shown in (Figure 2)
We strictly followed the trading signals generated by our self-constructed spread trading model and momentum quantification model, combined with our market trend predictions, to complete a second short-term operation, achieving a cumulative profit of 10.72%.
Specific trading details and review are as follows:
① Short-term Trading Results Display: (Leverage *1x)
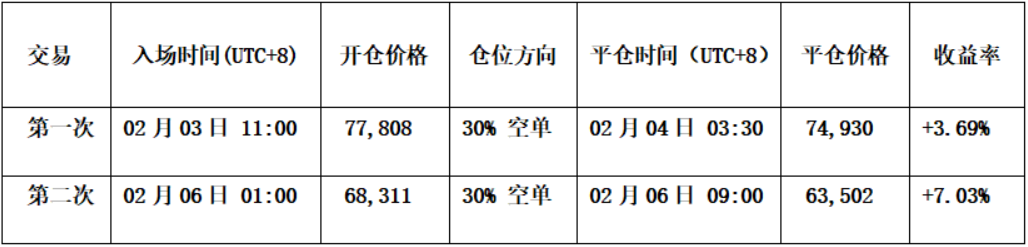
Figure 2
② Short-term Trading Review:
• First Trade (Profit 3.69%):
• Opening: After encountering resistance at the $80,000 pressure level combined with two model short signals, established a 30% short position at $77,808.
• Risk Control: Initial stop-loss for the short position at $81,000.
• Closing: Near the support level of $74,500, combined with the bottom signal of the spread model (red dot) and K-line combination bottom signal, fully closed at $74,930.
• Second Trade (Profit 7.03%):
• Opening: After encountering resistance at the $69,000 pressure level combined with two model short signals, established a 30% short position at $68,311.
• Risk Control: Initial stop-loss for the short position at $71,000.
• Closing: Near the support level of $63,000, combined with two model bottom resonance signals, fully closed at $63,502.
Bitcoin 30-Minute K-line Chart: (Momentum Quantification Model + Spread Trading Model)
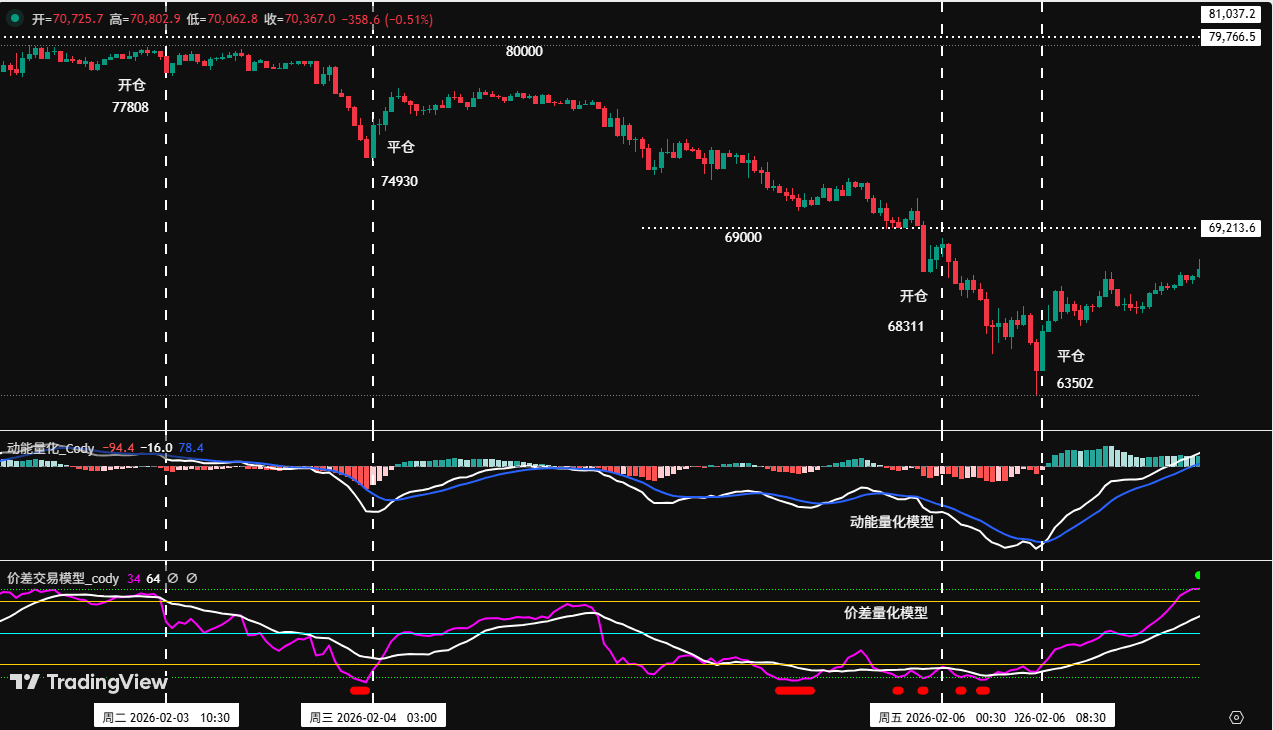
Figure 3
- Mid-term Trading Strategy Review:
Mid-term strategy: Continue to hold the 60% short position established near $89,000 as planned.
- Review of Key Levels Last Week:
Resistance levels are seen in the $80,000-$80,600 area;
The first support level is seen in the $72,000-$74,500 area, and the second support level is seen in the $69,000-$72,500 area.
III. Technical Indicator Analysis of Bitcoin's Trend This Week (02.09~02.15)
Combining market operations, I conducted an in-depth analysis of Bitcoin's trend structure based on the self-constructed trading system, from multiple models and dimensions.
- As shown in (Figure 4), from the weekly chart analysis:
Bitcoin Weekly K-line Chart: (Momentum Quantification Model + Emotion Quantification Model)
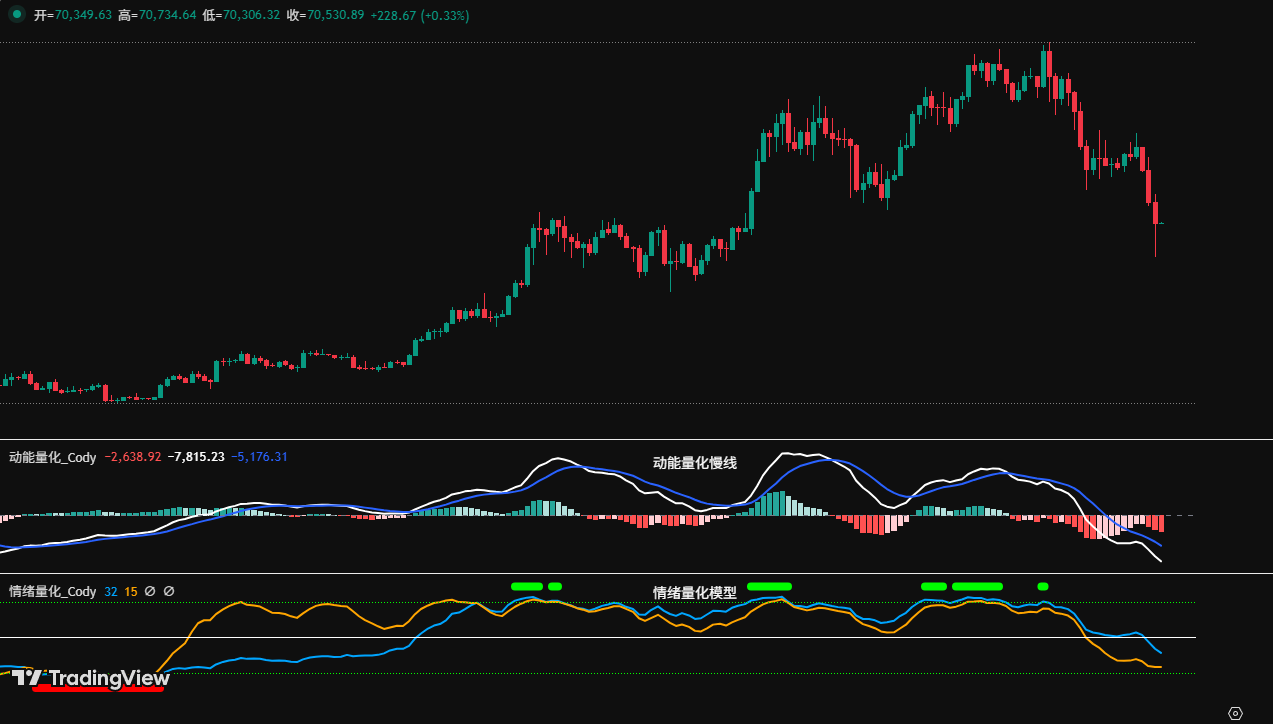
Figure 4
• Momentum Quantification Model: Technical indicators show that the short-selling momentum further released last week, with two momentum lines moving downward simultaneously, and the negative energy bars gradually expanding, indicating an accelerated adjustment state.
The momentum quantification model indicates: Price decline index: High
• Sentiment Quantification Model: The blue sentiment line value is 38, with an intensity of zero; the yellow sentiment line value is 11, with an intensity of zero, and the peak value is 0.
The sentiment quantification model indicates: Price bottom support index: Neutral
• Digital Monitoring Model: No digital signals (top or bottom) have appeared.
The digital monitoring model indicates: No bottom signal has appeared; the weekly K-line closed with a long lower shadow bearish candle, with a decline of approximately 8.63%.
The above data indicates: Bitcoin's weekly bearish trend, but short-selling momentum shows signs of short-term decline.
- As shown in (Figure 5), from the daily chart analysis:
Bitcoin Daily K-line Chart: (Momentum Quantification Model + Sentiment Quantification Model)
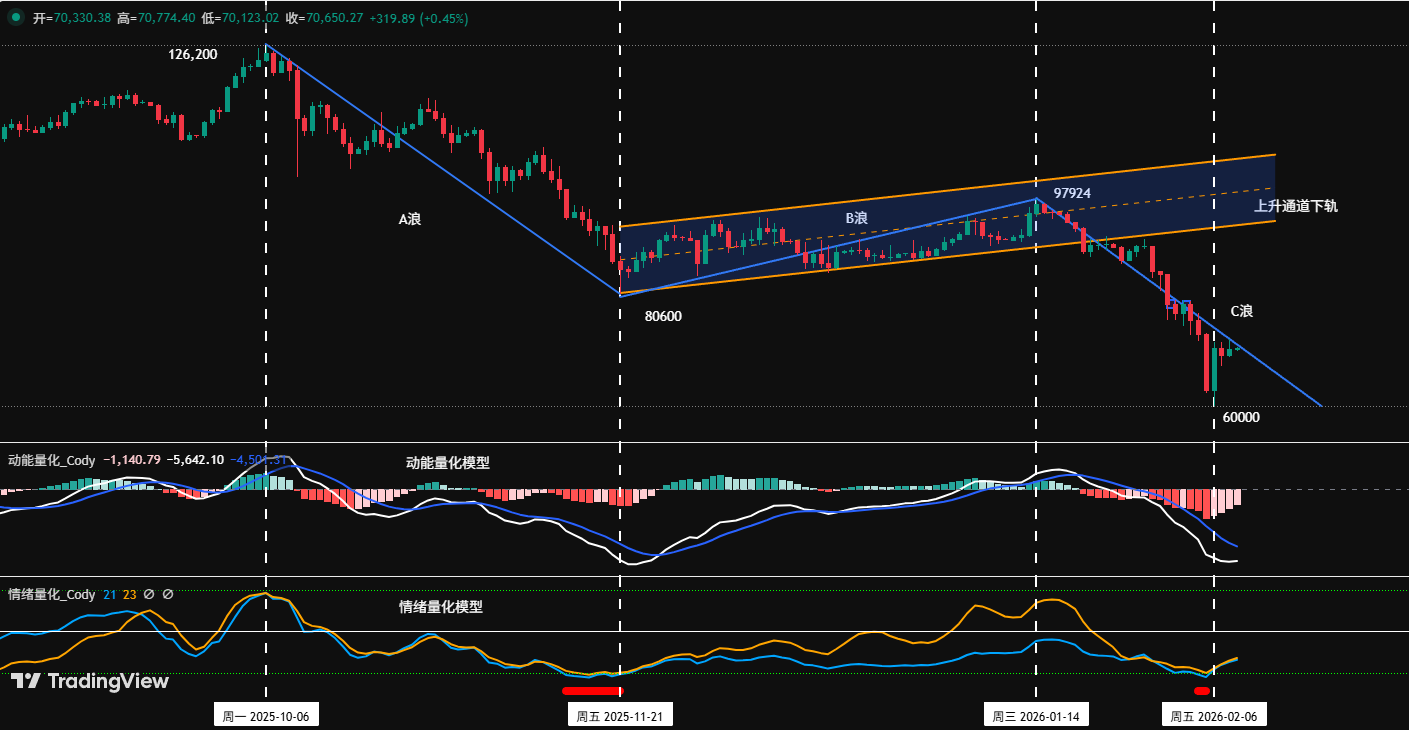
Figure 5
• Momentum Quantification Model: Last week presented an overall pattern of "accelerated decline - bottom rebound." After Sunday’s trading, the white momentum line's downward movement slowed, and the negative momentum bars gradually shrank for three consecutive days.
The momentum quantification model indicates: Daily level bearish trend, bulls are beginning to resist.
• Sentiment Quantification Model: After the market closed last Sunday, the sentiment model triggered a bottom warning signal (red dot), after which the two sentiment lines began to turn upward.
The sentiment quantification model indicates: Support strength is gradually increasing.
The above data suggests: The daily level is still a bearish trend, but a short-term bottom warning signal has been triggered, and a short-term rebound has begun.
IV. Market Forecast for This Week (02.09~02.15)
Core viewpoint for this week: Observe whether last week's low of $60,000 is broken, and pay attention to the strength of the oversold rebound starting from this point. (If the price breaks below $60,000, then the C wave subdivision 6-7 segment adjustment is still ongoing, and the rebound triggered at point 7 has not yet started.)
Core resistance levels:
• First resistance area: $72,000-$74,500 (near last April's low)
• Second resistance area: $80,000-$80,600 (near the starting point of B wave)
- Core support levels:
• First support level: $60,000-$62,500 (near recent adjustment low)
• Second support level: $57,400 (near the 210-week moving average)
• Important support level: $52,500 (near the symmetrical point of the 1x A wave decline)
V. Operating Strategy for This Week (Excluding Impact from Sudden News) (02.09~02.15)
Mid-term strategy: Maintain 60% short position. If the rebound effectively breaks $74,500, the position can be reduced to 40%.
Short-term strategy: Utilize 30% of the position, set stop-loss points, and look for "spread" opportunities based on support and resistance levels. (Using 30 minutes/60 minutes as the operating cycle).
In operations, to dynamically respond to market evolution and combine real-time model signals, we propose two short-term operation plans, A/B:
• Plan A: If the price rebounds to the $74,500-$75,200 area and encounters resistance:
• Opening: When the rebound reaches this area and triggers a resistance signal combined with the model's top signal, a 15% short position can be established.
• Risk Control: The initial stop-loss for the short position is set about 1.5% above the cost price (i.e., 1.015 * cost price).
• Closing: When it drops near important support levels and combines with model signals, positions can be gradually closed for profit.
• Plan B: If the price rebounds to the $80,000-$80,600 area and encounters resistance:
• Opening: When the rebound reaches this area and encounters resistance combined with the model's top signal, a 30% short position can be established.
• Risk Control: The initial stop-loss for the short position is set about 1.5% above the cost price (i.e., 1.015 * cost price).
• Closing: When it drops to support levels and combines with model signals, positions can be gradually closed for profit.
VI. Special Reminders:
When opening a position: Immediately set the initial stop-loss level.
When profit reaches 1%: Move the stop-loss to the opening cost price (break-even point) to ensure capital safety.
When profit reaches 2%: Move the stop-loss to the position of 1% profit.
Continuous tracking: After this, for every additional 1% profit, the stop-loss will be moved up by 1% to dynamically protect and lock in profits.
免责声明:本文章仅代表作者个人观点,不代表本平台的立场和观点。本文章仅供信息分享,不构成对任何人的任何投资建议。用户与作者之间的任何争议,与本平台无关。如网页中刊载的文章或图片涉及侵权,请提供相关的权利证明和身份证明发送邮件到support@aicoin.com,本平台相关工作人员将会进行核查。


