Qinglan Crypto Class is starting! BTC's four cycles + dual perspective on news, guiding you to step in sync with the crypto market rhythm.
Let's look at the technical and news aspects together:
First, the long-term cycle (daily & 4-hour): the trend is downward, and the bearish pattern remains unchanged. On the daily chart, the price has broken below all major moving averages (MA5, MA10, MA20), and the arrangement is a standard bearish setup. The MACD is below the zero line, with green bars (negative values) still extending, and the RSI is around 26; although oversold, there is no sign of a bottom divergence yet. The 4-hour chart is even more evident, with last night's large bearish candle directly breaking through $73,000, creating a 14-month low. Although there was a rebound, the overall structure still resembles a downward continuation. On the news front, Galaxy warns of a potential drop to $60,000, and MicroStrategy's stock price fractal also points to a deeper correction, confirming the weakness of the mid-term trend. Therefore, we clearly judge the mid to long-term trend as downward.
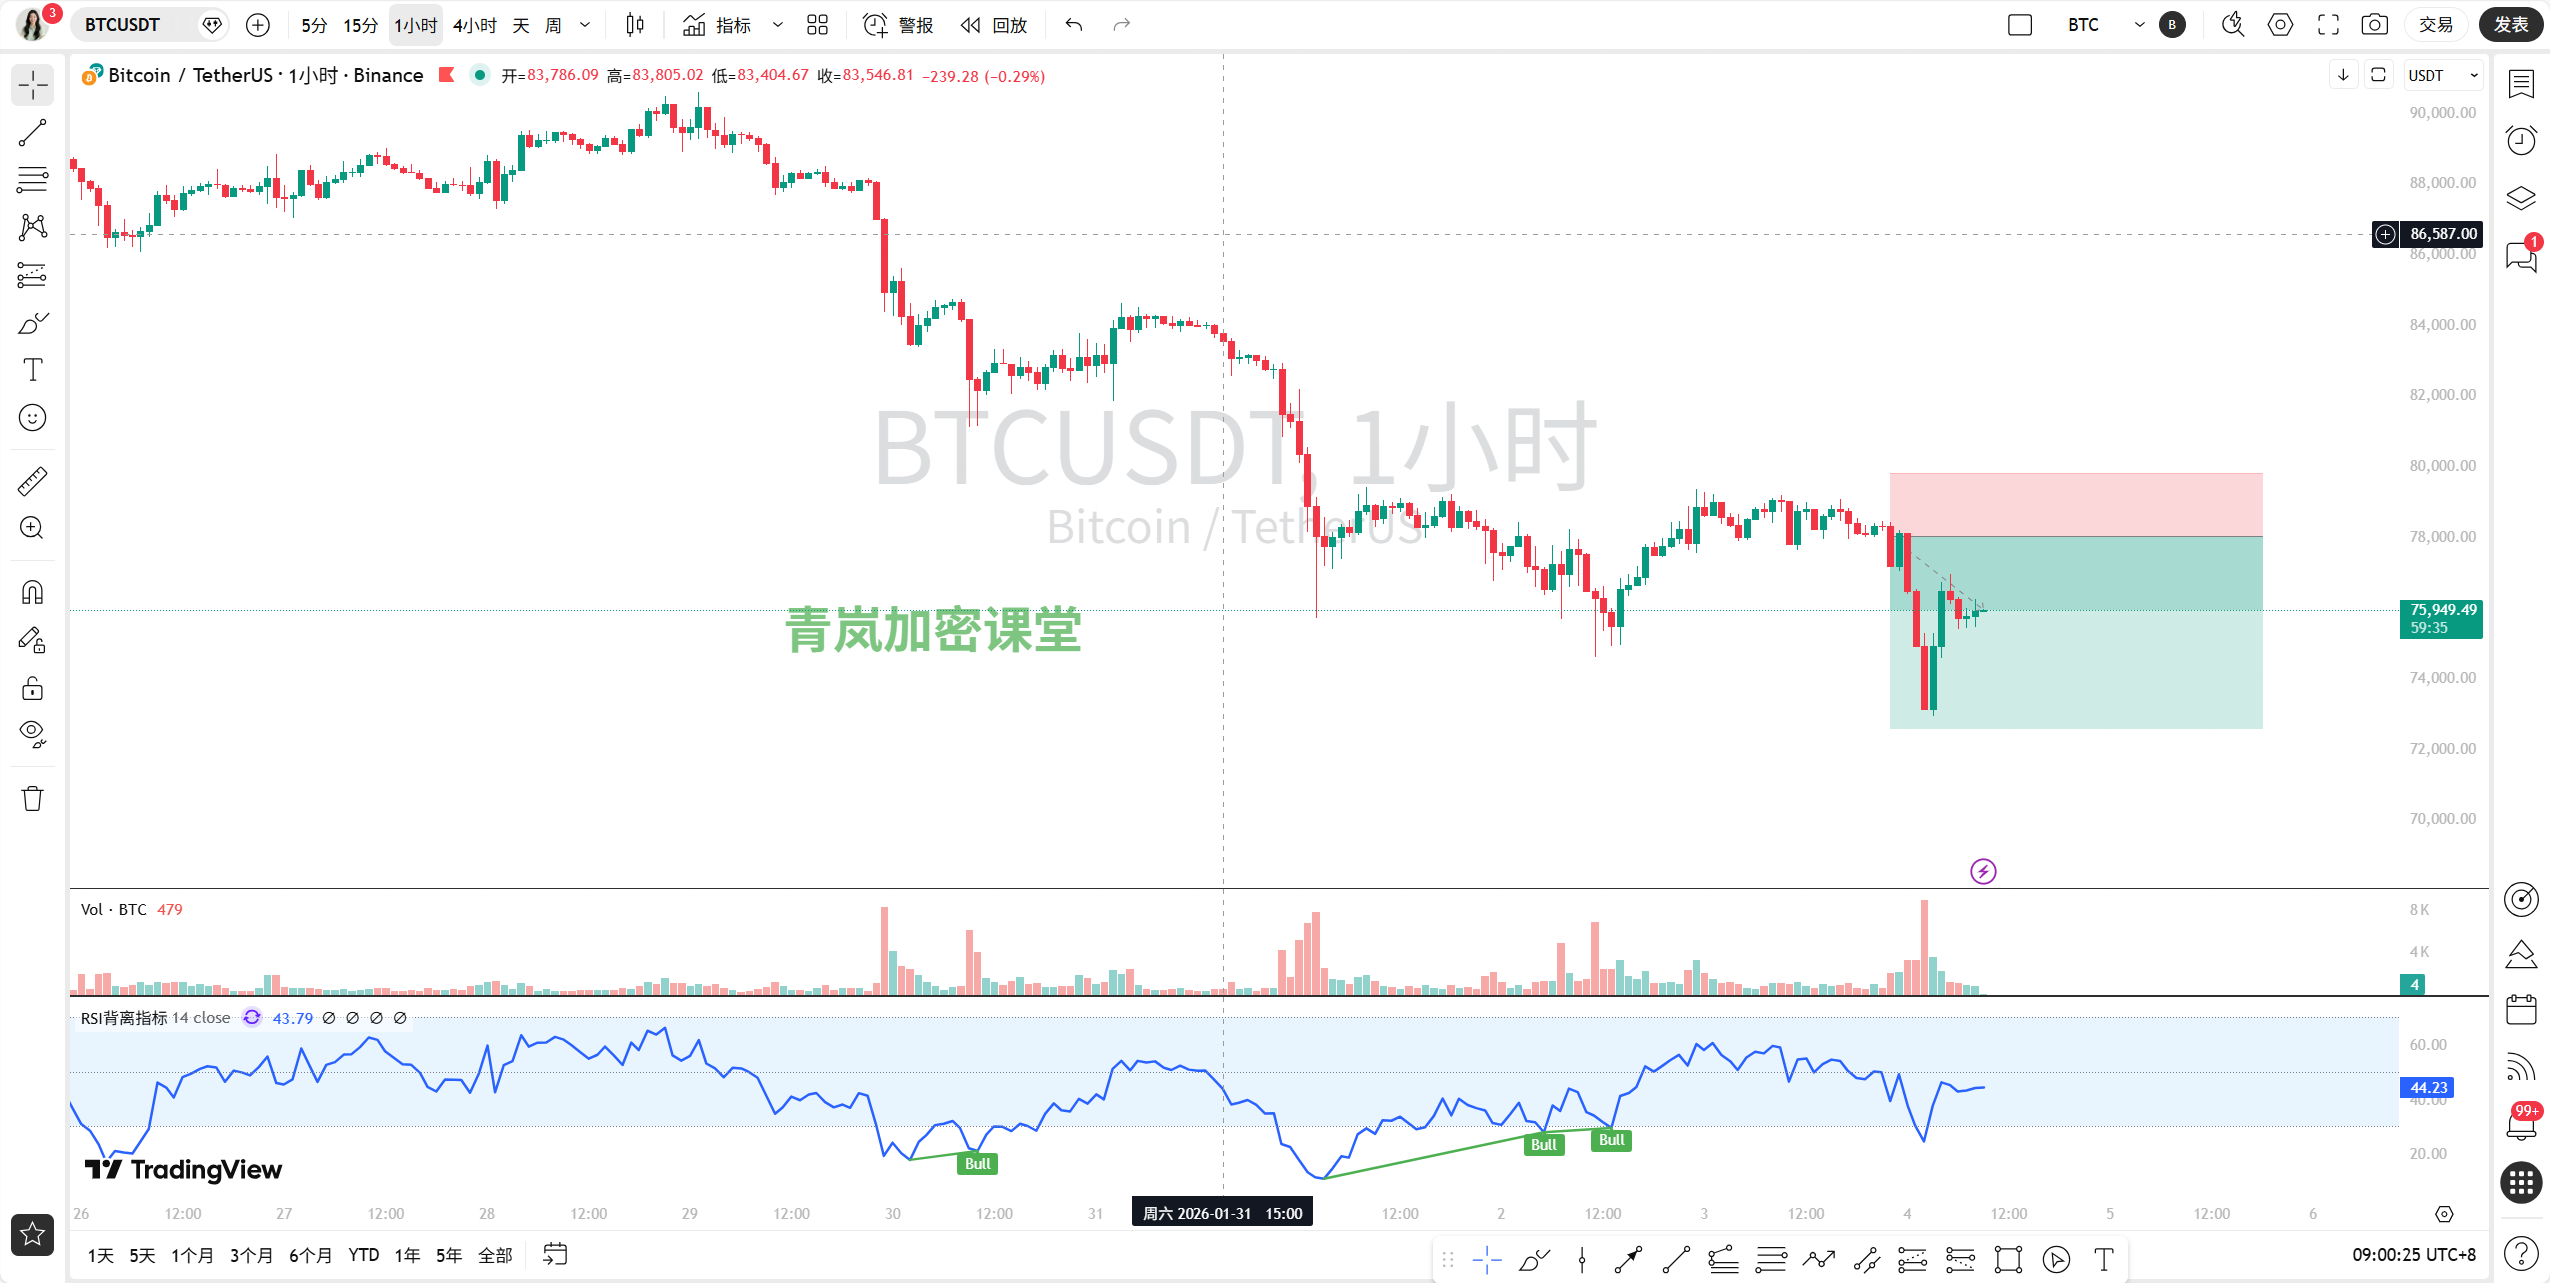
Next, looking at the medium-short cycle (1 hour & 15 minutes): a sharp rebound after a crash, but the strength is questionable. The 1-hour chart shows that after hitting a low around $72,945 in the early morning, the RSI fell below 20, indicating severe overselling, followed by a rebound to above $76,800. This rebound forms a "drop-rebound-retest" structure on the 1-hour level. The 15-minute chart provides more detail; during the rebound, the MACD formed a golden cross, but the price clearly faced resistance in the $76,000-$76,800 range, starting to consolidate sideways. The news is interesting; on one hand, there are optimistic voices saying "the crash is a gift" and "we've hit the bottom" (like Fundstrat's Tom Lee), while on the other hand, the overnight market liquidated $740 million, mainly from longs, indicating that this rebound is more about short covering and technical recovery after liquidations rather than new buying power entering the market. Therefore, we define the short-term trend as "a consolidation after an oversold rebound," with an unclear direction but leaning weak.
Key levels and reversal patterns:
Strong resistance: First, look at the $76,800-$77,200 area, which is the high point of the 1-hour rebound and also a previous small platform. Only a breakthrough here can we talk about a short-term strengthening. A larger resistance is at $78,400-$79,000, which is the starting point of the crash and also near the daily MA5, facing heavy pressure.
Key support: The recent support is the early morning low around $72,900-$73,000. If this breaks again, the downward space will open up, and the next target could be the $70,000 mentioned in the news or even $68,000. The short-term dividing line for strength and weakness is at $75,500; if it breaks below, the rebound may end.
Reversal pattern: Currently, there is no reliable bottom reversal pattern (like a double bottom or head and shoulders bottom). The 15-minute and 1-hour levels seem to be forming a "descending flag" or a consolidation center, which increases the probability of further declines.
Our prediction and trading thoughts: Overall, the market has experienced a panic sell-off and is now in a stage of "recovering from a major illness" but still very weak. The news is mixed, but panic sentiment (the selling virus) and macro liquidity tightening are dominant. The technical aspect shows a downward trend in the long cycle, while the short cycle rebound is weak.
Therefore, the prediction: the rebound is unlikely to last, and the market will likely choose to move downward again after consolidating in the $75,500-$76,800 range, testing or even breaking the $73,000 support.
Trading thoughts:
Short-term: Aggressive traders can try shorting near the resistance zone of $76,800-$77,200, combining with small cycles (like 15 minutes) to look for signs of stagnation (like long upper shadows, RSI divergence) when the price shows weakness. Set a stop loss above $78,000, targeting $75,500, and if broken, look for $74,000. Remember, this is just a short-term rebound play, quick in and out, do not linger.
Medium-term: Be patient. If the price rebounds to the stronger resistance zone of $78,400-$79,000, it will be a better opportunity to set up a medium-term short position. Alternatively, if it directly breaks below $75,500 and confirms, you can follow the trend to short, targeting below $73,000.
Bottom fishing: Don't rush! In a daily-level decline, bottom fishing must wait for a clear bottom structure (like a daily-level bottom divergence) and confirmation with a strong bullish candle. Reaching out to catch falling knives can easily lead to losses.
Remember, in such extreme market conditions, "surviving" is much more important than "how much to earn." Control your position, set good stop losses, and do not let the market's panic or frenzy lead you by the nose.
For more quantitative breakdowns of how real-time news affects market sentiment, it has been updated in my Qinglan Crypto Class, www.qinglan.org
Finally, I want to share today's insight: "The market never lacks stories of getting rich quickly, but the real winners are often those who can fasten their seatbelts in the storm." Let's encourage each other, stay calm, and trade rationally!
免责声明:本文章仅代表作者个人观点,不代表本平台的立场和观点。本文章仅供信息分享,不构成对任何人的任何投资建议。用户与作者之间的任何争议,与本平台无关。如网页中刊载的文章或图片涉及侵权,请提供相关的权利证明和身份证明发送邮件到support@aicoin.com,本平台相关工作人员将会进行核查。


