Written by: Alex Thorn, Head of Research at Galaxy Digital
Translated by: Glendon, Techub News
Between January 28 and January 31, Bitcoin experienced a significant drop of 15%, with the decline worsening over the weekend. On Saturday alone, Bitcoin plummeted by 10%, triggering one of the largest liquidation events in the history of futures trading platforms, with long positions liquidated amounting to over $2 billion. Additionally, on Saturday, Bitcoin's price on Coinbase briefly fell to $75,644, representing a decline of over 10% compared to the average cost basis of $84,000 for U.S. ETFs. Furthermore, Bitcoin's price also fell below the average cost basis of $76,037 for Strategy, nearly reaching a one-year low of $74,420 (a low set during the "Tariff Storm" in April 2025). Currently, 46% of the Bitcoin supply in the market is in a state of loss, meaning these Bitcoins were previously transferred on-chain at prices higher than the current price. By the close on Saturday evening, Bitcoin had recorded its first four-month consecutive decline since 2018.
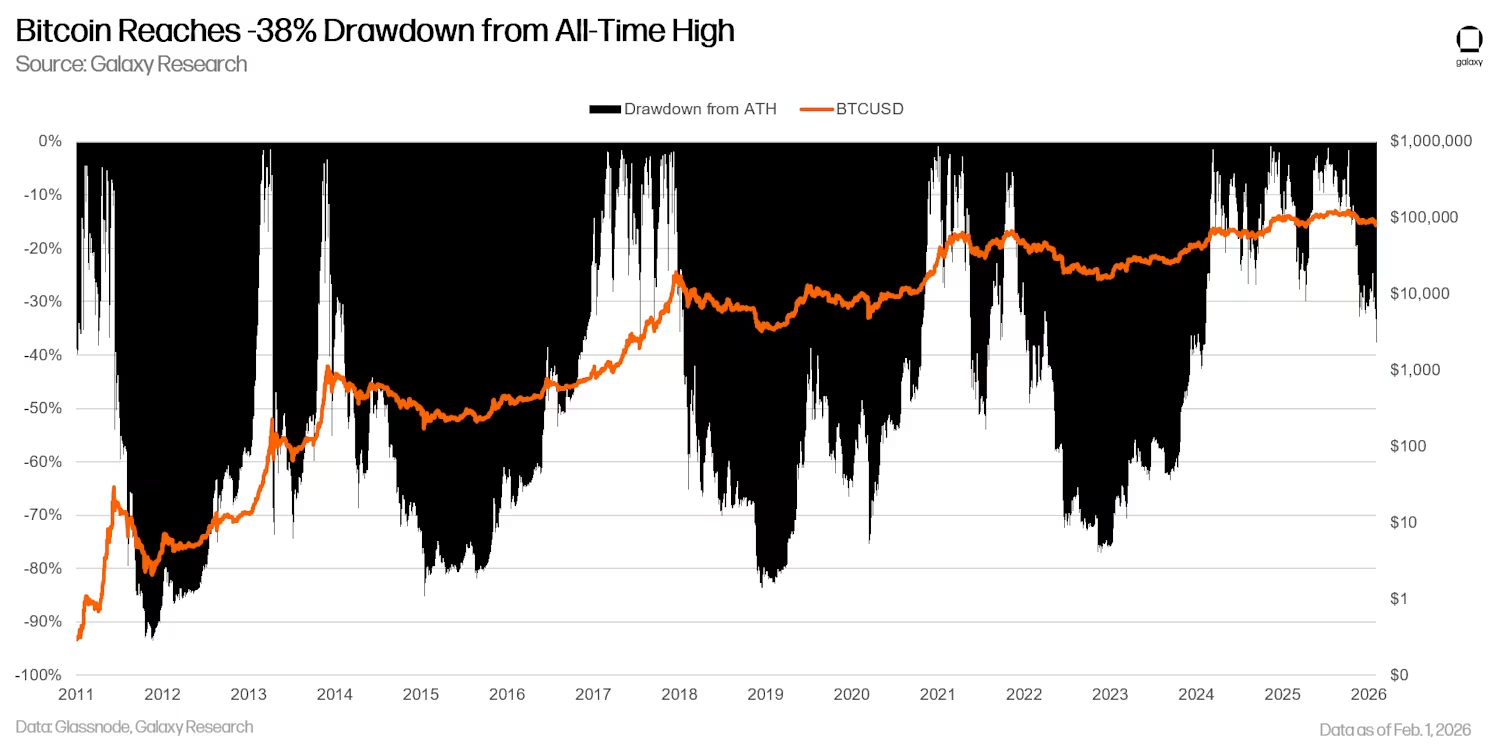
Historically, Bitcoin has never experienced a situation, except in 2017, where it dropped nearly 40% from its all-time high and did not see a decline exceeding 50% within three months (if it were to drop 50% from the current all-time high, Bitcoin's price would fall to $63,000). There is a significant gap in on-chain holdings between $82,000 and $70,000, increasing the likelihood of Bitcoin testing demand in that range in the short term. The current actual price of Bitcoin is approximately $56,000, with the 200-week moving average around $58,000 (notably, when BTCUSD trading prices are above these indicators, they rise daily).
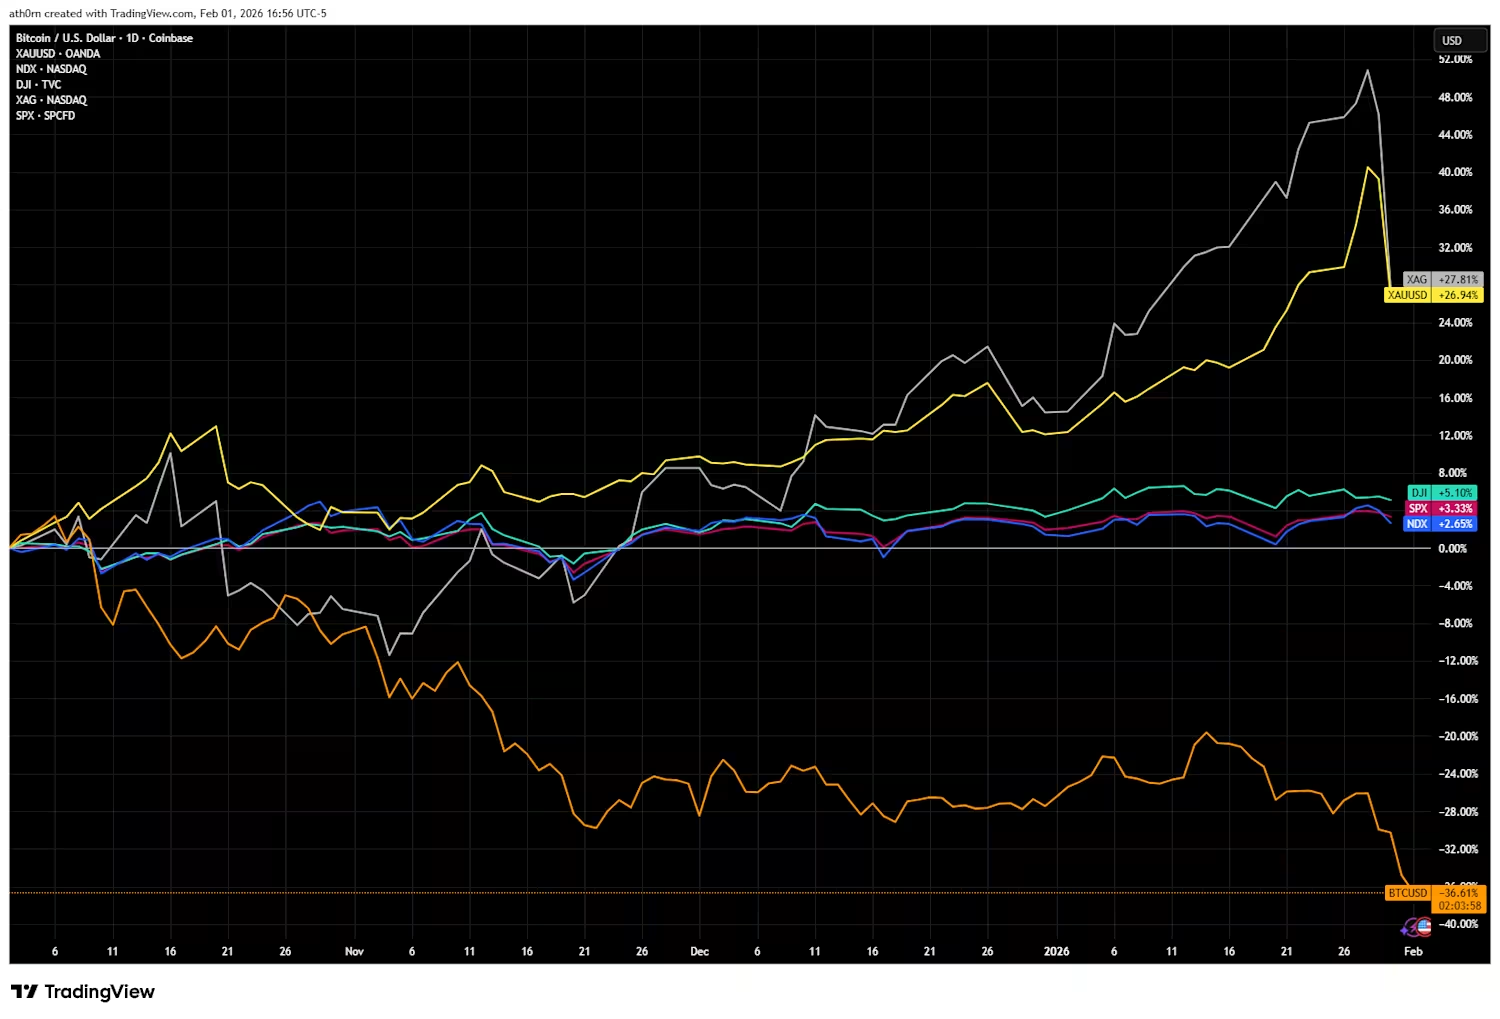
Currently, there are few signs of large whales or long-term holders significantly increasing their Bitcoin holdings, although the profit-taking behavior of long-term holders has begun to noticeably decrease. The market lacks effective "catalysts," and the narrative surrounding Bitcoin is also unfavorable. Bitcoin has failed to rise in tandem with gold and silver, not functioning as part of the overall market's "currency devaluation hedge trade."
Moreover, while the passage of the cryptocurrency market structure legislation, the "CLARITY Act," may serve as an external catalyst in the short term, its likelihood of passing has decreased in recent weeks. Galaxy Digital believes that even if the bill passes, the positive momentum is more likely to benefit altcoins rather than Bitcoin itself.
Although Bitcoin's price may fluctuate around a historical maximum discount of 10% (currently about $76,000), considering the factors mentioned above, it is highly likely that Bitcoin will retreat to the bottom of the supply gap (around $70,000) and further test the realized price ($56,000) and the 200-week moving average ($58,000) in the coming weeks or months. However, the longer it takes for the price to fall to these indicators, the more these indicators will rise due to the slow price increase, and their converging price may be higher than the current values. Historically, these price levels typically mark the bottom of a cycle and are good entry points for long-term investors.
Specific Analysis
Bitcoin Retracement Situation
As of the writing of this article, Bitcoin's trading price has dropped 38% from its all-time high of $126,296 set on October 6, 2025.
Key Price Level Analysis
This analysis includes the realized price, the 50-week moving average, and the 200-week moving average. In the past three bull markets (2013/14, 2017/18, 2019/21), the 50-week moving average has acted as a key support level, but once it is breached, the price ultimately falls back to the vicinity of the 200-week moving average. In November 2025, Bitcoin fell below the 50-week moving average, and the current 200-week moving average is around $58,000.
Similarly, Bitcoin's realized price (an indicator that measures its average cost based on the latest on-chain transactions) is currently about $56,000. In past bear market bottoms, while Bitcoin's trading price has fallen below the realized price, it typically finds support around this level or slightly below it before starting an upward trend.
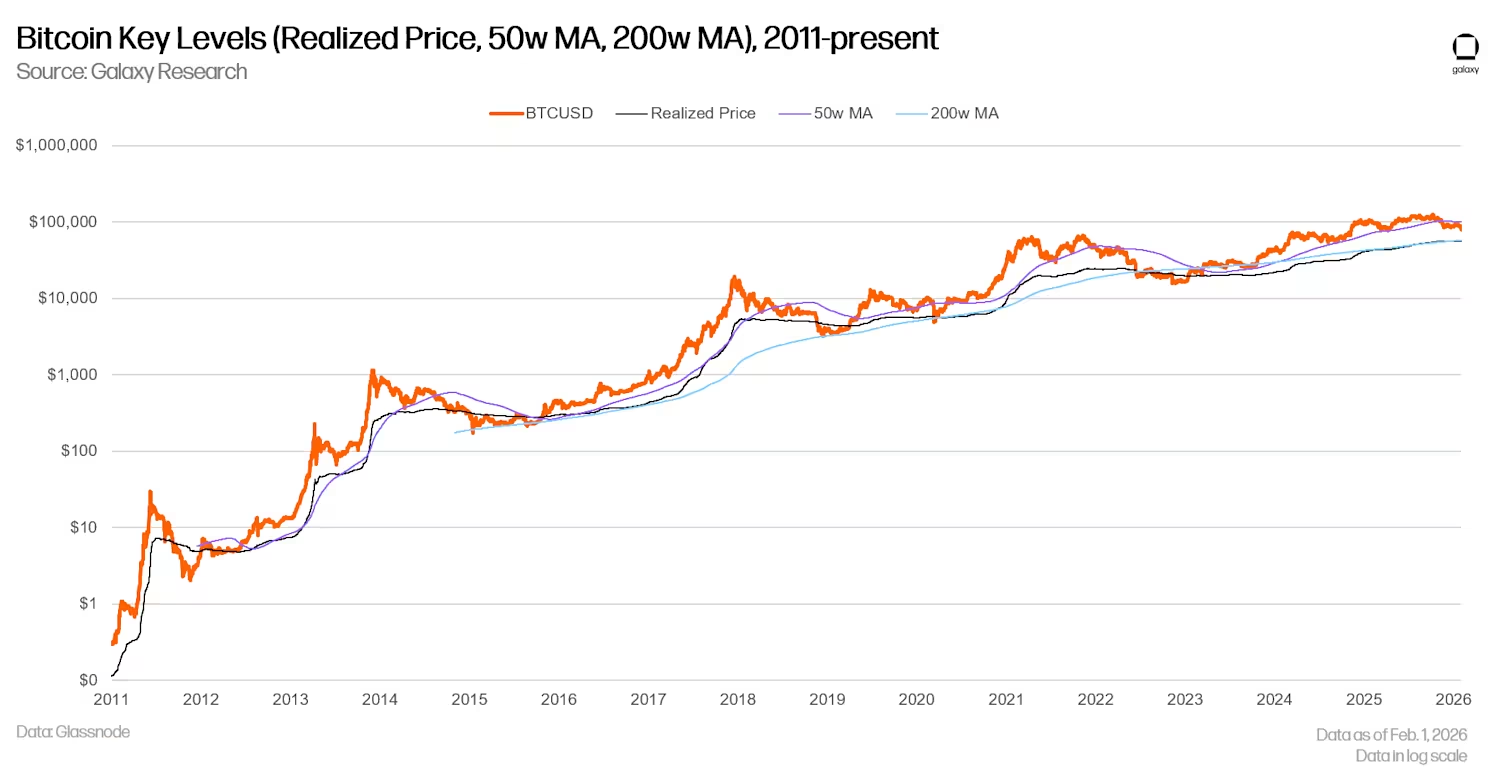
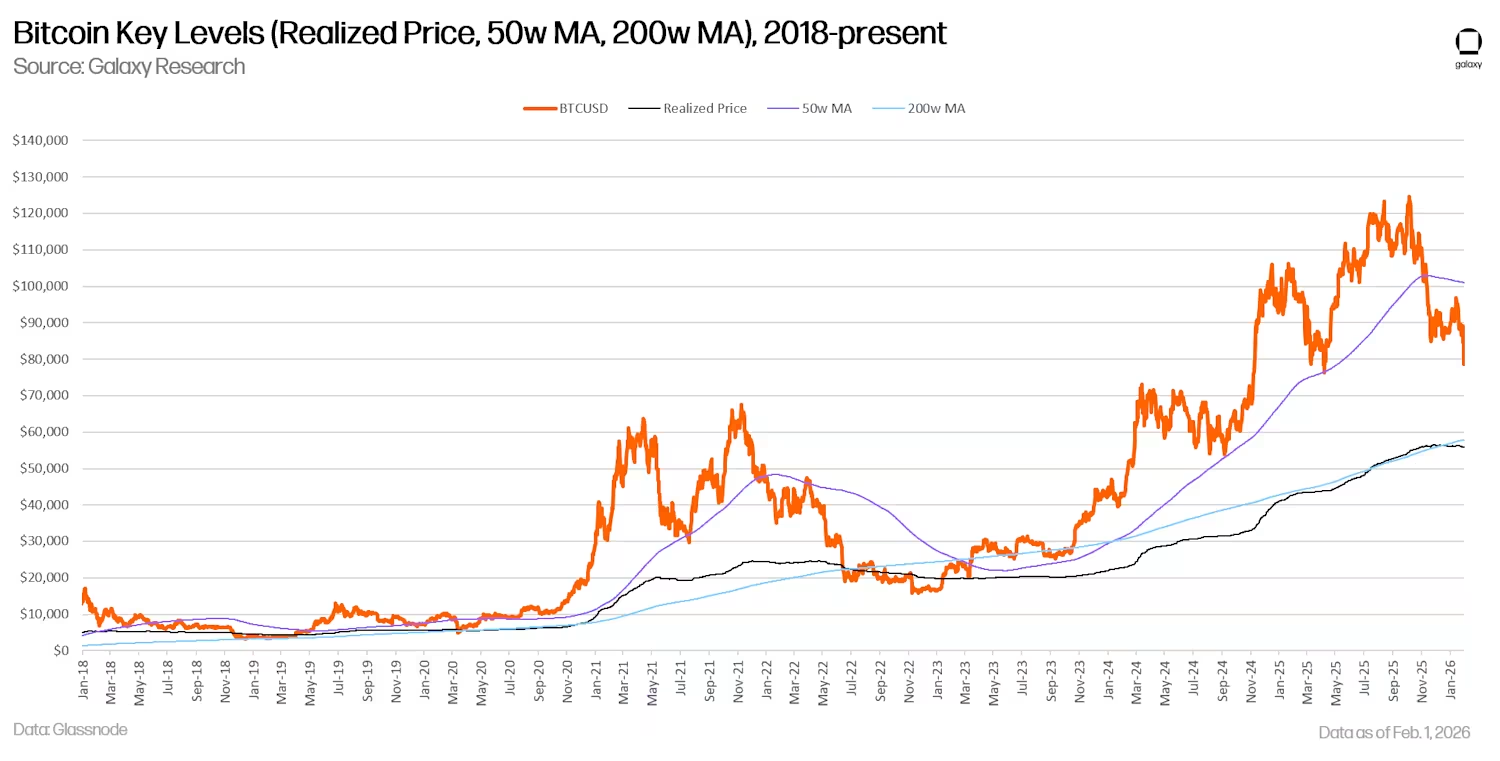
Observing the trend from 2018 to the present on a linear scale, it can be seen that the realized price and the 200-week moving average are converging, both nearing the high range of $58,000.
Bitcoin ETF Inflow Cost Basis Has Now Dropped Below
The U.S. Bitcoin ETF was officially launched in January 2024, opening the market to a new type of investor. In August 2023, when Grayscale won its lawsuit against the U.S. Securities and Exchange Commission (SEC) in the D.C. Circuit Court, expectations for the eventual launch of the ETF drove a comprehensive recovery in Bitcoin prices. As of the week ending January 30, 2026, the cumulative net inflow into U.S. Bitcoin ETFs reached $54 billion. This figure peaked at $62.2 billion in early October 2025 and has since dropped 12.4% from that all-time high. The overall scale remains substantial, and despite Bitcoin's spot price falling nearly 40% from its all-time high, ETF holders continue to show strong holding resilience.
However, the past two weeks have marked a "dark moment" in the history of Bitcoin ETFs, with a total net outflow of $2.8 billion, becoming the second and third worst periods in history. The price fluctuations on January 30 and 31 caused Bitcoin to fall below the average cost basis for ETF positions calculated based on inflows since the summer of 2024 (approximately $84,000).
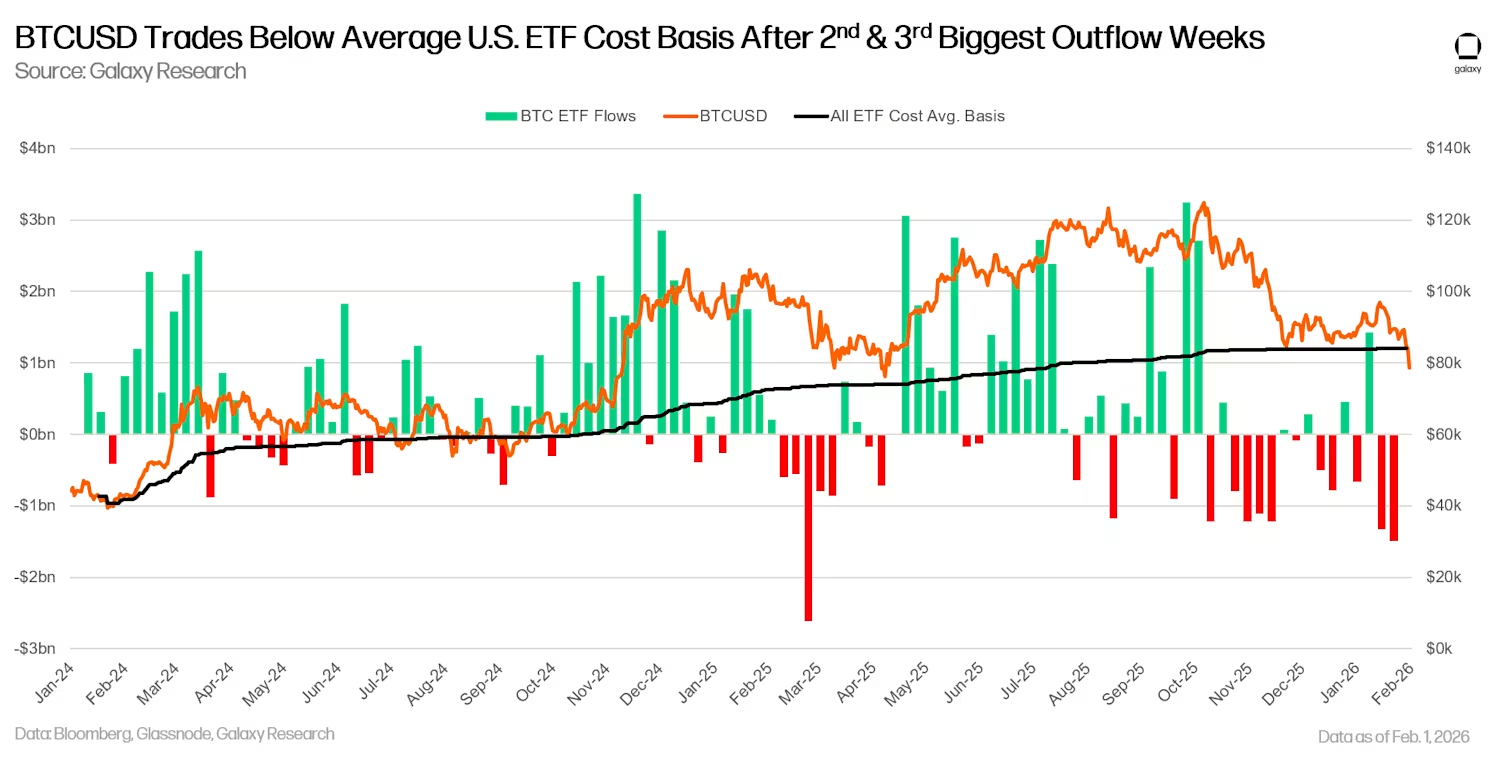
As of the time of writing, Bitcoin's trading price has dropped about 7.3% below the ETF average cost basis, and on January 31, this decline briefly expanded to 10%. Since the summer and early fall of 2024 (when the decline was as low as 9.9%), Bitcoin's trading price has never fallen below the average ETF creation cost. Therefore, it is reasonable to expect that this level will serve as a support point in the near term.
There is a Holding Gap in the $70,000 to $80,000 Range
By observing the supply based on the timing of the most recent on-chain transactions of Bitcoin, a clear holding gap exists in the $70,000 to $80,000 price range. Notably, the chart shows that approximately 194,000 Bitcoins last traded in the range of $77,000 to $79,500, with the vast majority of transactions occurring in the last two days.
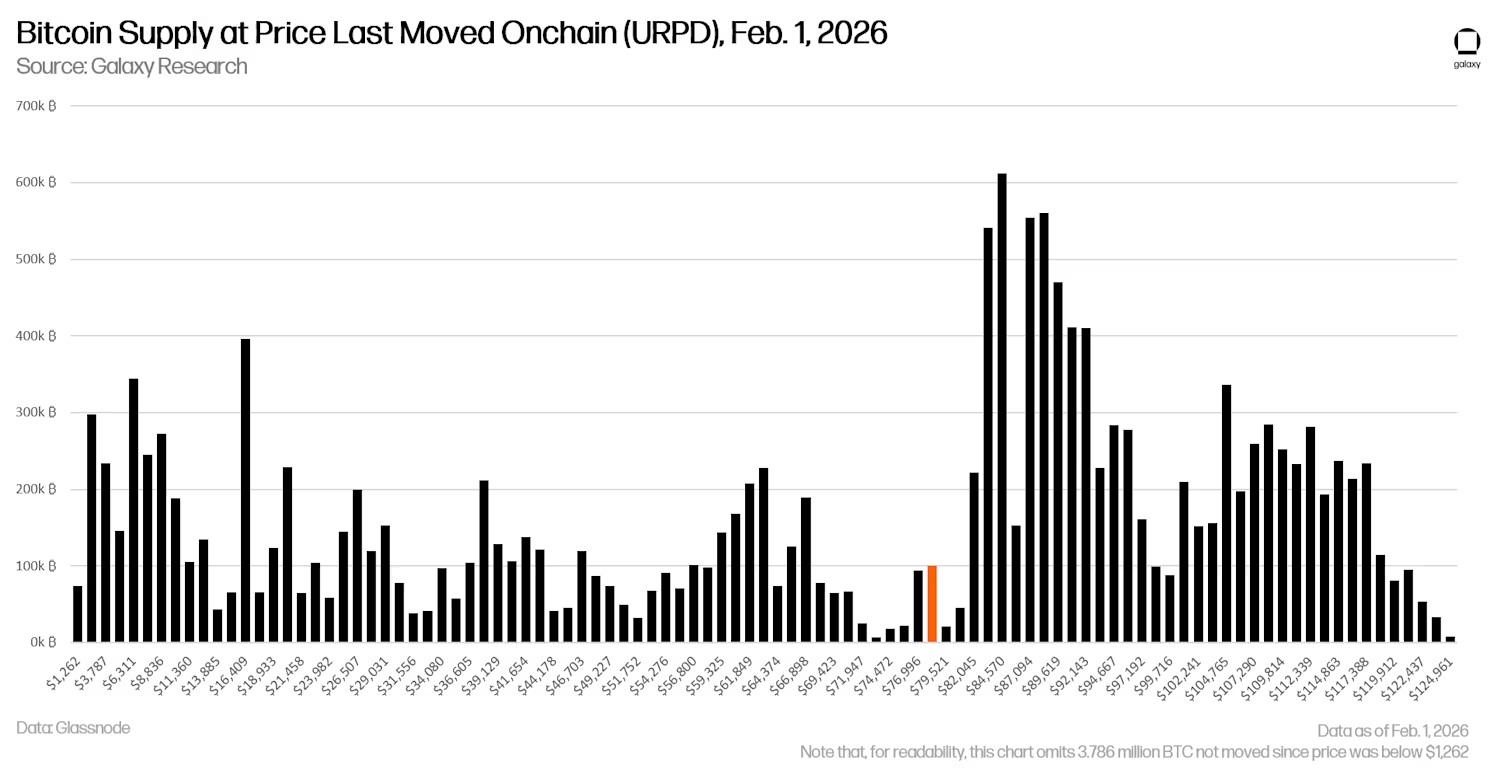
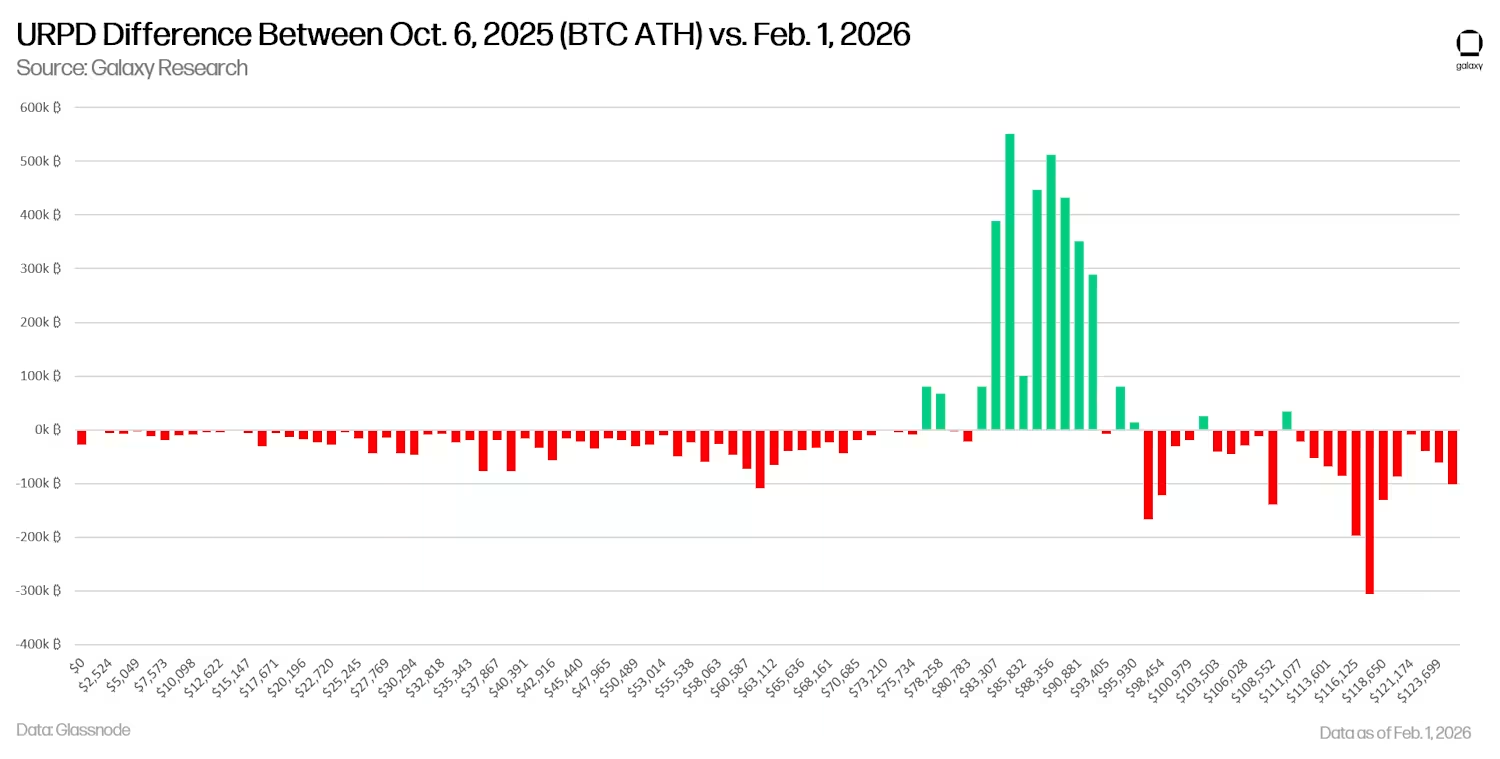
Comparing the data as of February 1, 2026 (URPD) with previous all-time high dates provides insight into the source of selling pressure since October 6 of last year. Over the past four months, there has been significant buying activity in the $80,000 to $92,000 price range, while other price ranges have intensified selling pressure, with the largest portion coming from investors who last bought at prices above $111,000. (Note that URPD is used to measure token price fluctuations and provides heuristic reference for analyzing token buy/sell situations in this article.)
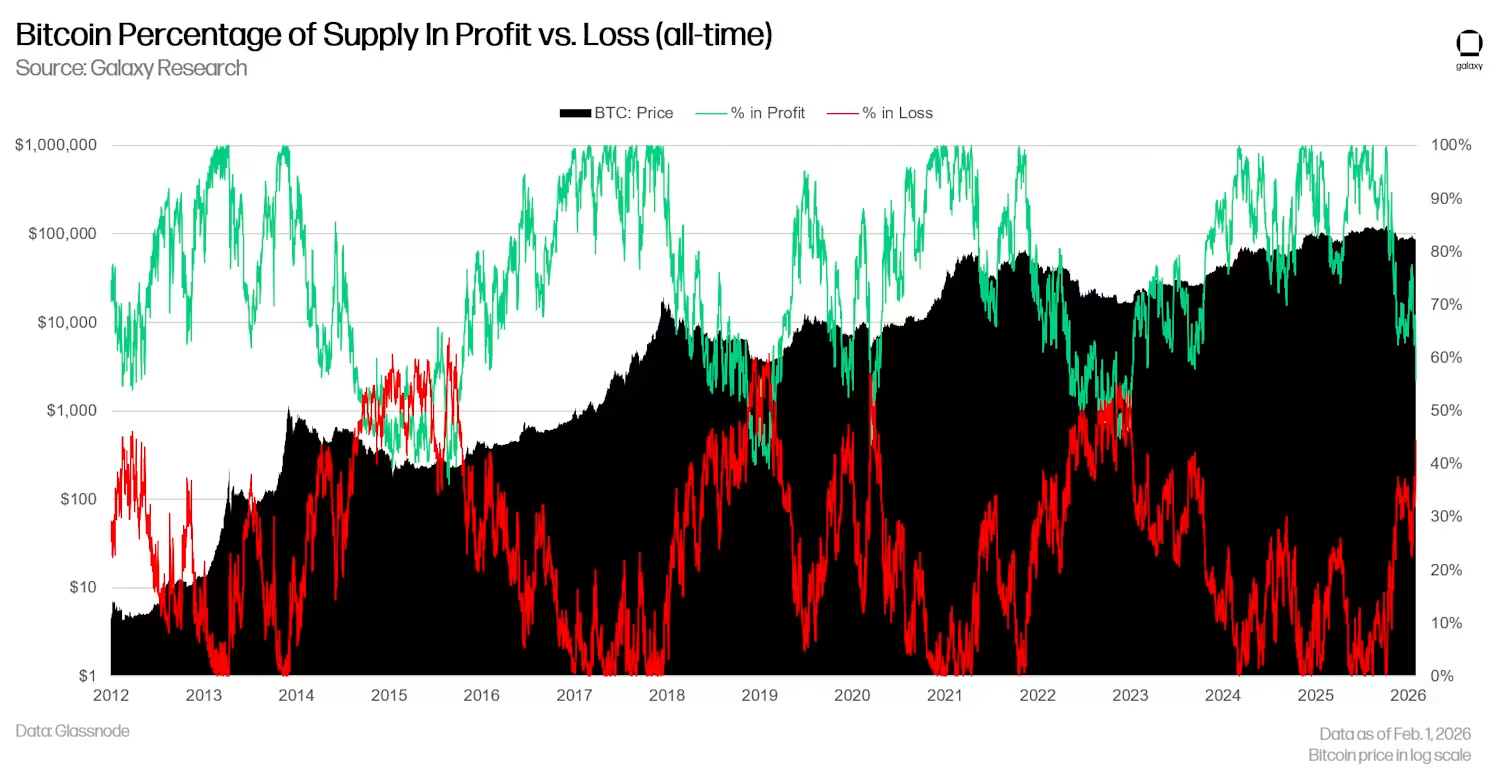
Holder Profit and Loss: Nearly Half Are at a Loss
Currently, 56% of Bitcoin supply is in profit, while 46% is in loss. Historically, all bear market bottoms have seen these two indicators converge towards a 50-50 balance, although the loss ratio in 2015 and 2018 once exceeded 60%. Historical data shows that when the profit and loss ratio approaches equilibrium, it typically indicates that a bottom forming over several months or even an entire cycle is underway.
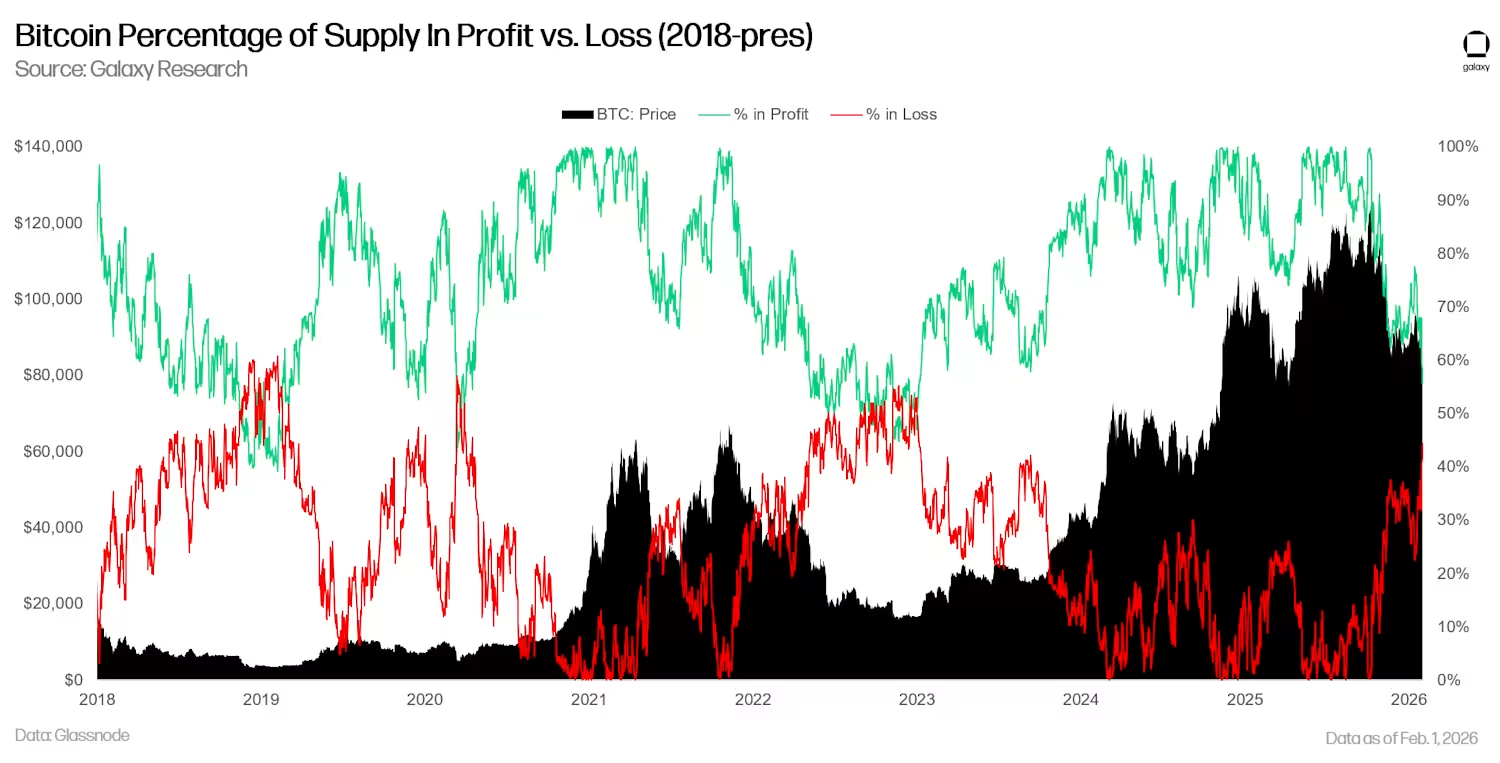
Expanding the time span to 2018 to the present and observing on a linear scale provides a clearer view of the structural position of this indicator.
Bitcoin Has Failed to Serve as a Hedge Against Currency Devaluation, and Its Safe-Haven Function Has Failed
Since the fourth quarter of 2025, Bitcoin has underperformed relative to gold, silver, and other metals, a phenomenon widely reported by various financial media. The macro and geopolitical uncertainties triggered by tariff policies and the reshaping of the global order, combined with concerns over the global sovereign debt situation, have driven investors into commodities and commodity currencies. In such a turbulent environment, Bitcoin's characteristics as a non-sovereign currency and permissionless transactions should have been its fundamental advantages, but the reality is that Bitcoin's price has fallen while traditional safe-haven assets (such as gold) have continued to rise. In a macroeconomic situation that should have favored Bitcoin, its weak performance has harmed its market prospects and led investors to shift their attention to other assets.
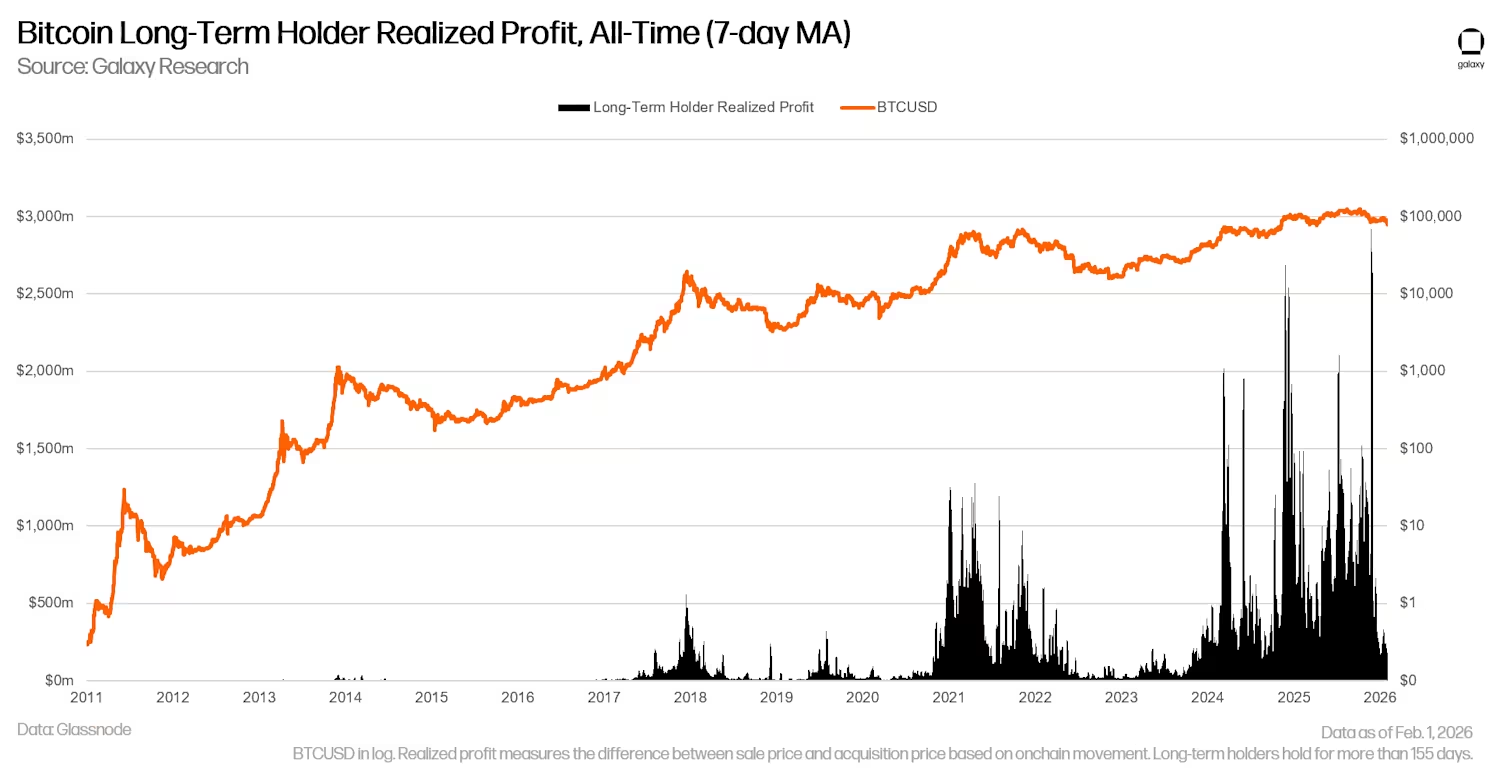
Profit-Taking Behavior of Long-Term Bitcoin Holders Has Significantly Slowed
In 2024 and 2025, the profit-taking scale of long-term Bitcoin holders (measured in USD) exceeded any other period in Bitcoin's history, with an average daily profit-taking amount reaching $500 million in 2025. Although this wave of selling has eventually eased, there may still be more long-term holders waiting to sell at higher prices. Further selling by long-term holders in the future could still pose resistance to price increases. However, the recent significant decline in realized profit-taking by long-term holders is noteworthy, indicating that the market may be approaching a cycle bottom (the chart below shows the realized profit-taking of long-term holders and its 7-day moving average).
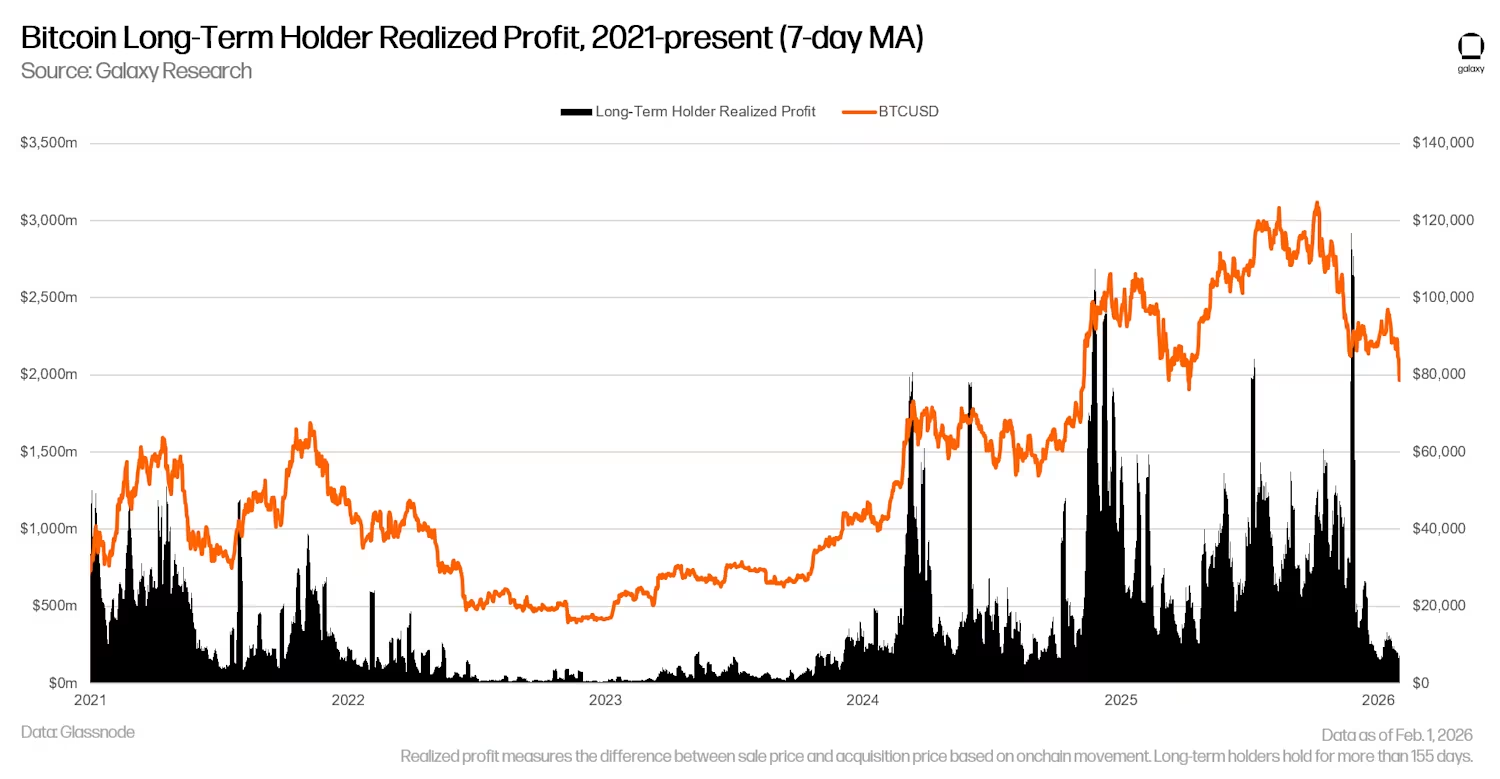
Converting BTCUSD to a linear trend and expanding the time frame to 2021 to the present clearly shows how the selling by long-term holders has created resistance to price increases, and market bottoms often coincide with a reduction in this profit-taking behavior. Therefore, whenever the selling pressure from long-term holders tends to exhaust, Bitcoin's price has the foundation to stabilize or even reverse.
Market Outlook
At the end of last year, we noted that the market environment in 2026 was "too chaotic" to make a clear prediction about Bitcoin's year-end price. Over the past 45 days, the investment environment has not only failed to clarify but has become even more chaotic. However, regarding BTCUSD, the current trend has become clearer, and the downward trend has further solidified. The upward momentum in January was hindered below $100,000, and last weekend it fell below $80,000, forming a new short-term low. Although we have not yet seen clear signs of accumulation to confirm that a bottom has fully formed, the reduction in selling behavior by long-term holders does indicate that their confidence in the current price range is increasing. If Bitcoin further declines to the vicinity of the 200-week moving average or the realized price, these key support levels have repeatedly proven to be highly attractive entry points for long-term investors, and this time may provide similar entry opportunities again.
免责声明:本文章仅代表作者个人观点,不代表本平台的立场和观点。本文章仅供信息分享,不构成对任何人的任何投资建议。用户与作者之间的任何争议,与本平台无关。如网页中刊载的文章或图片涉及侵权,请提供相关的权利证明和身份证明发送邮件到support@aicoin.com,本平台相关工作人员将会进行核查。


