Qinglan Crypto Class is starting! BTC from four cycles + news perspective, guiding you to step in sync with the crypto market rhythm.
1. Technical Analysis: Let's take a layered look
Short-term (15-minute chart): Weak oscillation, looking for direction
Trend: The price is lingering in the small range of 78,000-79,000, and the latest line has dropped to around 77,800, showing signs of wanting to slide down.
Indicators: Several short-term moving averages are intertwined and have turned downwards, forming resistance. After a death cross above the zero line, the MACD has now moved below the zero line, with green bars (negative values) still lengthening, indicating strengthening short selling pressure. The RSI has dropped sharply from around 50 to 34, entering the weak zone.
Key Levels: Look for 78,500 above (where the moving averages are intertwined), with strong resistance at 79,000. Below, support is at 77,500 (recent low), and if broken, 77,000 will be tested.
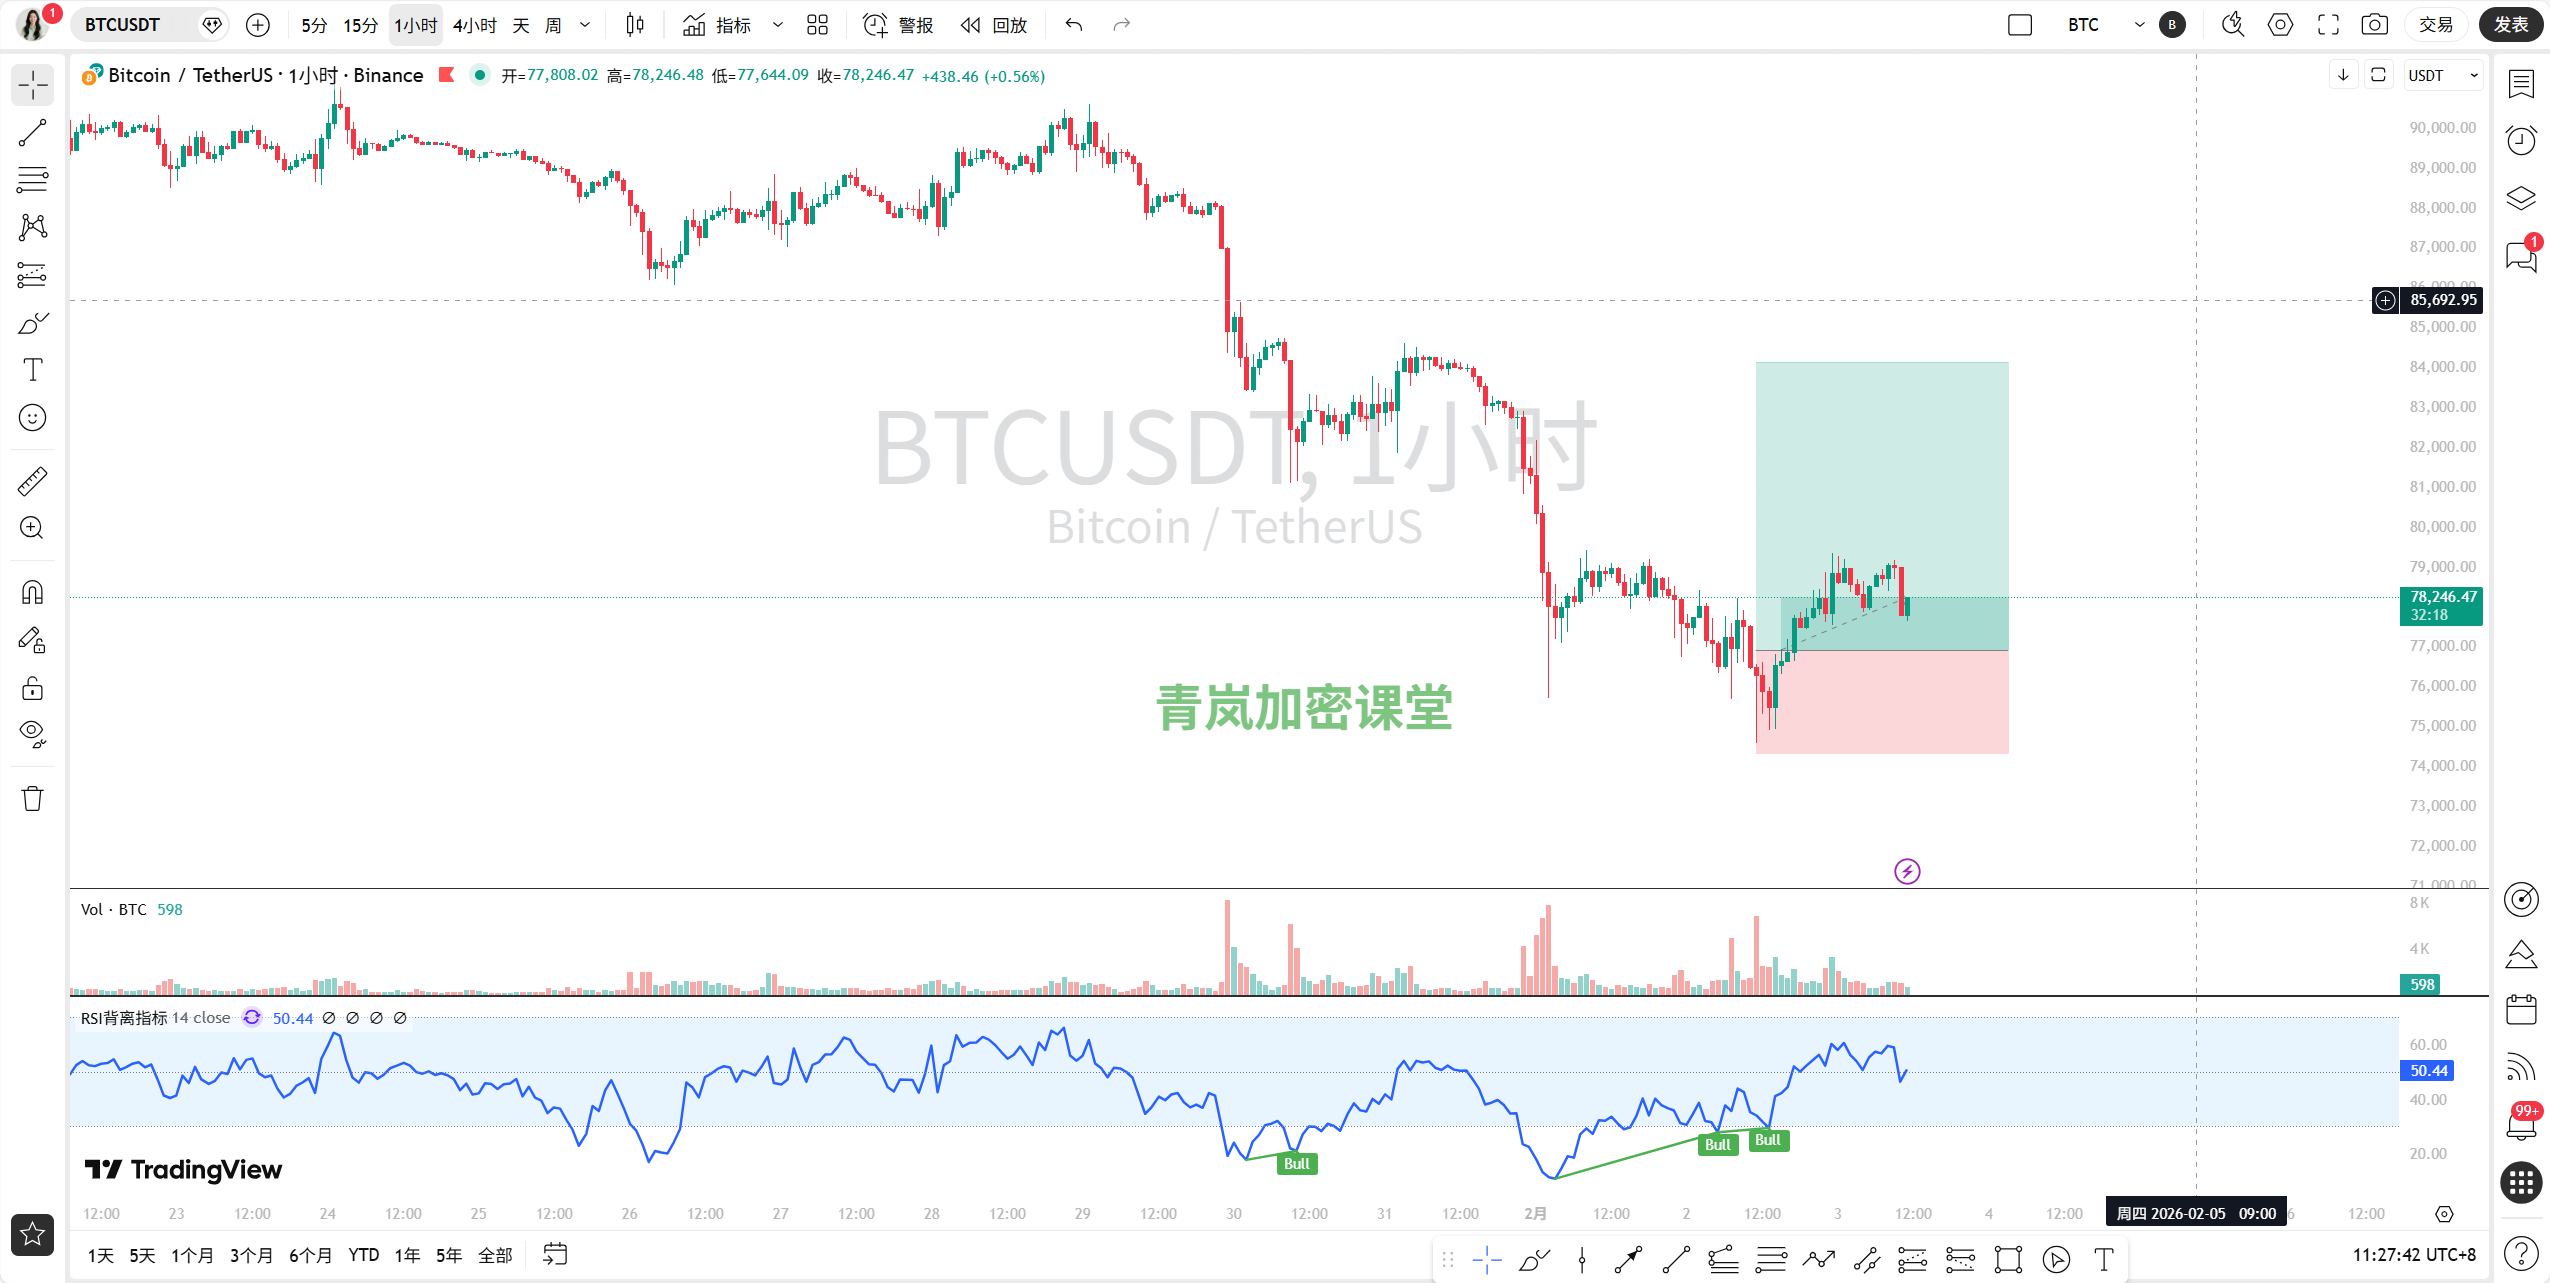
Medium-short term (1-hour chart): Weak rebound, returning to downtrend
Trend: Last night, it barely bounced above 79,000 but couldn't hold, swaying back down, and this morning's bearish line has almost erased the previous gains.
Indicators: MA5 and MA10 are flat, with the price pressed below them. After a golden cross below the zero line, the MACD's red bars are getting shorter, and the fast and slow lines are about to form a death cross again, indicating a lack of momentum for the rebound. The RSI couldn't rise above 50 and fell back to 46.
Key Levels: The area between 78,800-79,200 is a dense pressure zone. Below, still watch 77,500 and 77,000.
Medium term (4-hour chart): Weak rebound in a downtrend channel
Trend: The price is still in a clear descending channel. Last night's rebound can be seen as a technical pullback after hitting the lower boundary of the channel (around 77,500), and now hitting the middle of the channel (around 78,500-79,000) has encountered pressure.
Indicators: All major moving averages are in a bearish arrangement, pressing down from above. Although the MACD's green bars are shortening, the fast and slow lines are still deep in the water (far below the zero line), just taking a breather after a significant drop. The RSI is hovering in the weak zone of 30-40.
Key Levels: Strong resistance above at MA5 (around 78,300) and MA10 (around 79,600). Below, key focus is on the lower boundary of the channel, approximately in the 76,500-77,000 area.
Long-term (daily chart): Bearish pattern established, no signs of a stop yet
Trend: Continuous bearish closes, with the price breaking below all important moving averages, indicating a clear downward trend.
Indicators: MA5 (79,303) and MA10 (83,473) are in a bearish arrangement, pressing down hard. The MACD is below the zero line, with very large green bars (negative value) (-3263), indicating strong bearish pressure. The RSI has dropped to 28, entering the oversold zone, but no bottom divergence has appeared yet.
Key Levels: Above, there is pressure starting from MA5 (around 79,300), then the significant level of 80,000. Below, there is no clear technical support, but psychologically, the 75,000-76,000 area (close to some large holders' cost lines) is being watched.
2. News Perspective: Bulls and bears fighting, actions amidst panic
The news front is quite lively, let's focus on the key points:
Bearish (current pressure is real):
Market Sentiment: The Fear and Greed Index has dropped to "Extreme Fear" (14), having fallen for several months, with leveraged positions being heavily liquidated.
Capital Flow: The total market value of stablecoins has stopped growing, and even shows signs of turning down, with funds flowing out of exchanges, indicating a decrease in money willing to enter for speculation.
Macroeconomic Factors: Personnel issues at the Federal Reserve may delay interest rate cuts, and a potential government shutdown in the U.S. could lead to key data being unavailable, increasing uncertainty.
Holding Pressure: Large holders like MicroStrategy are nearing their cost lines, becoming potential structural selling pressure.
Bullish (a spark of hope):
Institutional Actions: Binance has used its SAFU fund for the first time, purchasing 100 million USD worth of BTC, and plans to gradually convert 1 billion USD of stablecoins into BTC in the future. This is a very clear signal of left-side bottom fishing, indicating confidence from the exchange at this position.
Big Names Speaking: MicroStrategy's Saylor, despite floating losses, insists on a bullish outlook and plans to continue buying.
Historical Associations: Some analysts say the current ETH/BTC trend resembles that before the last bull market, suggesting that the sharp drop might be a prelude to a bull market, giving the market a story to tell.
Economic Data: The U.S. manufacturing PMI is decent, indicating economic resilience, which is not a bad thing in the long run.
3. Qinglan's Perspective & Trading Strategy
By looking at both the technical and news perspectives, my view is: The market is in a short-term oversold rebound correction phase within a medium to long-term downtrend, but this rebound is very weak and may have already ended. Binance's bottom fishing is an important "support" signal, but it alone cannot reverse the downward momentum formed by macro sentiment, capital outflow, and technical breakdowns.
Trend Judgment:
Short-term (next few days): Oscillation is slightly bearish. The small cycle chart shows a lack of strength in the rebound, with a need for another downward probe.
Medium-term (a few weeks): This is a bottom-seeking process within a downtrend. The bearish arrangement in the larger cycle is intact, requiring time to digest selling pressure and slowly build a bottom.
Long-term (monthly view): The direction is still unclear, but it has entered a value range. Miners are struggling, large holders are near their cost lines, and exchanges are buying with real money, all indicating that long-term support is becoming more evident, but for a reversal, we need clearer macro turning points or signals of capital flow improvement.
Key Levels to Remember:
Upper Pressure: 78,500 -> 79,300 -> 80,000.
Lower Support: 77,500 -> 76,000-76,500 (key area) -> 75,000.
Trading Thoughts (old rules, for reference only, decisions rely on yourself):
For friends with no positions/light positions: Be patient, don’t rush to bottom fish. This is a "rebound meeting resistance in a downtrend," and the risk of going long outweighs the opportunity. Focus on observing whether a clear stop-loss stabilization signal (like a long lower shadow on the daily line, indicator bottom divergence, etc.) appears when the price reaches the 76,000-76,500 area, then consider gradually and lightly positioning.
For friends with positions: Rebounds are for reducing positions and lowering risk. If your position is heavy, you can use the opportunity of the price rebounding to the 78,500-79,300 area to appropriately reduce some positions, leaving cash for safer positions later. Be sure to set stop-losses.
For short-term experts: The strategy can be to primarily short near key resistance levels, with stop-loss set above 79,500. If you want to go long, it can only be treated as a quick in-and-out ultra-short-term rebound, and strict stop-loss must be enforced.
For more quantitative breakdowns of how real-time news affects market sentiment, updates are available in my Qinglan Crypto Class, www.qinglan.org.
Finally, here’s a thought for today:
"Market trends always sprout in despair, grow in hesitation, mature in celebration, and collapse in longing." The market is currently on the boundary of "despair" and "hesitation," panic is real, but the actions beneath the surface are also real. What we need to do is not guess the lowest point, but learn to identify signals of trend reversal, first protect the principal, and then quietly wait for our "sprouting" moment.
Alright, that’s it for today’s morning analysis, see you in the market!
免责声明:本文章仅代表作者个人观点,不代表本平台的立场和观点。本文章仅供信息分享,不构成对任何人的任何投资建议。用户与作者之间的任何争议,与本平台无关。如网页中刊载的文章或图片涉及侵权,请提供相关的权利证明和身份证明发送邮件到support@aicoin.com,本平台相关工作人员将会进行核查。


