Author: Axel Bitblaze
Translator: Block unicorn
Summary
Gold has just experienced its worst day since the 1980s. Silver plummeted over 30% in just a few hours, marking the most extreme single-day volatility in 45 years. The precious metals market evaporated approximately $3 trillion in market value in a single trading day.
Meanwhile, Bitcoin's price stabilized above $80,000, currently reaching $82,000. Although it has dropped, it has not collapsed. (However, as of the time of writing, Bitcoin's price has fallen below $80,000, briefly dropping to around $77,000.)
This article will delve into the events' background, their significance, and the future trends revealed by the data. There is no blind optimism or alarmism, only the presentation of data.
Core Argument: We may be witnessing the beginning of a capital rotation event that will reshape institutional funds' views on "safe-haven assets," with Bitcoin poised to benefit. However, the path to this goal is far more complex than the cryptocurrency Twitter community acknowledges.
Part One: The Events
Data Overview
On January 30, 2026, precious metals experienced a crash that will be studied in financial textbooks for decades to come.
Gold:
Plummeted from a historical high of $5,600 to $4,718
Daily drop of 12%
Recorded the most severe single-day drop since the early 1980s
The intraday drop even exceeded the declines during the 2008 financial crisis
Silver:
Dropped from $120 to $75-78
Plummeted 30-35% within hours
Recorded the worst single-day performance since March 1980 (the Hunt brothers era)
Nearly erased all gains made in January
Platinum: down 24%
Palladium: down 20%
To better understand this drop: the gold market lost approximately $3 trillion in market value in a single trading day… If we combine the losses of gold and silver, it exceeds $8 trillion.
Here are the GDP reference values of various countries:
United States: $30.5 trillion
China: $19.2 trillion
Germany: $4.7 trillion
India: $4.2 trillion
Japan: $4.2 trillion
Silver's volatility was even more extreme. Only traders who experienced the Hunt brothers' crash can comprehend a similar scenario.
Triggering Factors
The direct catalyst was President Trump nominating Kevin Warsh to replace Jerome Powell as the next Federal Reserve Chair in May 2026.
The market initially interpreted Warsh as a hawkish candidate. His resume includes:
Serving as a Federal Reserve Governor from 2006 to 2011
Being one of the most hawkish members of the Federal Open Market Committee (FOMC) during his tenure
Voting against the second round of quantitative easing (QE2) in 2010
Calling for a "regime change" at the Federal Reserve
Advocating for a significant reduction in the Federal Reserve's balance sheet
After the announcement, the dollar surged. Typically, a stronger dollar leads to weaker gold prices, but this movement far exceeded normal levels.
What actually happened: The rally in precious metals had become overheated. In January alone, gold prices rose by 18%. Silver had increased by over 40% year-to-date. Warsh's statement was not the direct cause of the drop but merely an excuse for the market to take profits.
"This is just crazy," said Matt Maley of Miller Tabak. "This is likely forced selling. The silver market had accumulated a lot of leverage. As prices plummeted, margin calls followed."
Feedback loop: Leveraged longs face margin calls → Forced selling → Price plummets → More margin calls → More forced selling. We have seen this pattern in the cryptocurrency space before. Today, gold and silver are also feeling the pain.
Part Two: Macroeconomic Background
Why did gold rise so sharply before?
To understand the significance of this crash, we first need to grasp the factors driving this surge.
Central Bank Purchases:
In 2025, central banks collectively bought 863 tons of gold
They had previously purchased over 1,000 tons of gold for three consecutive years (2022 - 2024)
Poland alone purchased 102 tons of gold, currently aiming to increase its gold reserves to 30%
The total gold reserves of central banks now exceed $4 trillion
For the first time since 1996, central banks' gold holdings have surpassed U.S. Treasury reserves
De-dollarization:
The dollar's share in global foreign exchange reserves has dropped from 70% in 1999 to 58% in 2024
In 2022, the U.S. froze over $300 billion of Russia's foreign exchange reserves, raising concerns among non-aligned countries
Since 2018, China has been steadily reducing its holdings of U.S. Treasuries
Gold provides "jurisdictional risk" protection that Treasuries cannot offer
Deteriorating U.S. Fiscal Situation:
National debt has reached $38 trillion
Debt-to-GDP ratio is as high as 122%, a record since World War II
In 2026, interest payments on the debt will exceed $1 trillion
The Responsible Federal Budget Committee warns of six potential crisis scenarios
Geopolitical Chaos:
Escalating tensions between the U.S. and Iran
Uncertainties from trade wars
Concerns over government shutdowns
Tensions in Greenland/Arctic regions
Instability in the Middle East
The rise in gold prices is not driven by speculation but by genuine concerns over the stability of the existing financial order. Central banks purchasing over 1,000 tons of gold annually is not for speculative purposes.
The "Safe-Haven Asset" Question
Interestingly.
The entire value proposition of gold lies in its status as the ultimate safe-haven asset, the asset you hold during chaotic times, a store of value that has endured for 5,000 years, transcending the rise and fall of empires.
However, today, this narrative has been undermined.
If your "safe-haven asset" drops 12% in a single day, and silver drops 30%, what exactly are you hedging against?
The cryptocurrency community has emphasized this point for years. Gold advocates always respond, "Bitcoin dropped 80% in a bear market, while gold is stable."
Well.
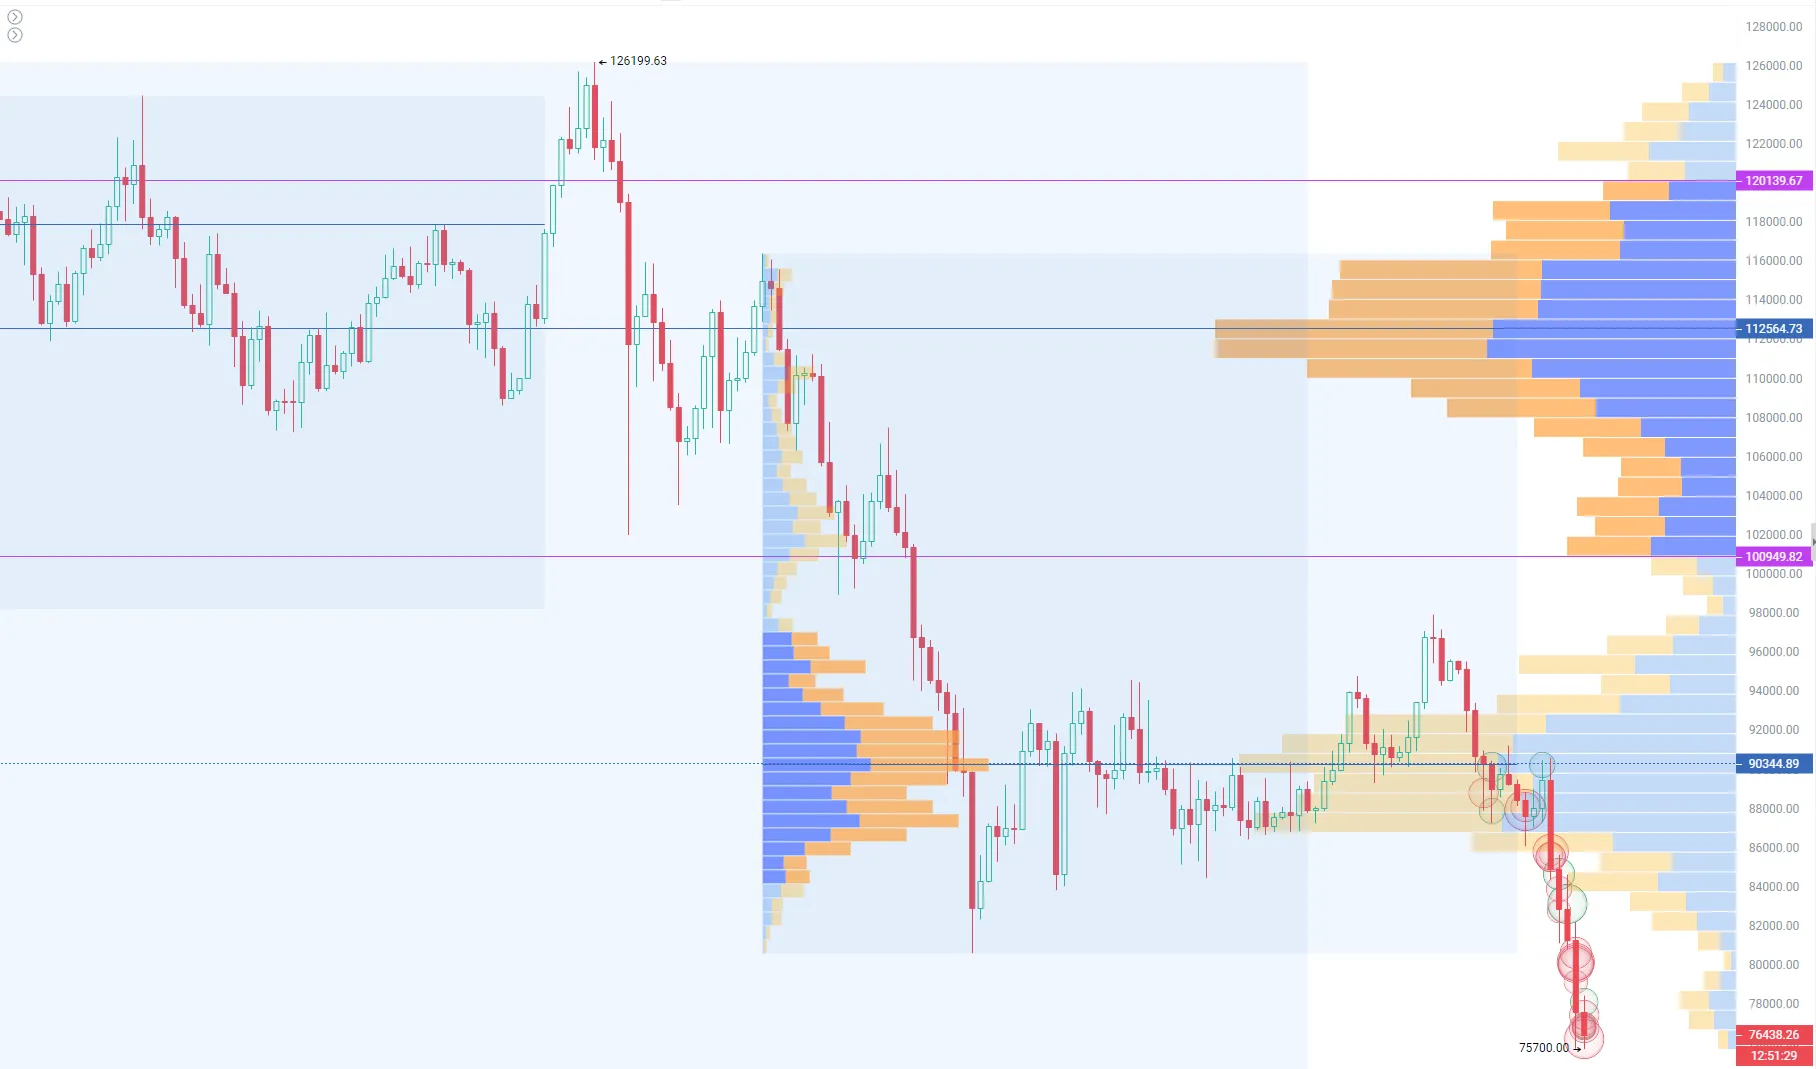
Bitcoin dropped 30% from its historical high of $126,000 in October, over four months. Gold dropped 12% in four hours.
The single-day volatility of silver even exceeded that of Bitcoin. So think about it.
Does this mean gold is no longer a store of value? No. Gold has undergone 5,000 years of monetary evolution, and it can still withstand this test.
But it does challenge the claim that gold is immune to the volatility of "speculative" assets. When leverage accumulates and positions become overcrowded, even the world's oldest currency can fluctuate like a junk coin.
Part Three: Where is the Money Flowing?
Rotation Theory
Tom Lee of Fundstrat has been outspoken: gold and silver have been "sucking the oxygen out of all assets," including cryptocurrencies.
The logic is simple. There is a finite pool of capital seeking to hedge against the following risks:
Inflation
Currency devaluation
Geopolitical risks
Fiscal irresponsibility
In 2025, the vast majority of this capital chose gold. The results:
Gold: up 66% in 2025
Silver: up 135% in 2025
Bitcoin: down 7% in 2025
Yes, Bitcoin declined for the entire year while gold nearly doubled.
Institutional capital, which typically views Bitcoin as a portfolio diversification tool, turned to the "safer" precious metals. Every dollar flowing into gold ETFs means one less dollar flowing into Bitcoin ETFs.
Data confirms this:
Bitcoin ETFs lost $4.57 billion from November to December 2025, marking the worst two-month performance ever.
During the same period, gold ETFs saw record inflows.
Institutional investors clearly indicated a preference for the "stability of physical gold" over the volatility of cryptocurrencies.
But the essence of rotation is that it is two-way.
Historical Patterns
André Dragosch of Bitwise Europe has documented a consistent lag pattern between the rises of gold and Bitcoin. Using Granger causality tests, he found that gold often leads Bitcoin by 4-7 months.
The mechanism is as follows:
Crisis/uncertainty arises
Capital immediately flows into gold, viewing it as a safe-haven asset
Gold rises, Bitcoin lags
Once gold stabilizes or corrects, capital shifts to higher beta alternative assets
Bitcoin catches up with leverage effect
This pattern has appeared during the following periods:
The COVID-19 pandemic shock in 2020: Gold rose first, followed by Bitcoin months later
The banking crisis in 2023: Gold surged immediately, Bitcoin lagged, then outperformed gold
Late 2025: Gold saw parabolic growth, while Bitcoin stagnated… Is rotation about to happen?
If this pattern continues, the sharp correction in gold could become a catalyst for capital to reassess Bitcoin.
Paul Howard of trading firm Wincent stated, "The cryptocurrency market has always been a victim of the hot inflow of venture capital into commodity trading. This dynamic may now be shifting."
What the Options Market is Saying
An interesting data point: Despite Bitcoin's price being near annual lows, options traders are still bullish, betting on its rise.
The most actively traded contracts are call options with a strike price of $105,000 for February. Some call options with a strike price of $100,000 for January have been rolled over to call options with a strike price of $125,000 for March… Traders extended the trading period but raised the target price.
This could lead to what is known as a "gamma squeeze." As spot prices approach these strike prices, market makers selling these call options are forced to buy Bitcoin for hedging. This buying pressure creates a feedback loop that rapidly drives up prices.
The options market is not always correct, but it is where mature capital is betting, and this capital is betting on price increases.
Part Four: Catalyst
Kevin Warsh: Not what you think
The market initially reacted by viewing Warsh as hawkish. The dollar surged, gold plummeted, and risk assets were sold off.
However, a closer analysis reveals a more complex situation.
Yes, Warsh has historically been a hawk. In 2009, during the peak of the financial crisis, the unemployment rate was as high as 9%, and inflation was only 0.8%. He was concerned about inflation at that time and voted against the second round of quantitative easing (QE2). He also called for a significant reduction in the Federal Reserve's balance sheet.
But for 2026, the following points are crucial:
Warsh has recently signaled a more dovish stance, believing that the productivity gains from artificial intelligence mean that interest rates can be lower than traditional models predict. If Trump did not reach some consensus on interest rate cuts, he would not have nominated him.
"We see Warsh as a pragmatist rather than an ideologically hawkish figure," said Krishan Guhar of Evercore. "Given his hawkish reputation and being viewed as an independent, he is more likely to align the Federal Open Market Committee (FOMC) with him, potentially leading to at least two, if not three, rate cuts this year."
The market currently expects 2-3 rate cuts in 2026. Warsh taking over as Fed Chair in May will not change this trend; if he wants to prove he is not "Trump's puppet," he may even accelerate the rate-cutting process.
Rate cuts = more liquidity = historically favorable for Bitcoin.
Debt Spiral
This is the elephant in the room that no one wants to discuss openly.
The U.S. national debt currently stands at $38 trillion. By 2026, interest payments will exceed $1 trillion. This is more than the entire defense budget and roughly equivalent to healthcare spending.
Ray Dalio has been warning about this for years. His recent view is: "My descendants, even those yet to be born, will repay this debt with devalued dollars."
History shows that when a country accumulates such massive debt, it rarely resolves the issue through spending cuts or hard defaults. They typically address it through currency devaluation and monetary expansion.
This is the fundamental reason for optimism about gold and Bitcoin. Both are "external currency" assets that central banks cannot print.
Gold has just proven that it can experience severe market corrections. Bitcoin has always been volatile. But both represent a challenge to the sustainability of the current monetary order.
The Responsible Federal Budget Committee has outlined six potential crisis scenarios:
Financial crisis (market crash)
Inflation crisis (Fed forced to monetize debt)
Contraction crisis (forced spending cuts)
Currency crisis (dollar loses reserve currency status)
Default crisis (unable to repay debt)
Gradual crisis (slow decline in living standards)
We may face some combination of these six crises. In each scenario, whether gold or Bitcoin, hard assets will be more attractive relative to promises denominated in fiat currency.
ETF Fund Flow Dynamics
The situation with spot Bitcoin ETFs is often misunderstood.
Yes, there was a massive outflow of funds at the end of 2025. Between November and December, $4.57 billion flowed out. This sounds catastrophic.
But context is important:
A significant portion was year-end tax loss harvesting
Three funds accounted for 92% of the outflows
BlackRock's IBIT fund continued to see inflows despite outflows from other funds
In the first week of January 2026, there was an inflow of $1.1 billion
The ETF infrastructure has not disappeared. In fact, it has matured significantly:
Institutional custody solutions are very robust
Regulatory clarity has improved
Financial advisor education programs are expanding
What has changed is the direction of public opinion. In 2024, ETFs were the hot new thing; in 2025, gold became the hot new thing. ETF fund flows are influenced by market trends, which can change rapidly.
Standard Chartered's view: "The strategic significance of Bitcoin allocation remains. What has changed is the timing, not the theory."
Part Five: Price Scenarios
Consensus Views
I have compiled predictions from major institutions and well-known analysts. Here are their views for 2026:
Bullish Scenario ($150,000 to $225,000):
Standard Chartered: $150,000 (previously predicted $300,000)
Bernstein: $150,000 by the end of 2026
Maple Financial: $175,000
Nexo: $150,000 to $200,000
JPMorgan: $170,000
FundStrat (Tom Lee): $200,000 to $250,000
Base Scenario ($110,000 to $150,000):
Carol Alexander (University of Sussex): $75,000 to $150,000 range, with a midpoint of $110,000
CoinShares: $120,000 to $170,000
Citigroup: Base scenario $143,000, bullish scenario $189,000
Polymarket: 45% probability of reaching $120,000, 21% probability of reaching $150,000
Bearish Scenario ($60,000 to $80,000):
Fidelity (Jurrien Timmer): If the cycle runs normally, support is at $65,000 - $75,000
Peter Brandt: 25% probability of a significant pullback to $55,000 - $57,000
Fundstrat (Sean Farrell): If support fails, it could drop to $60,000 - $65,000 in the first half of the year
My view:
The market generally expects a target price in the range of $120,000 to $150,000 for 2026. This represents a 45% - 80% increase from current levels. While it may not surge as predicted at the beginning of 2025, it is not pessimistic either.
Key Price Levels to Watch
$80,000: Major psychological support level. This level has been defended multiple times. If this level is broken with volume, then $74,000 and $65,000 will become the next targets.
$100,000: Psychological resistance level. If it can regain this level, market sentiment will change significantly.
$112,000: Breakout target based on the current consolidation pattern of an ascending triangle.
$126,000: Previous all-time high. Breaking this level will confirm entry into a new bull market phase.
Based on the data, I believe the most reasonable forecast scenario is as follows:
Short-term (February to March): Prices will continue to oscillate between $78,000 and $95,000. Gold/silver volatility needs to calm down. The confirmation process for Warsh will bring uncertainty. A retest of the $80,000 support level is possible.
Second Quarter of 2026 (April to June): Warsh will take office in May. If rate cuts become a reality, liquidity will return. Prices may break through $100,000 to $115,000. If the lagging pattern continues, the rotation from gold to Bitcoin may accelerate.
Second Half of 2026:
Depends on the macroeconomic situation. If the Fed cuts rates 2-3 times and the dollar weakens, prices could reach $130,000 to $150,000. If the macroeconomic deterioration exceeds expectations (e.g., recession, credit crisis), Bitcoin may initially sell off with other assets before decoupling.
To be frank: No one knows. The possibilities of outcomes are vast. Positioning should reflect this uncertainty.
Part Six: Risks
Why This Argument Might Be Wrong
1. Gold rebounds, and rotation never happens
The recent crash could be an opportunity to buy gold rather than a shift in positions. Central banks remain net buyers. Geopolitical risks have not disappeared. Structural support for gold still exists.
If gold stabilizes and resumes an upward trend, those funds that "should" shift to Bitcoin may just continue holding gold. The rotation theory requires gold prices to consolidate or decline over a longer period.
2. Bitcoin fails to decouple
In severe risk-off events, Bitcoin has never consistently played the role of a safe-haven asset. It typically sells off alongside stocks and then rebounds faster.
If a broader market crash, economic recession, credit crisis, or escalation of geopolitical tensions occurs, Bitcoin is likely to plummet alongside other assets. The "digital gold" narrative has yet to be validated in a true stress test.
Counterpoint: Bitcoin does not need to become a safe-haven asset to outperform the market. It just needs to attract a portion of capital seeking alternatives to traditional assets.
3. Regulatory/political risk
The regulatory environment in the U.S. has improved, but it is not foolproof. Scandals, major hacks, or political changes could quickly alter the market landscape.
The Fed's policy adjustments are generally viewed as neutral to positive for cryptocurrencies, but the Fed's policies can indirectly affect Bitcoin through liquidity conditions. If inflation accelerates again, and the Fed is forced to raise rates instead of cut them, everything will become unpredictable.
4. Four-year cycle has not died
Many analysts believe that Bitcoin's traditional halving cycle remains valid, meaning a peak 12-18 months after halving, followed by an 80% pullback.
The halving in April 2024 will push the cycle peak to around the end of 2025. By this logic, we may already be in the early stages of a bear market, and the $126,000 high in October was the top.
Counterpoint: ETF-driven institutional demand has changed the market structure. Cycles reliant on retail speculation may no longer apply.
But until the final outcome is revealed, we cannot know who is right or wrong.
5. Factors we have not considered
The biggest risks are always those that are unpriced. For example, the threat of quantum computing to Bitcoin's encryption technology; the collapse of major stablecoins; black swan geopolitical events.
Position sizes should always account for unknown unknowns.
Part Seven: Positioning
How to Think About This Issue
I am not a financial advisor. This is not financial advice. But the framework is as follows:
If you already hold Bitcoin:
Today's gold crash does not change Bitcoin's fundamentals
The $80,000 support level is a key level to watch
If you are over-leveraged, today's market reminds you that volatility is two-sided
The rotation theory is promising, but not guaranteed
If you are considering entering the market:
Jumping in just because "gold is crashing, Bitcoin will rise" is not a wise move
Data suggests a rotation may occur, but the timing is uncertain
Dollar-cost averaging is preferable to lump-sum investing during high volatility
Be prepared for a potential pullback to $74,000 to $80,000
If you hold gold/silver:
The market over the past two days has been painful, but it does not negate the logic of long-term investment.
Central banks are still buying.
The fiscal situation continues to deteriorate.
Consider whether your position size matches the current volatility.
From a more macro perspective:
Gold and Bitcoin both bet on the same fundamental logic: the current monetary order is unstable, and hard assets will outperform in the long run.
They are not mutually exclusive. The "gold vs. Bitcoin" narrative mostly stems from tribalism on Twitter. Smart investors will hold both assets simultaneously.
The situation over the past few days indicates that when positions are too crowded, both assets can experience severe volatility. The label of "safe-haven asset" does not protect you from the effects of a cascading liquidation.
Conclusion
Gold has just experienced its worst day in over 40 years. Silver has faced its most severe drop since the Hunt brothers incident.
In a single trading day, the market value of precious metals evaporated by about $3 trillion.
Meanwhile, Bitcoin dropped to $82,000 but did not crash. (As of the time of writing, Bitcoin's price had briefly fallen to around $77,000.)
Data suggests we may be at a turning point. The funds that flowed into the gold market in 2025 now have reason to question the "safe-haven asset" narrative. Some of this capital may shift to Bitcoin following a historical lag pattern, which typically lasts 4-7 months.
But nothing is guaranteed. If the macro situation worsens, Bitcoin may plummet alongside everything else. Gold prices may rebound and resume an upward trend, as the rotation effect may never occur.
What we do know for sure is:
Central banks are still buying gold (863 tons in 2025).
The U.S. debt spiral is rising (with $38 trillion in debt and $1 trillion in interest payments).
The dollar's status as a reserve currency is gradually weakening (reserve share down from 70% to 58%).
The ETF infrastructure for Bitcoin has significantly matured.
Institutional investors remain interested, even with fluctuations in fund flows.
The Federal Reserve is likely to cut rates 2-3 times in 2026.
The current situation is interesting. Catalysts have just emerged. Now we wait to see if this theory holds true.
We will soon know what happens next.
免责声明:本文章仅代表作者个人观点,不代表本平台的立场和观点。本文章仅供信息分享,不构成对任何人的任何投资建议。用户与作者之间的任何争议,与本平台无关。如网页中刊载的文章或图片涉及侵权,请提供相关的权利证明和身份证明发送邮件到support@aicoin.com,本平台相关工作人员将会进行核查。