Original Title: Stress Builds Below Resistance
Original Authors: Chris Beamish, CryptoVizArt, Antoine Colpaert, Glassnode
Original Translation: AididiaoJP, Foresight News
Summary
· Bitcoin prices remain near the key on-chain cost level, with support being tested. The market needs sufficient confidence to avoid further structural weakening.
· The mindset of short-term holders is fragile. If prices do not rebound above the key breakeven line, investors who bought recently may face new selling pressure.
· Overall, holder behavior remains conservative. This indicates that the current market is in a phase of absorbing chips rather than expanding upward.
· Liquidity remains a key variable. Despite decreased participation, prices remain stable. However, for the trend to continue breaking out, subsequent buying is still needed.
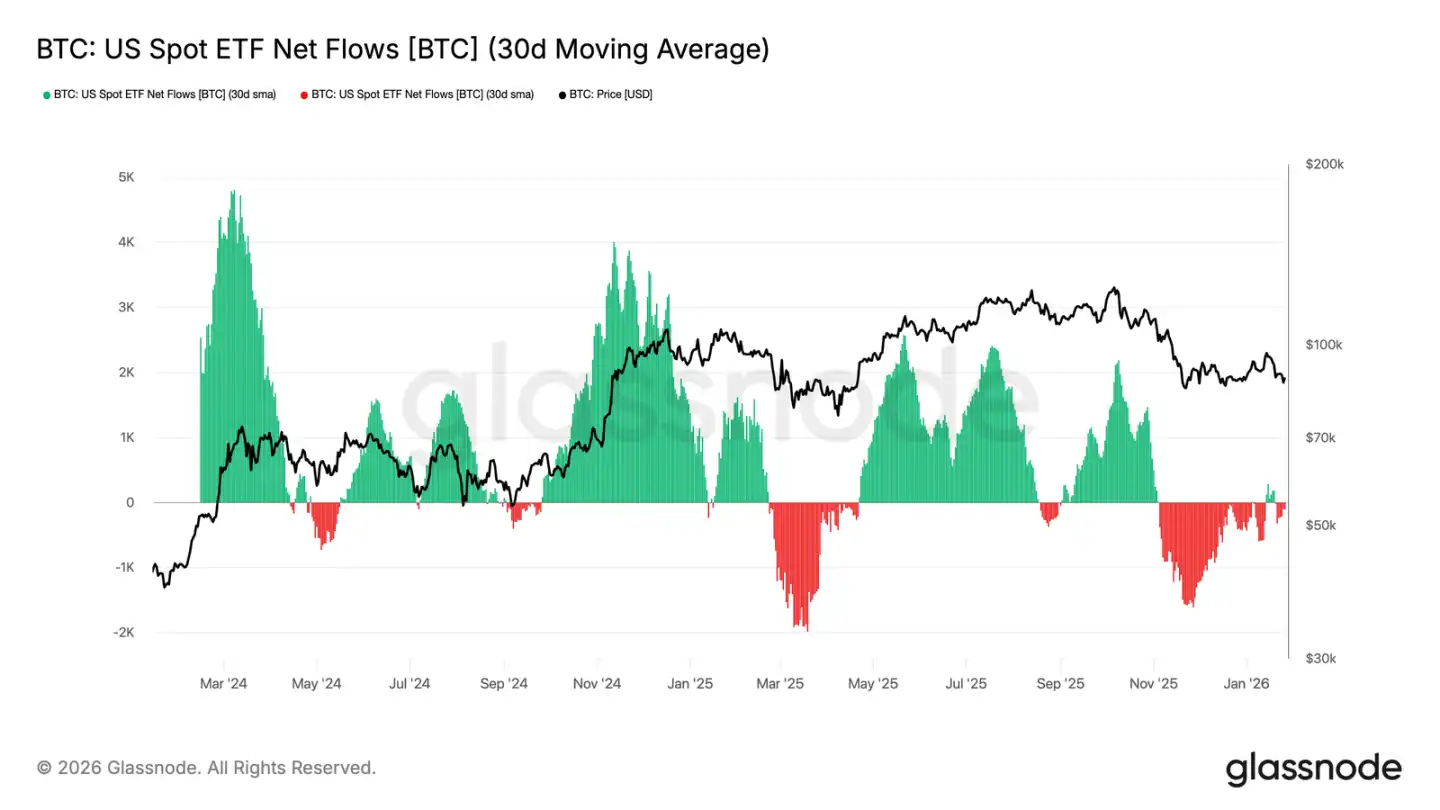
· The fund flow of spot ETFs has stabilized. After a period of continuous outflows, the 30-day average fund flow has returned to near neutral levels, reducing mechanical selling pressure.
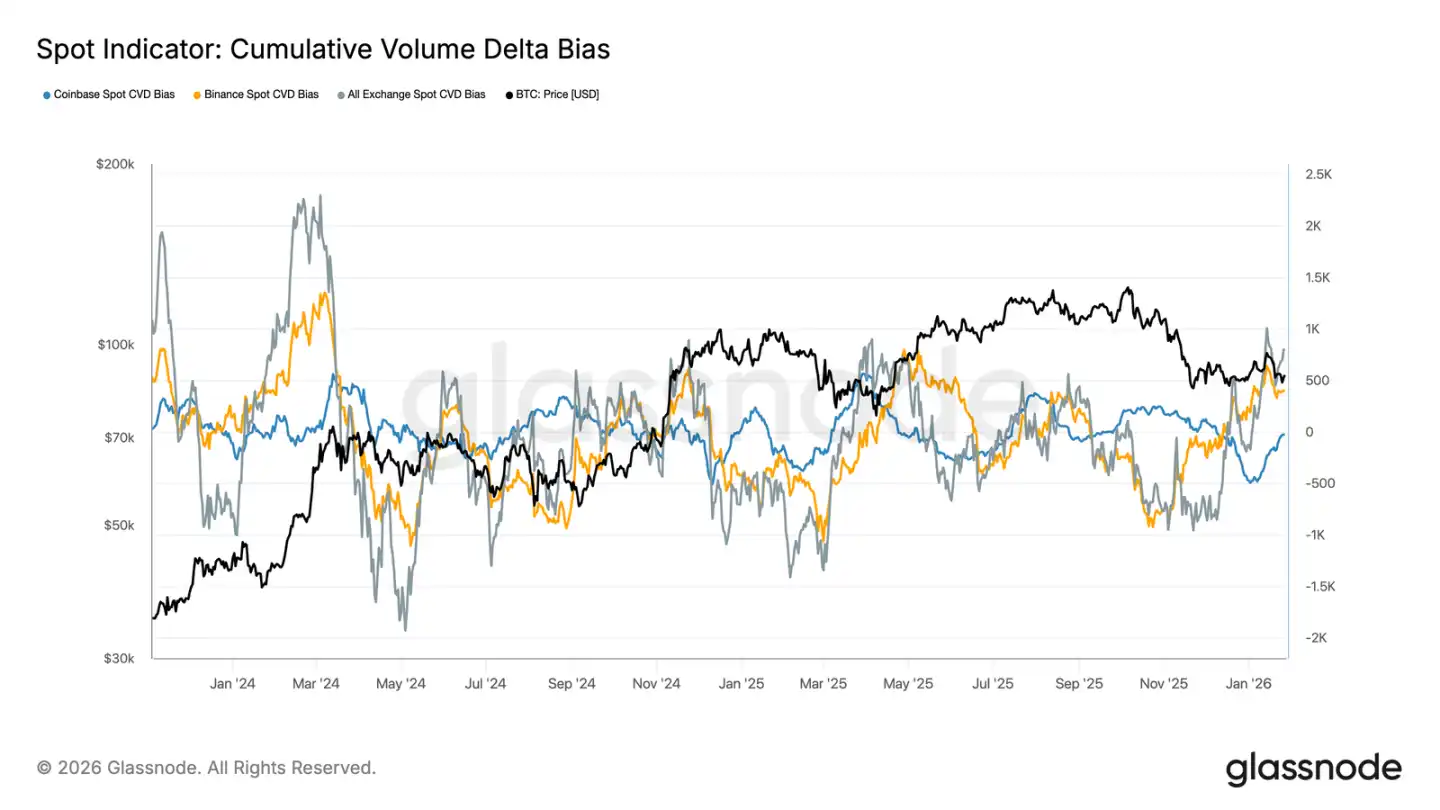
· The spot CVD (Cumulative Volume Delta) across various trading platforms is showing signs of improvement, led by Binance, indicating that marginal buying pressure is returning. Coinbase remains relatively stable.
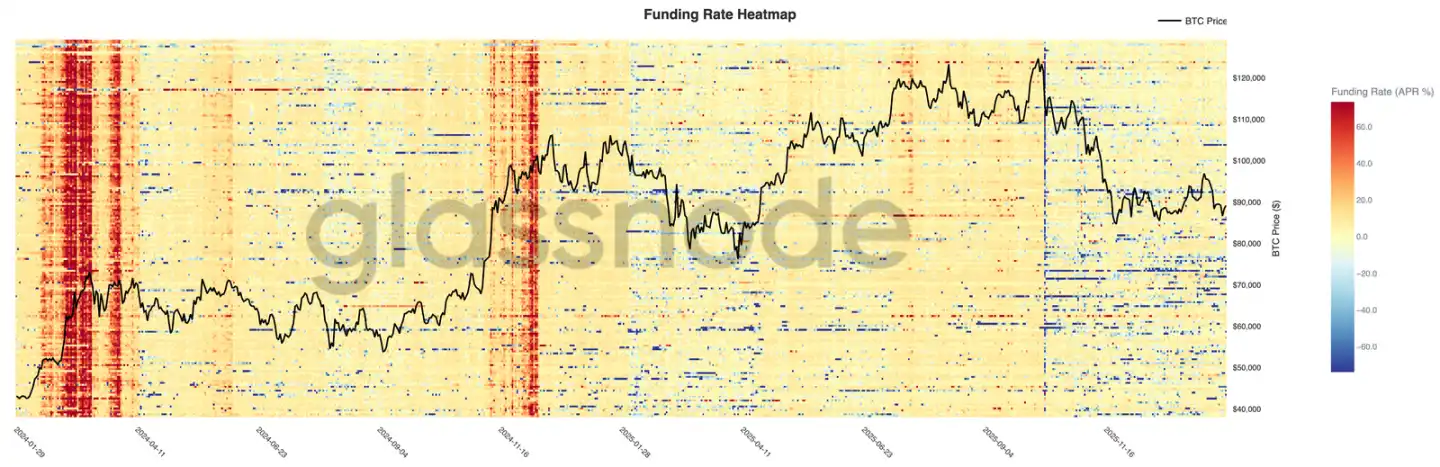
· The leverage level in perpetual futures is still not high, with funding rates being basically neutral. Speculative positions remain cautious and are easily shaken out by volatility.
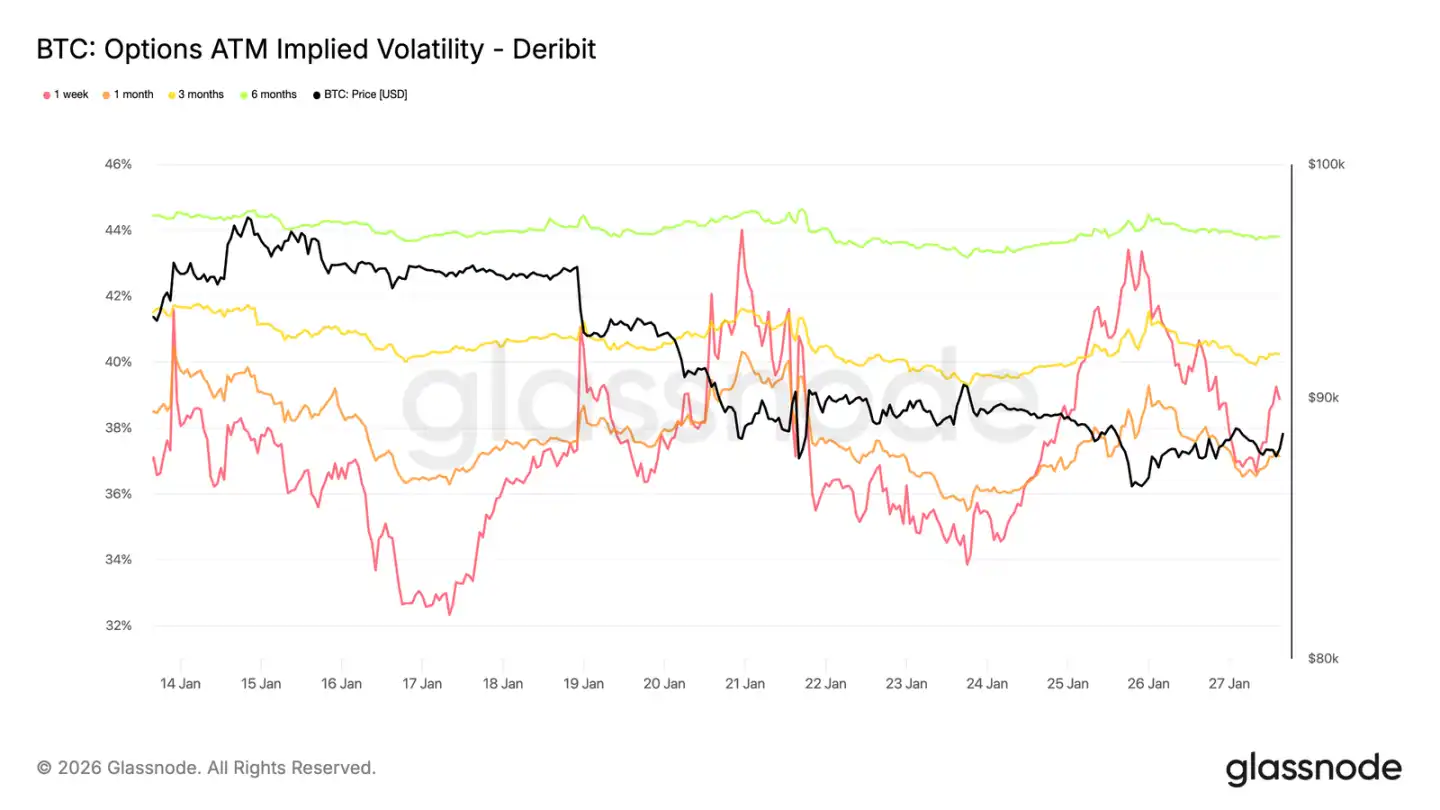
· The options market is shifting towards seeking downside protection: put options are skewed, short-term implied volatility is rising, and traders' Gamma values have turned negative, increasing sensitivity to price declines.
On-Chain Insights
Weakening Again
After spot prices failed to maintain above the cost level of short-term holders, the market has entered a slight correction.
Currently, prices are below the key bull-bear boundary of $96,500, and the market structure is very similar to the situations in Q1 2022 and Q2 2018.
As shown in the chart, the lower bound of the current consolidation range (-1 standard deviation) is at $83,400. This is a key support level; if broken, it could trigger a deeper correction down to the real market mean of $80,700.
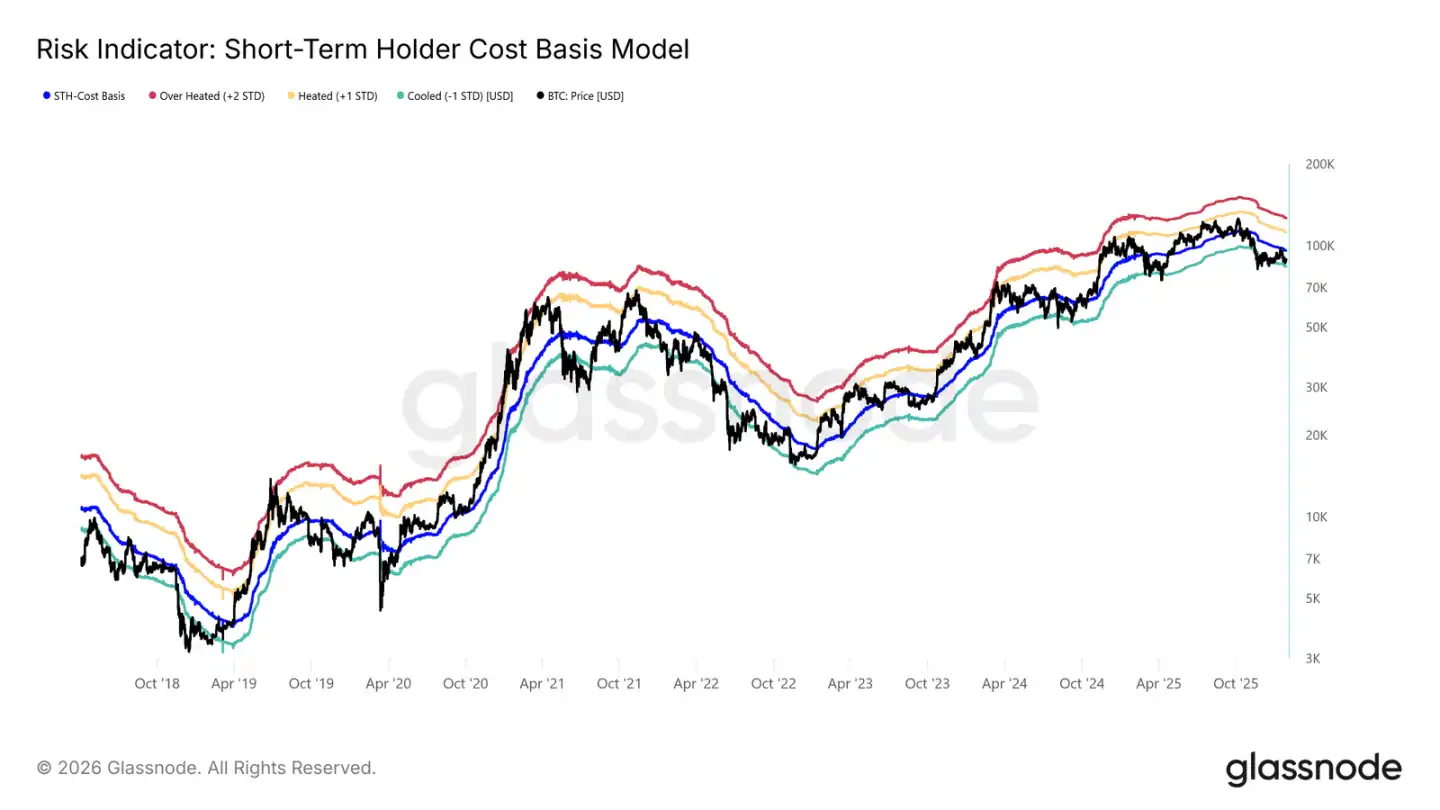
Sensitivity of Support Levels
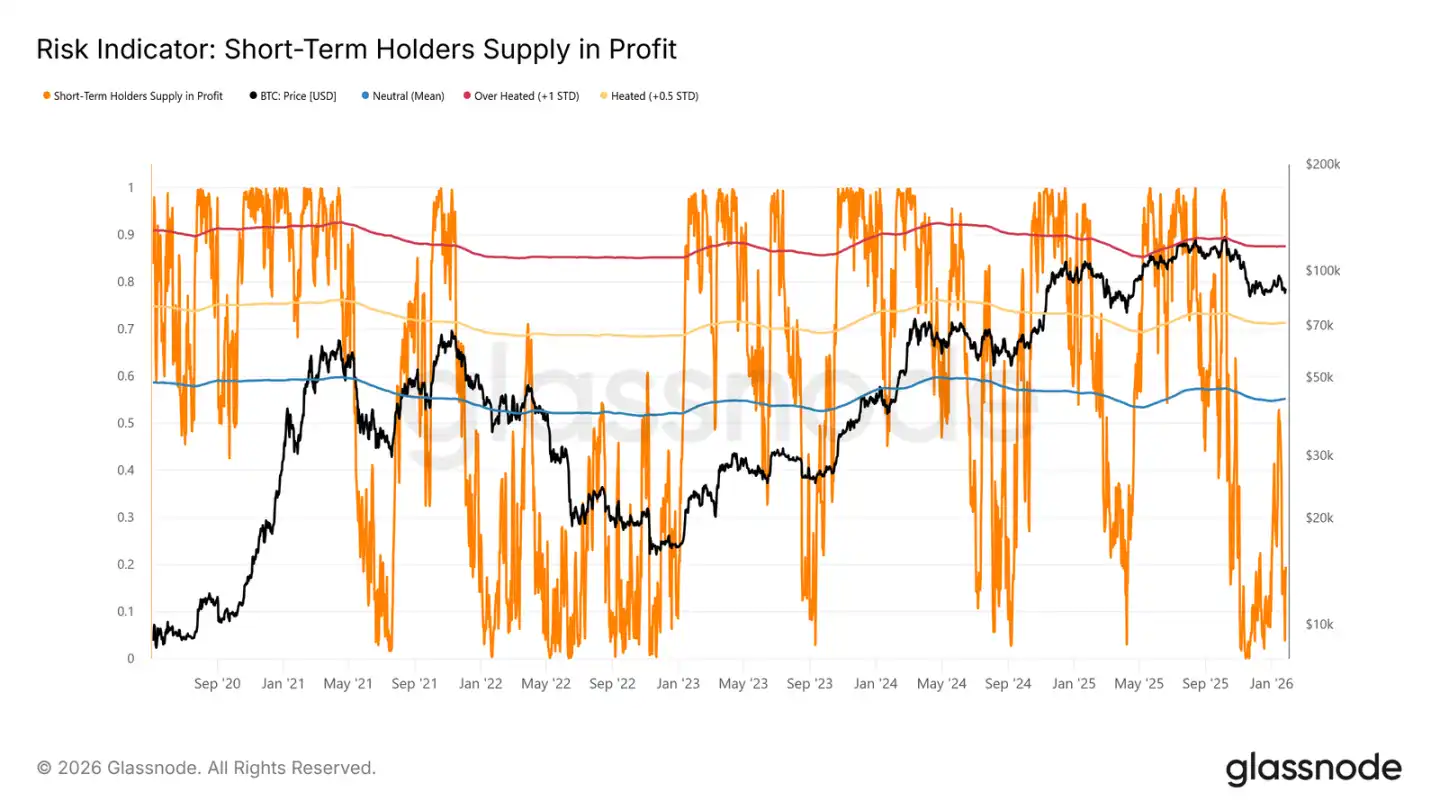
The market's sensitivity to the lower bound of the short-term holder cost and the real market mean is due to the high proportion of losses among recently purchased chips. In this case, historically price-sensitive short-term holders are more likely to sell at a loss, increasing selling pressure.
Therefore, these price levels are the last line of defense to prevent the market from sliding into a deep bear market similar to 2022-2023.
Currently, the proportion of loss-making chips among short-term holders has dropped to 19.5%, far below the neutral threshold of 55%. This indicates that while downside risks still exist, a large-scale panic sell-off among short-term holders has not yet occurred.
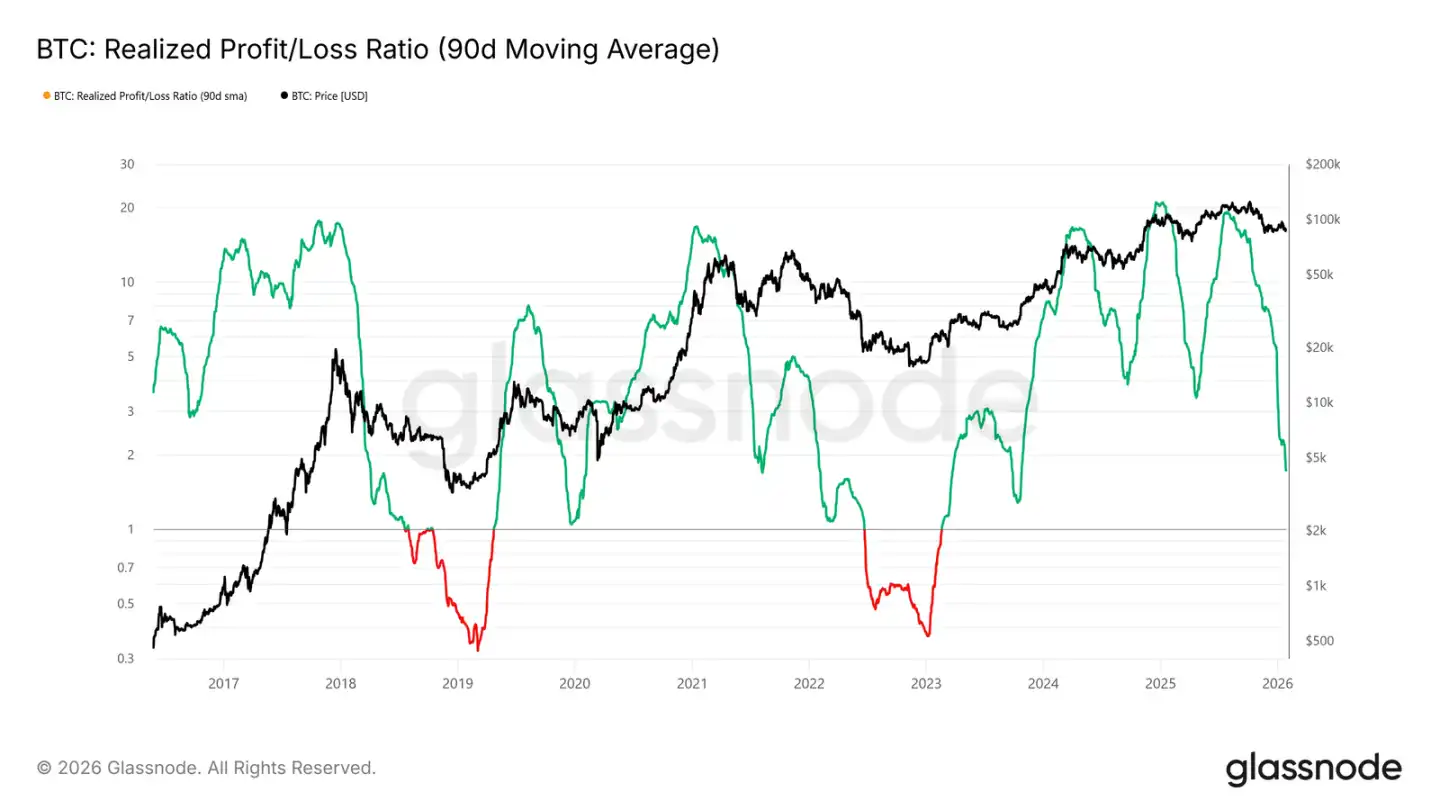
Liquidity is Key
Given the importance of holding the key support zone of $80,700 to $83,400, liquidity conditions have become the current focus. Any substantial shift towards a sustainable rebound should be reflected in liquidity-sensitive indicators, such as the "Realized Profit and Loss Ratio (90-day moving average)."
Historically, strong upward phases, including cyclical rebounds over the past two years, require this indicator to rise and maintain around 5. This marks the re-entry of new funds into the market.
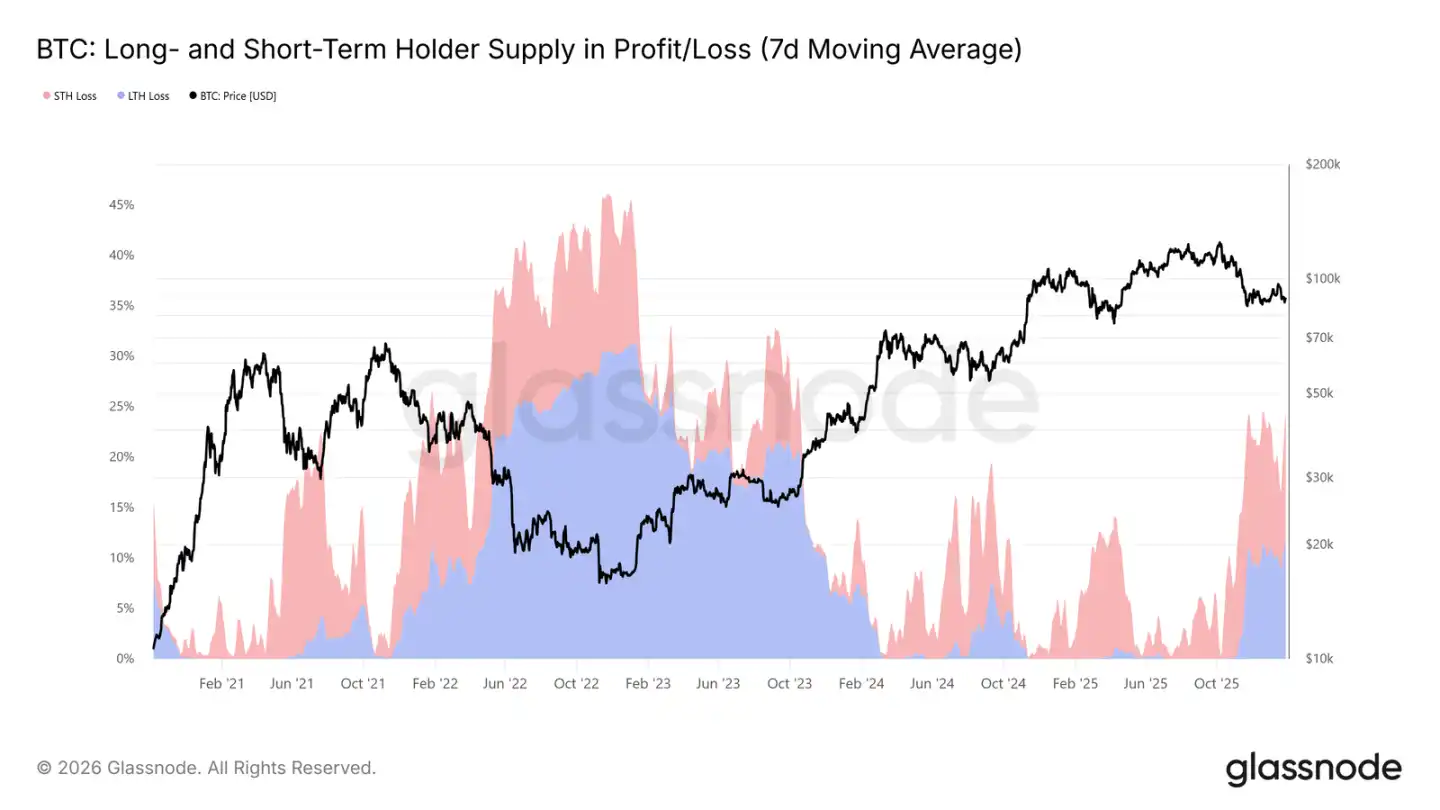
Supply Under Pressure
Another core on-chain indicator affecting the mid-term market structure is the "Profit/Loss Supply of Long/Short-term Holders." This data shows that currently over 22% of the circulating supply is in a loss state, similar to the situations in Q1 2022 and Q2 2018.
As chips bought at the top gradually "settle" into long-term holdings, and investors choose to hold coins bought during previous rallies, the proportion of losses among long-term holders has increased over time.
These steadfast holders are currently under dual pressure from time and price. If prices break below the aforementioned key support levels (the lower bound of short-term holder cost and the real market mean), it may lead long-term holders to also choose to cut losses, increasing mid-term downside risks.
Off-Chain Insights
Spot ETF Outflows Slow
The net fund flow of U.S. spot Bitcoin ETFs has returned to balance. After a prolonged period of net outflows, its 30-day moving average is nearing the zero line. This indicates that the structural selling pressure brought by ETFs has significantly eased.
Notably, the recent rebound in fund inflows is far less vigorous than several accumulation waves at the beginning and end of 2024. This suggests that institutional demand remains cautious rather than aggressively chasing prices. With weakened inflow momentum, BTC prices have still managed to stay in a higher range, seemingly relying more on the confidence of spot holders rather than new demand from ETFs.
If fund flows can return to a sustained net inflow state, it will be beneficial for the continuation of the upward trend. Conversely, if this cannot be achieved, BTC may continue to consolidate due to a lack of external liquidity injections that previously drove the rise.
Spot Fund Flow Improves
The spot CVD across major trading platforms is showing an upward trend, indicating that market buying pressure is beginning to return after a long period of stagnation. Binance is leading the rebound, quickly recovering from deep negative values; the aggregated CVD across all trading platforms has also turned positive.
However, Coinbase's CVD remains fluctuating within a range, indicating that domestic spot demand in the U.S. is relatively stable but not as active as offshore markets. This difference suggests that marginal buying power is returning, but its main driving force is global risk appetite rather than decisive domestic buying in the U.S.
If the dominance of buying pressure can be sustained, it will support prices further stabilizing or even rising. However, in this cycle, the market has repeatedly failed to maintain a positive CVD trend, so whether subsequent buying can continue will be key.
Perpetual Futures Market Remains Calm
The funding rates for perpetual contracts across various trading platforms mostly remain neutral, despite significant price fluctuations. This indicates that leverage has been cleared, and long and short positions are relatively balanced, with neither side continuously paying high funding fees.
Notably, during localized rebounds, there may still be brief peaks in positive funding rates, reflecting temporary bullish chasing behavior. However, these peaks have not been sustained, confirming the view that speculative sentiment is weak and easily dissipated.
With funding rates compressed and uneven, the market is increasingly relying on spot demand to drive trends. If funding rates can remain positive, it indicates a rebuilding of leverage and a return of risk appetite; if they remain neutral, it suggests the market may enter a slow and volatile consolidation phase.
Implied Volatility: Short-term Rising, Long-term Stable
Last weekend, short-term at-the-money implied volatility surged, reflecting the market's heightened sensitivity to the overall risk environment in the short term (rather than just cryptocurrencies themselves).
This change coincided with rising geopolitical uncertainties and increasing macro risks, which typically first affect the near end of the volatility curve. The repricing of volatility is mainly concentrated in short-term options, while long-term option volatility remains relatively stable.
This indicates that the market is reassessing short-term uncertainties rather than changing long-term risk expectations, responding to external risks without signs of internal pressure or structural imbalance.
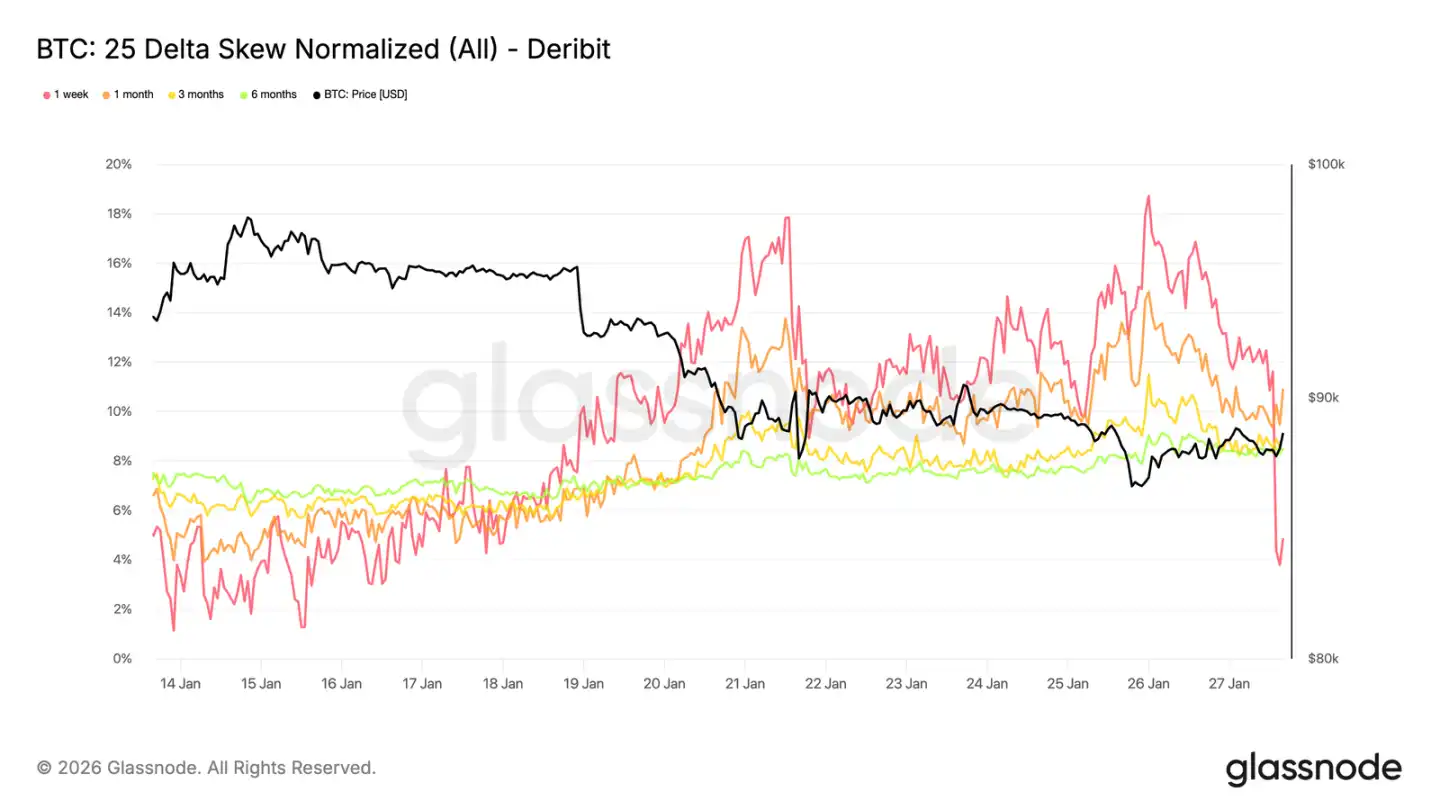
25 Delta Skew: Bearish Sentiment Spreads
As volatility adjusts, the skew can more clearly reflect market sentiment. The 25 Delta skew across all maturities has turned bearish, indicating an increased demand for downside protection.
This shift means that the market's outlook for the medium to long term is becoming cautious, even though spot price movements remain orderly. The adjustment is gradual, indicating planned hedging behavior rather than panic buying of put options.
Short-term skew (especially for one-month maturities) is more volatile, while the overall curve is slightly bearish compared to last week. This difference shows that the market expresses caution across various time frames but has not fallen into extreme tension.
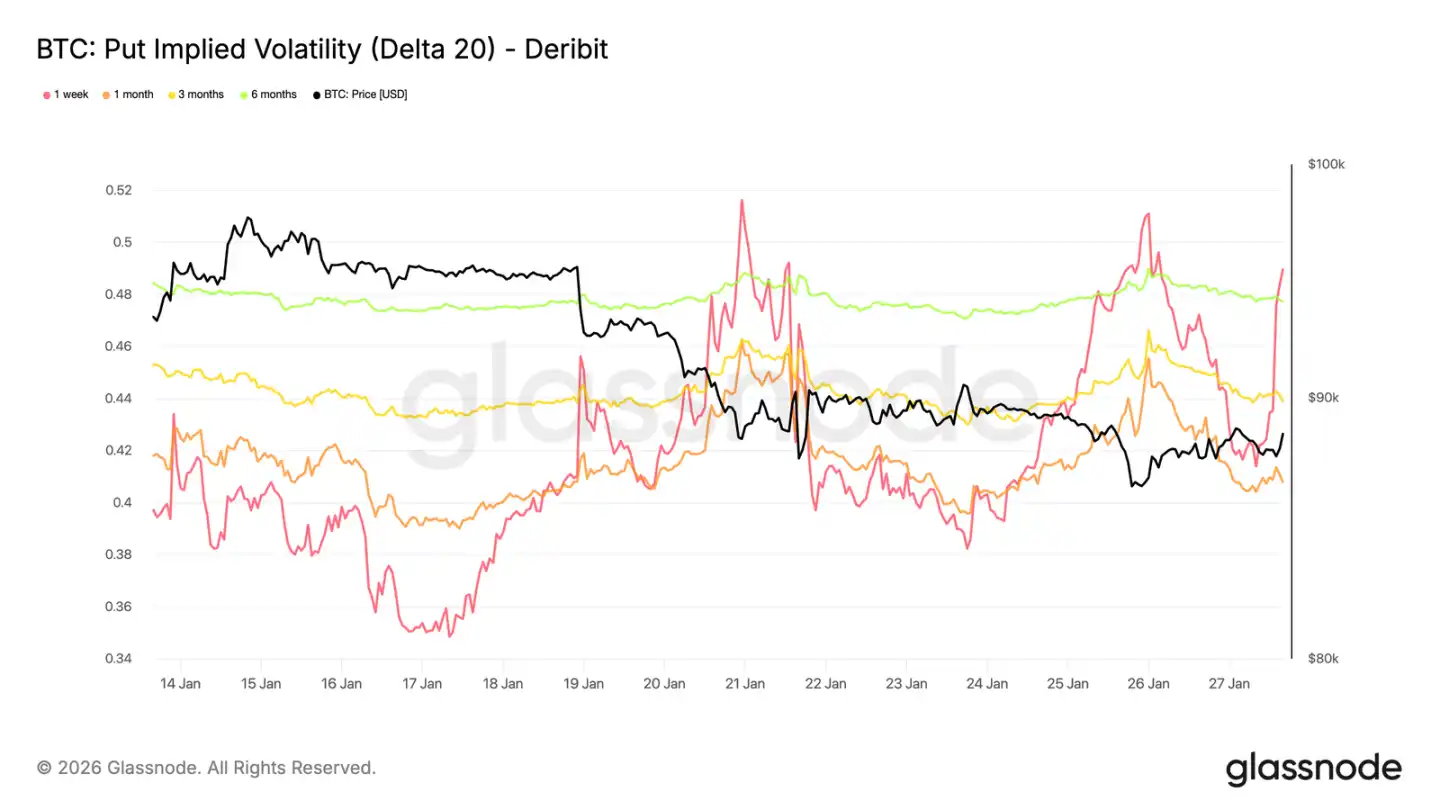
Downside Implied Volatility: Protection Present, but No Pricing for Collapse
By interpolating specific delta implied volatility, we can smooth the observation of the volatility surface across various maturities. Here, we focus on the 20 delta put options, which clearly reflect the demand for long-term downside protection.
Despite the skew being bearish, the downside implied volatility across all maturities remains relatively mild. Even when looking at options expiring by the end of 2026, the market only prices in a slight possibility of a decline.
This reveals an important detail: participants are willing to pay a higher premium for downside protection than for call options, but do not expect a severe drop. Market sentiment is clearly defensive, but expectations for the magnitude of the decline remain limited.
This aligns with the recent characteristics of the spot market, which has shown "orderly declines rather than panic selling."
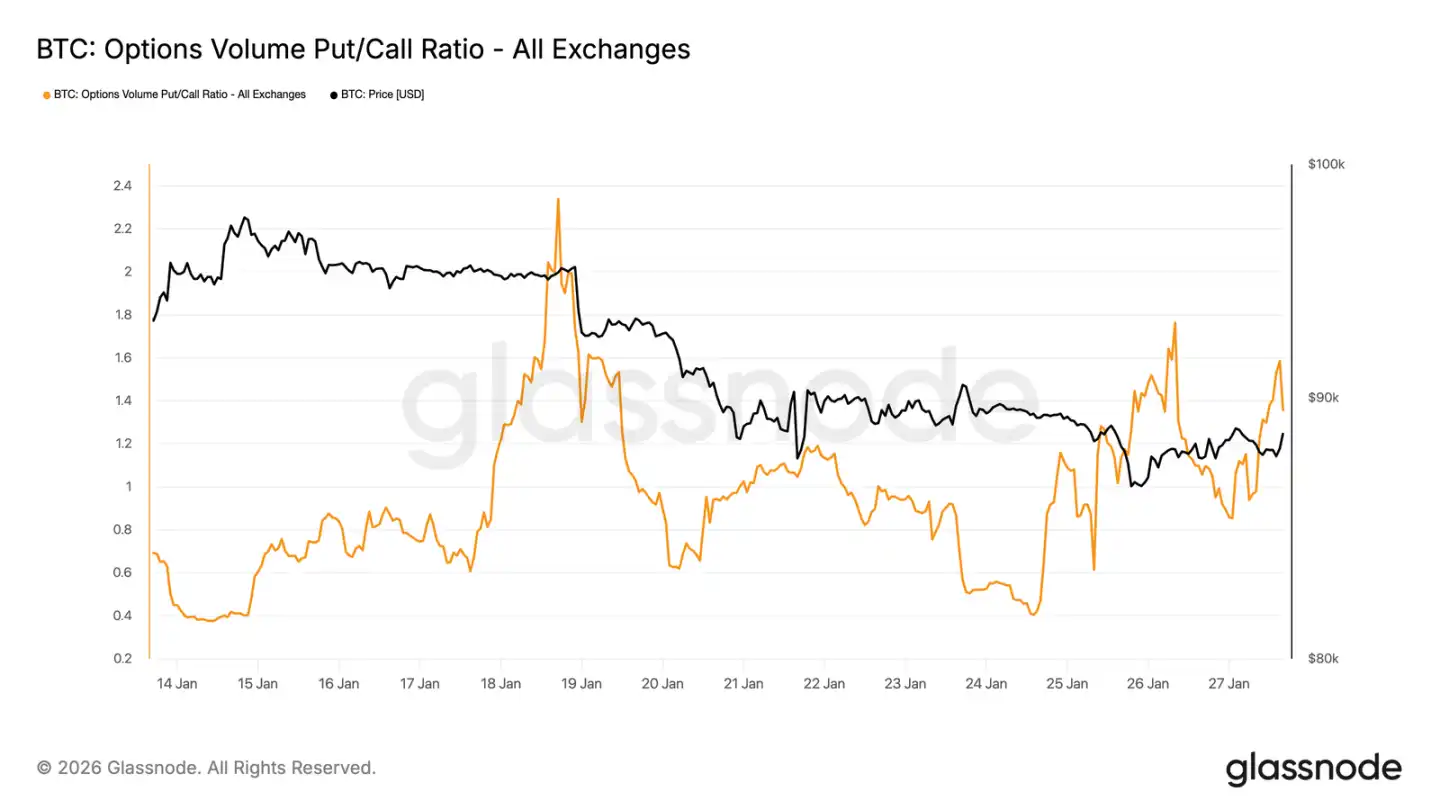
Put Option Trading Volume Leads
In terms of trading volume, the put/call ratio in the options market also confirms this defensive posture. The trading volume of put options has increased relative to call options, but there has not been a surge in volume typically associated with panic hedging.
The trading volume is active yet orderly, indicating that traders are gradually adjusting their positions rather than emotionally chasing prices. This aligns with the market's acknowledgment of downside risks while cautiously moving downward in a controlled manner.
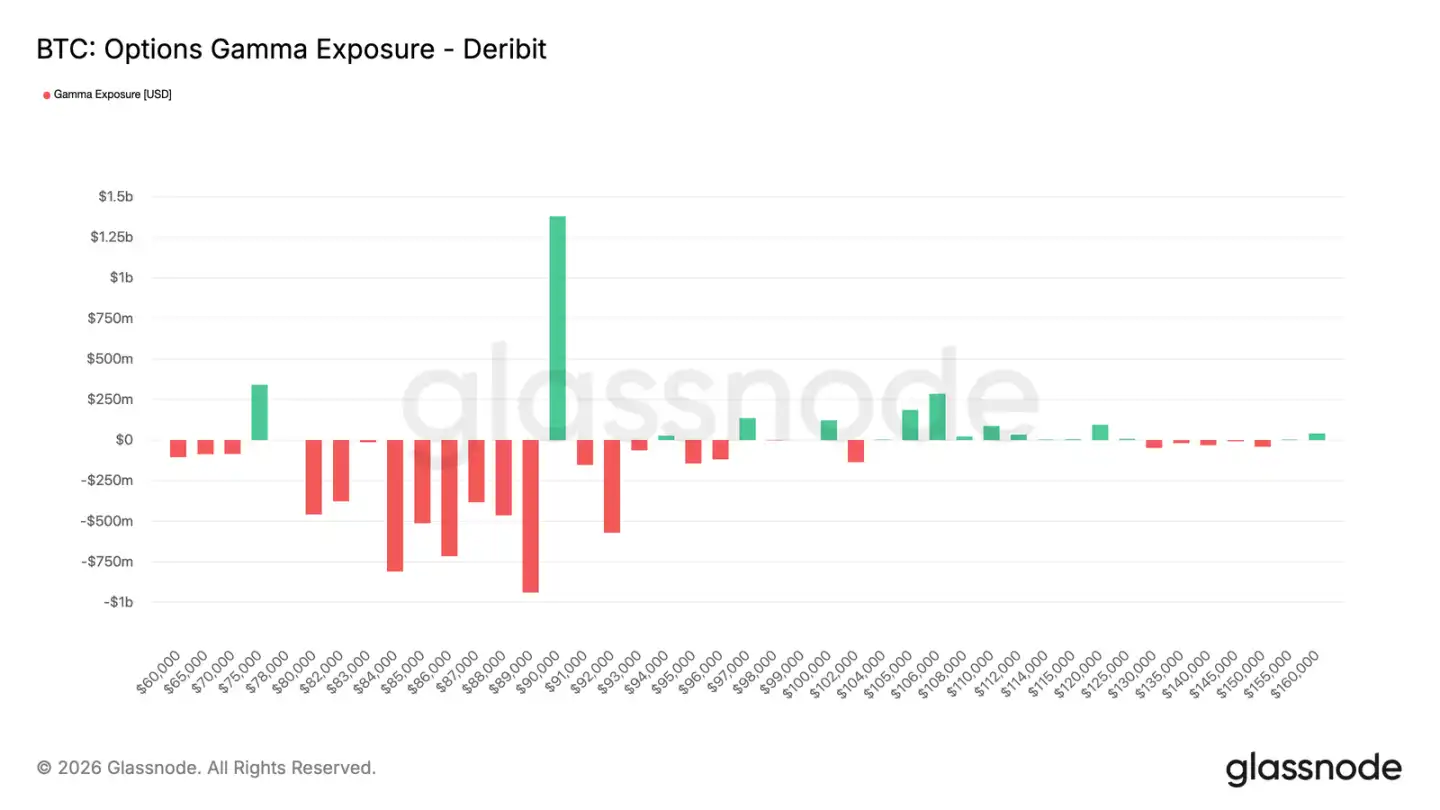
Trader Gamma: Below $90,000 Favors Downside
Trader Gamma exposure reveals an important structural characteristic of the current market. Traders hold short Gamma in a broad range from $90,000 down to about $75,000. This range is precisely an important support zone.
In a short Gamma environment, traders' hedging behavior amplifies price volatility. When spot prices decline, traders sell futures or spot to hedge their short put option risks, mechanically exacerbating the downward momentum. This explains why corrections may deepen even without significant selling pressure.
At the same time, there remains a significant concentration of long Gamma near the $90,000 mark. This means that to break above this price level, sustained and strong buying is required, rather than sporadic purchases.
Before the aforementioned conditions arise, the market structure is more conducive to a slow, controlled decline in prices rather than a rapid reversal.
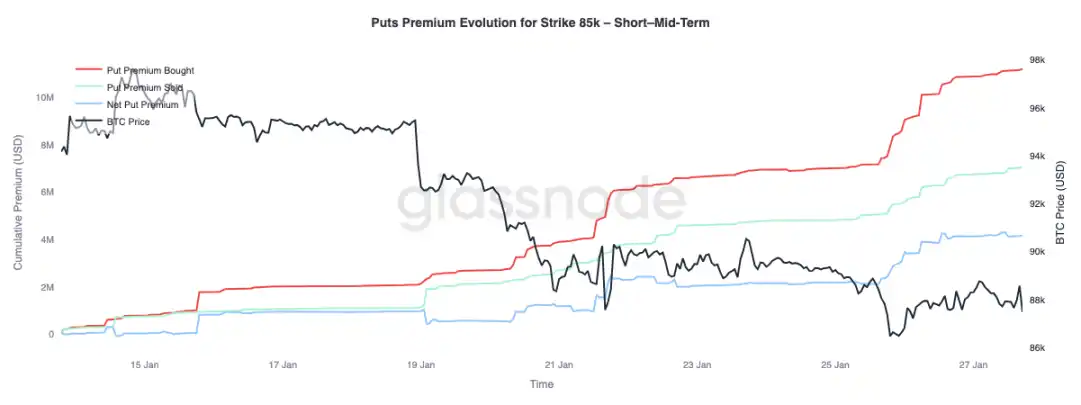
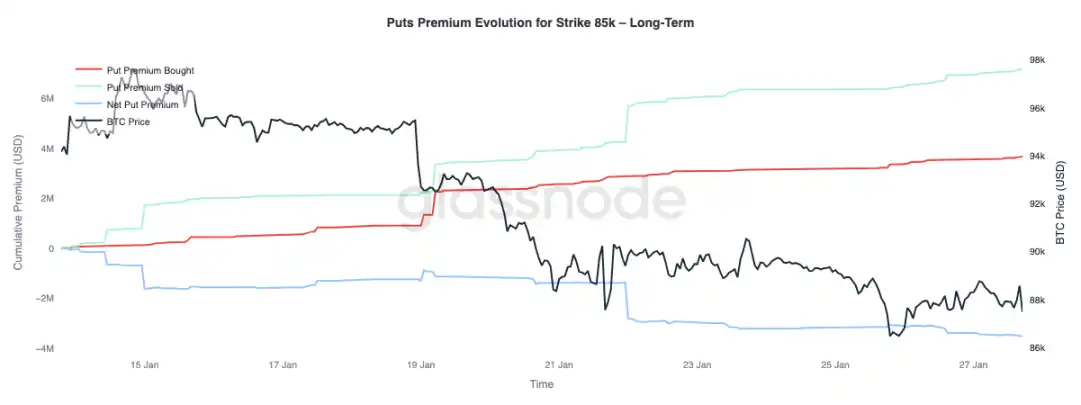
Put Option Premiums: Buy Short-term, Sell Long-term
Focusing on the changes in put option premiums with a strike price of $85,000 reveals a divergence in terms: short-term options with maturities of less than three months dominate net premium purchases, driving net premiums higher; while long-term options with maturities of over three months show net premium sales.
This reflects the market's response to Bitcoin's drop from the $90,000 median range to the high $80,000 range: hedging against short-term downside risks while simultaneously willing to sell long-term downside protection. This structure indicates that the market is only cautiously short-term, with long-term risk expectations not having deteriorated.
Conclusion
Bitcoin continues to consolidate near key on-chain price levels, with a delicate balance between holder confidence and marginal demand. The state of short-term holders remains fragile, and if support levels are breached, it could lead to a new round of selling.
However, overall fund flows have stabilized: ETF selling pressure has eased, and there are initial signs of improvement in spot market positions (especially in offshore markets), indicating a revival of buying interest. At the same time, the derivatives market is showing restraint, with neutral funding rates suggesting lower market leverage and reduced dependence on speculative funds for price movements.
Options positions reinforce the market's cautious attitude: the skew has turned bearish, short-term protection demand has risen, and the negative shift in trader Gamma increases the risk of heightened price volatility.
The future direction depends on whether demand from spot and ETF channels can be sustained. If fund flows can return to a sustained net inflow and spot buying strengthens, it will support the continuation of the trend; conversely, if market vulnerabilities persist and downside hedging demand rises, further consolidation or a deeper correction may be faced.
免责声明:本文章仅代表作者个人观点,不代表本平台的立场和观点。本文章仅供信息分享,不构成对任何人的任何投资建议。用户与作者之间的任何争议,与本平台无关。如网页中刊载的文章或图片涉及侵权,请提供相关的权利证明和身份证明发送邮件到support@aicoin.com,本平台相关工作人员将会进行核查。


