Author: San, Deep Tide TechFlow
Since the approval of the spot ETFs for BTC and ETH, the daily inflow and outflow of ETF funds have become a core indicator for many traders' orders.
The logic is simple: net inflow indicates institutional buying and bullish sentiment; net outflow indicates institutional selling and bearish sentiment.
However, the problem is that the ETF data we see every day reflects the results from the previous day.
By the time the data is released, the price has often already reacted.
So, is there any way to predict whether today's ETF will show net inflow or net outflow?
Yes, the answer is the ETF premium rate.
Verifying this pattern is not difficult; looking back at the soon-to-end January 2026 is the best sample.
As of January 28, there were 18 trading days in the U.S. stock market.
According to statistics, the premium index on Coinbase only remained in positive territory for two days, while the other 16 days were all in negative premium territory.
Correspondingly, the ETF fund flow shows that out of these 16 days, 11 days ultimately recorded net outflow.
Especially from January 16 to 23, the negative premium rate continuously fell below -0.15%, which corresponded to over $1.3 billion in net outflow from the ETF market in a single week, and the price of BTC dropped from a high of $97,000 to around $88,000.
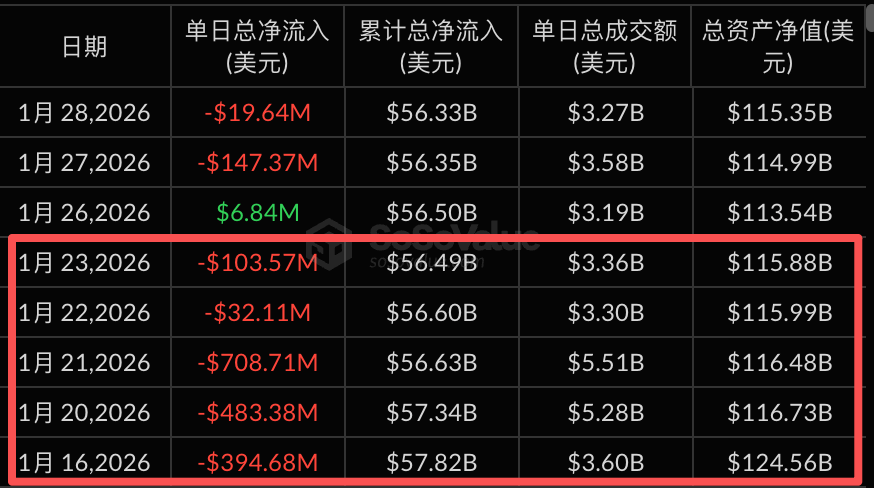
Data source: sosovalue
Let’s take a longer view.
From July 1, 2025, to January 28, 2026, there were a total of 146 trading days.
- Negative premium rates appeared for 48 days, corresponding to net outflow for 39 days, with an accuracy of 81%.
- Positive premium rates appeared for 98 days, corresponding to net inflow for 82 days, with an accuracy of 84%.
This is the value of the premium rate, allowing you to see where the funds are moving earlier than most.
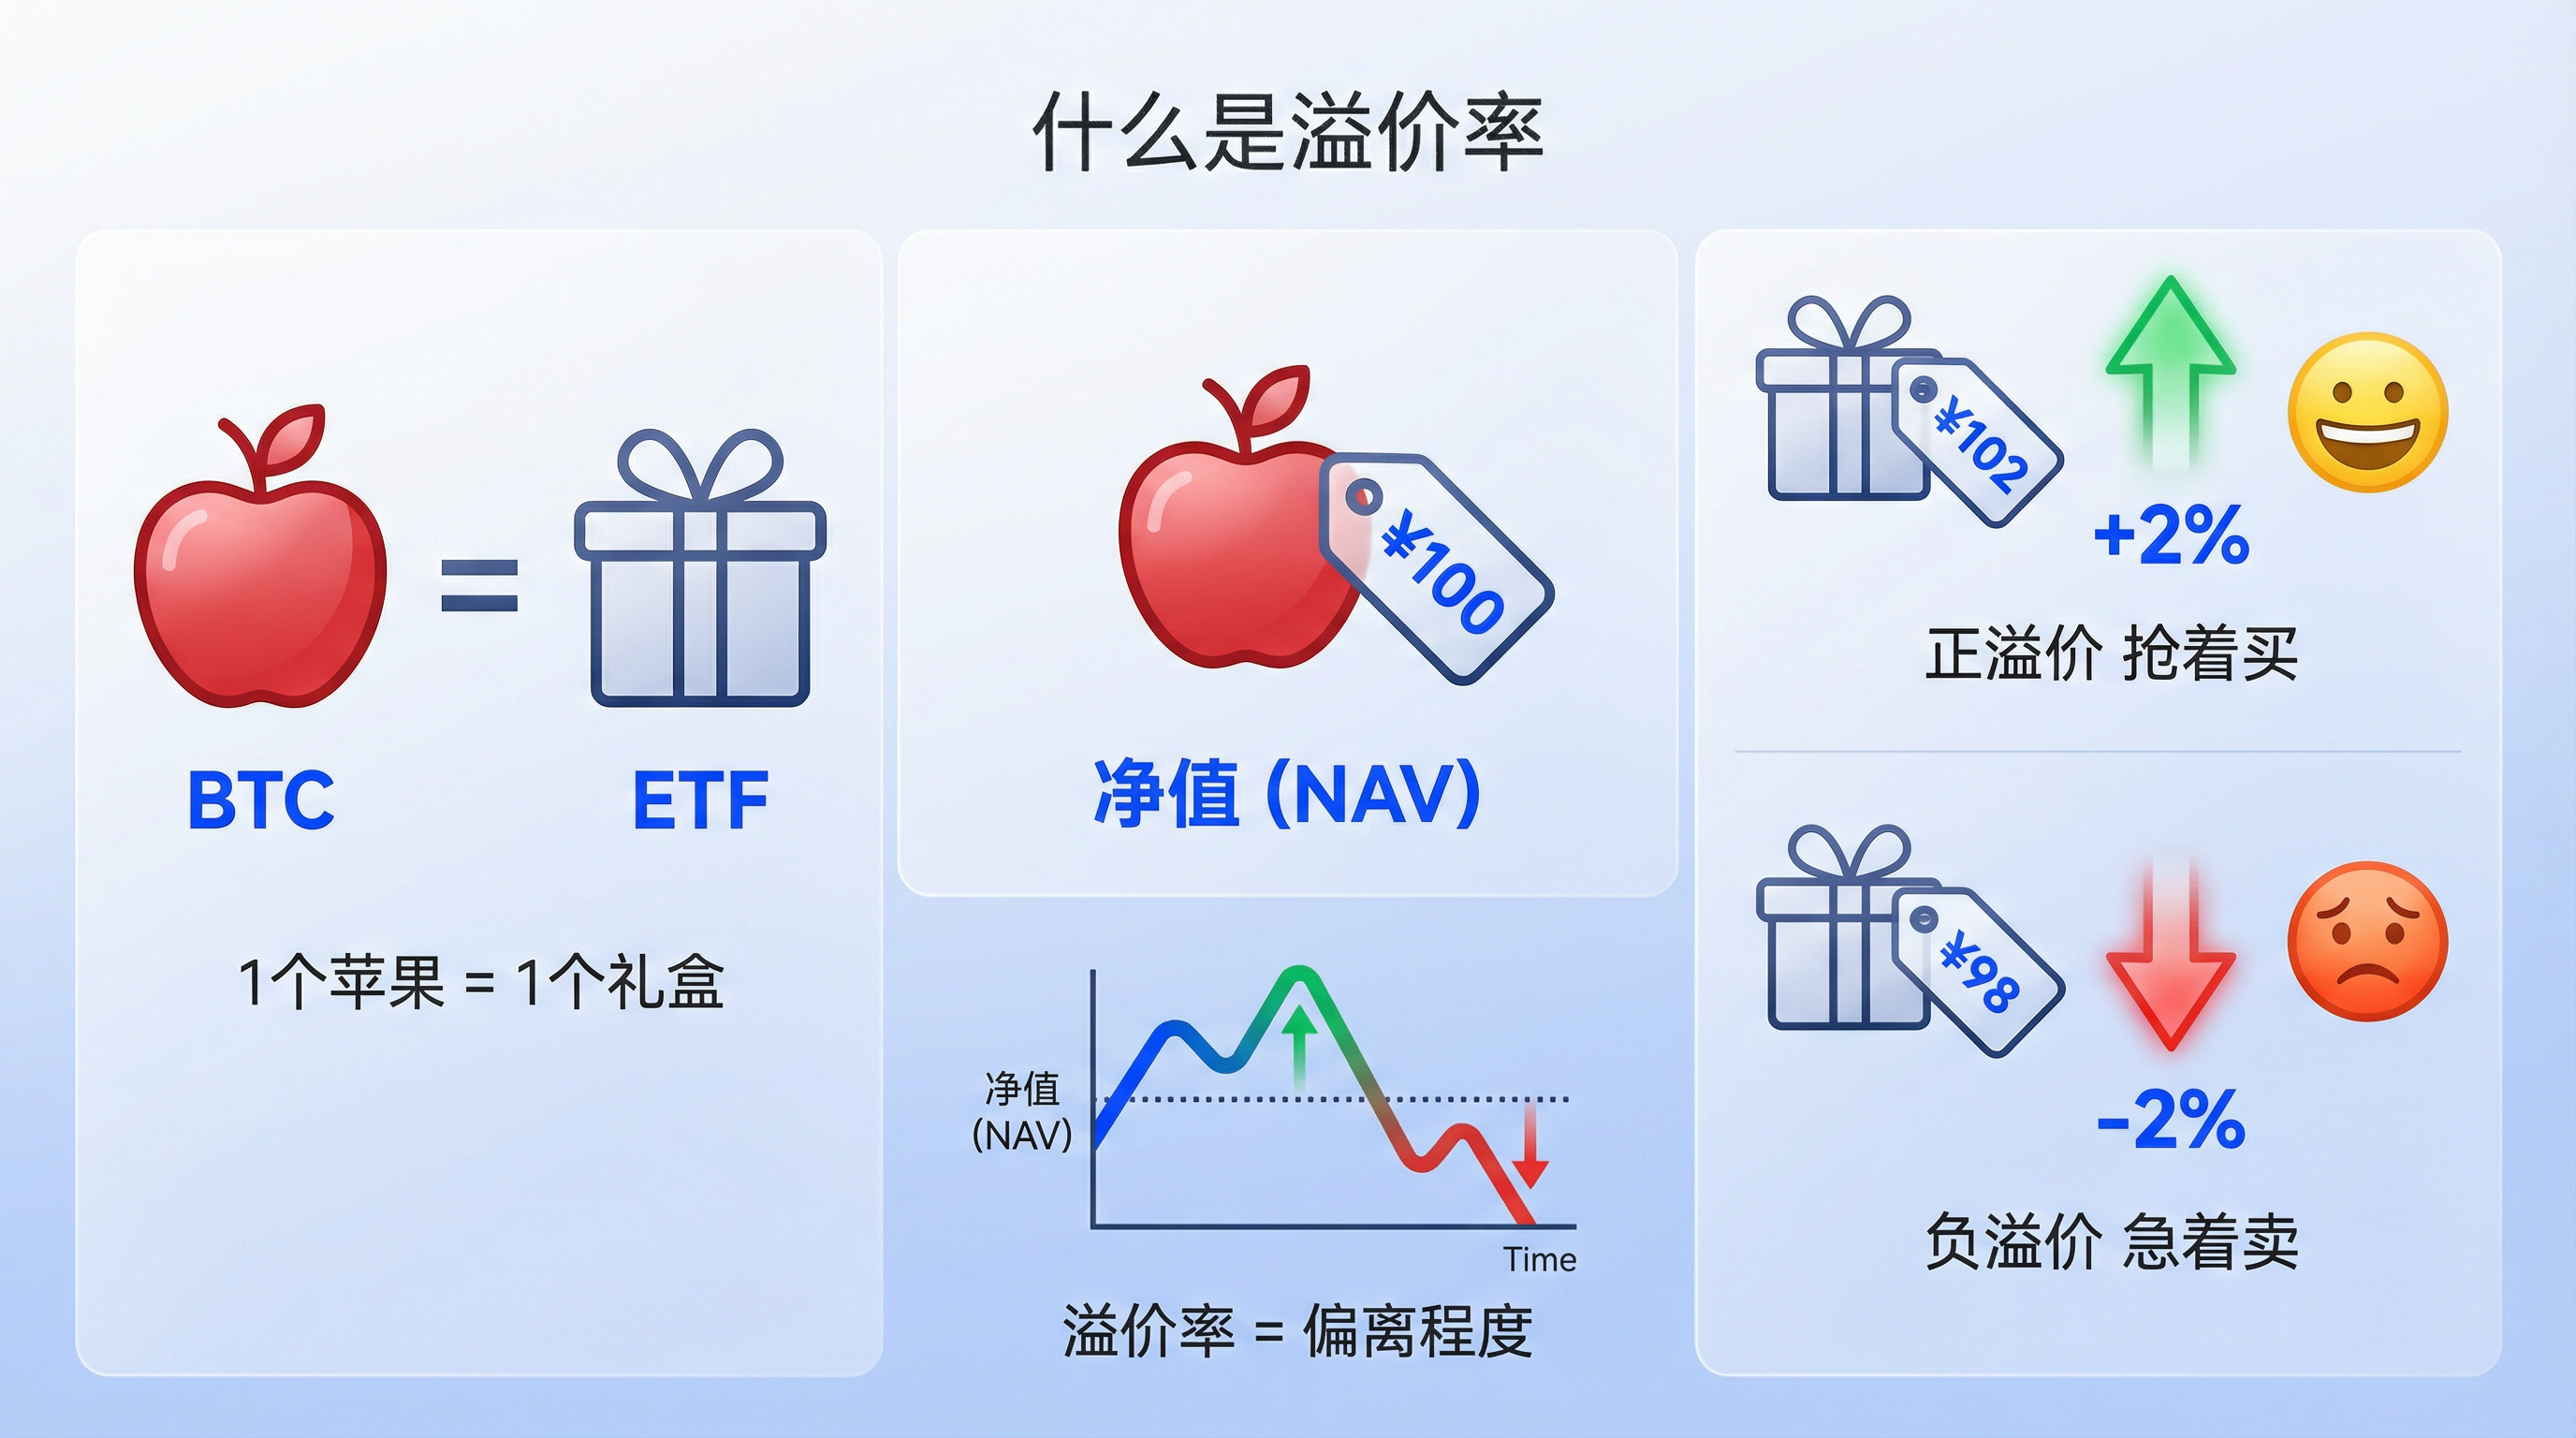
What is the Premium Rate?
After discussing the premium rate, what exactly is it?
To put it simply.
BTC is like bulk apples at a market, while the BTC spot ETF is like a packaged apple gift box at a supermarket, with each gift box containing one apple.
An apple sells for 100 yuan at the market, which is the net asset value (NAV).
The price of the apple gift box at the supermarket depends on supply and demand.
If many people are buying, the gift box is driven up to 102 yuan, which is a positive premium rate, +2%.
If many people are selling, the gift box drops to 98 yuan, which is a negative premium rate, -2%.
The premium rate reflects the degree to which the ETF market price deviates from the true price of BTC.
A positive premium indicates optimistic market sentiment, with everyone rushing to buy.
A negative premium indicates pessimistic market sentiment, with everyone eager to sell.
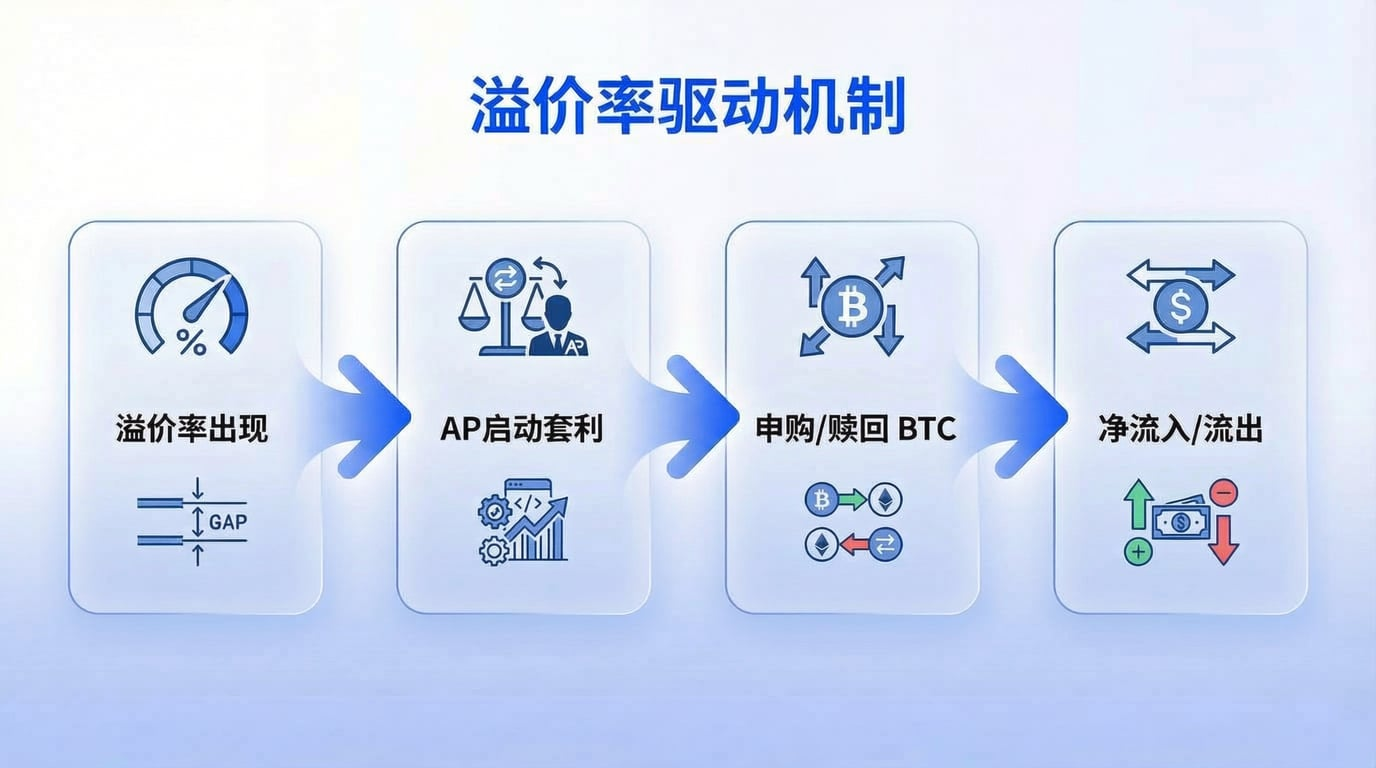
The Relationship Between Premium Rate and ETF Inflows/Outflows
The premium rate is not just a market sentiment indicator; it can also become a key factor driving fund flows.
The key role here is played by AP, or Authorized Participants, who can be understood as privileged movers.
The core logic of AP is risk-free arbitrage: they can subscribe to and redeem ETF shares in the primary market, as well as buy and sell in the secondary market.
Whenever there is a price difference, they will engage in arbitrage.
When a positive premium rate appears, the gift box is more expensive than the apples. AP will buy BTC in the primary market, package it into ETF shares, and then sell it in the secondary market to profit from the price difference. In this process, BTC is bought, resulting in net inflow of funds.
Conversely, when a negative premium rate appears, the gift box is cheaper than the apples. AP will buy ETF shares in the secondary market, unwrap them to redeem for BTC, and then sell the BTC to profit from the price difference. In this process, BTC is sold, resulting in net outflow of funds.
So the logical chain is as follows:
Premium rate appears → AP initiates arbitrage → Generates subscriptions or redemptions → Forms net inflow or net outflow.
The ETF fund data we see every day is published the day after settlement.
The premium rate is real-time, while the fund data is lagging.
This is why the premium rate can give you an early insight compared to the market.
How to Apply the Premium Rate
Now that we understand the principle of the premium rate and its relationship with ETF net inflows and outflows, how should we apply it to our individual trading plans?
First, the premium rate is not an indicator to be used in isolation.
It can indicate the direction of funds but cannot tell us the magnitude or sustainability.
Here, I suggest looking at it in conjunction with the following dimensions.
1. The Sustainability of the Premium Rate is More Important than Single-Day Values
A single day of negative premium rate may just be a short-term fluctuation.
However, if there are multiple consecutive days of negative premium rate, it is likely to correspond to continuous net outflow, which is worth being cautious about.
Looking back at the continuous negative premium rates from January 16 to 23 this year, they corresponded to five days of net outflow, and BTC dropped nearly 10%.
2. Pay Attention to Extreme Values of the Premium Rate
Generally, a premium rate fluctuating within ±0.5% is normal.
Once it breaks ±1%, it indicates a significant deviation in market sentiment, and the arbitrage motivation for AP becomes stronger, accelerating fund flows.
3. Combine with Price Positioning for Judgment
A sustained negative premium rate at high levels may be an early signal of capital fleeing.
A sustained positive premium rate at low levels may indicate signs of bottom-fishing capital entering the market.
The premium rate itself does not constitute a basis for buying or selling, but it can help you validate the current trend or identify potential turning points in advance.
In Conclusion
Finally, there are a few reminders to keep in mind.
No indicator is a holy grail; the effectiveness of the premium rate is based on the normal operation of the AP arbitrage mechanism.
In extreme market conditions, such as the crash on October 11, market liquidity may dry up, and the arbitrage mechanism may fail, reducing the correlation between the premium rate and fund flows.
Additionally, the premium rate is just one window for observing ETF fund movements.
For mature investors, the premium rate is just one piece of the puzzle.
It is recommended to combine the following indicators for multi-dimensional cross-validation:
- Changes in ETF Holdings: An increase in holdings indicates institutions are accumulating positions, while a decrease indicates they are reducing positions. This is more direct than the premium rate, but the data updates are delayed.
- Futures Basis and Funding Rates: A positive basis and a continuously rising funding rate indicate that bullish sentiment is overheated, and the market may be overly optimistic. Conversely, a negative basis indicates a bearish advantage.
- Put/Call Ratio in the Options Market: A rising ratio indicates increasing market hedging sentiment, while a falling ratio indicates dominant optimistic sentiment.
- Large On-chain Transfers and Exchange Net Inflows: Large BTC transfers into exchanges usually indicate impending selling pressure. Large transfers out of exchanges indicate someone is hoarding coins.
For example.
When you observe: a continuous negative premium rate, a decrease in ETF holdings, and an increase in exchange net inflows.
All three signals point in the same direction: funds are withdrawing, and selling pressure is accumulating.
At this point, you should at least be cautious and control your position, rather than trying to bottom-fish.
A single indicator cannot provide a complete picture; multi-dimensional cross-validation can improve the accuracy of your judgments.
In this market, the more dimensions you observe, the smaller the information gap, but the time gap always exists.
Whoever sees the direction of funds first gains an advantage.
免责声明:本文章仅代表作者个人观点,不代表本平台的立场和观点。本文章仅供信息分享,不构成对任何人的任何投资建议。用户与作者之间的任何争议,与本平台无关。如网页中刊载的文章或图片涉及侵权,请提供相关的权利证明和身份证明发送邮件到support@aicoin.com,本平台相关工作人员将会进行核查。


