Digital Asset Treasury (DAT) models are continuously gaining popularity and evolving among global publicly listed companies, especially after experiencing a market correction in Q4 2025. The sustainability of this business model during a downturn has become a focal point of market attention. This article systematically dissects the operational mechanisms of DAT enterprises based on the market environment at the beginning of 2026, focusing on the dual dimensions of "financing structure × underlying currency" to deeply analyze the effectiveness boundaries and potential risks of the DAT enterprise's "Reflexive Flywheel."
The research indicates that the DAT model is essentially an active management of the balance sheet, with value creation stemming from the synergy between asset-side returns (β) and capital-side operations (α). In terms of financing structure, the article demonstrates the high dependency of equity financing (such as ATM, PIPE) as the core driving force of the flywheel on valuation premiums (mNAV), as well as the introduction of maturity mismatch risks by debt financing (such as convertible bonds) as a secondary source of funds while providing leverage efficiency. In terms of currency selection, the article compares and analyzes Bitcoin (BTC) for its financing resilience due to strong consensus, Ethereum (ETH) for its compliance and transparency challenges after adding yield attributes, and small-cap currencies that achieve "coin-stock linkage" through SPAC channels for aggressive liquidity transmission mechanisms.
Combining cases such as Strategy (formerly MicroStrategy), Core Scientific, and MARA, this article proposes a sustainability assessment framework centered on "premium window—cash buffer—debt terms" and provides four trend judgments: First, the industry has currently entered a cross-cycle survival phase, where the key contradiction lies not in the book value retracement but in the liquidity pressure brought by the company's refinancing ability under a shrinking financing window and the triggering of debt terms; Second, the valuation logic will shift from "channel premium" to "capability pricing," and after the popularization of compliant allocation tools like spot ETFs, the financing premium for DAT enterprises will become scarcer and shorter-lived, with long-term differentiation in mNAV among companies; Third, differences in underlying assets will further amplify corporate differentiation, with BTC-DAT more easily forming a financing anchor but being more sensitive to financing rhythm, while the upper limit of ETH-DAT depends on whether it can continuously disclose sources of income, risk boundaries, and form verifiable governance and execution records; Fourth, DAT as a capital market strategy will continue, but the industry structure is likely to trend towards concentration at the top and clearing at the bottom. This article provides a framework for assessing the sustainability of DAT enterprises during downturns and offers references for the standardized evolution of the DAT industry.
Keywords: Digital Asset Treasury (DAT); financing structure; currency differences; mNAV; sustainability analysis
Table of Contents
1. Introduction
2. Concepts and Definitions
2.1. Concept Definition: Definition of Treasury
2.2. Terminology Explanation
2.3. Analysis of the Current Status of Digital Asset Reserves (DAT) in Global Publicly Listed Companies
3. Business Model of DAT Companies
3.1. Business Model Positioning: Actively Managed Balance Sheet Companies
3.2. Value Creation Mechanism: Assets Determine Outcomes, Financing Determines Speed
3.3. Structural Characteristics of the Business Model: Weakening of Income Statement, Asset Concentration, Financing Dominance, Valuation Differentiation
3.4. Sources of Model Differences: Financing Structure × Currency Attributes
4. Comparison of Core Financing Structure Differences in DAT
4.1. Equity Financing: Core Driving Force of the DAT Flywheel
4.2. Debt Financing: Secondary Source of Funds and Time Dimension Constraints
4.3. Coordination of Equity + Debt: Formation of the Flywheel and Survival Boundaries
5. Currency Analysis: How Core Assets Reshape DAT's Sources of Income and Resilience
5.1. Bitcoin (BTC): Consensus Advantage for a More Resilient Financing Window
5.2. ETH: Higher Requirements for Transparency Due to Ecological and Income Variables
5.3. Small-Cap Currency's "Coin-Stock Linkage" Model: Asset Mapping and Liquidity Transmission under SPAC Channels
5.3.1. Core Mechanism: Liquidity Transmission after Shell Listing
5.3.2. Typical Path Analysis: Static Treasury and Dynamic Market Making
6. DAT Risk Analysis
6.1. Cycle Stages and Differentiation Paths of DAT
6.2. Financing Structure Risks: Boundaries of Equity and Debt
6.3. Currency Combination Risks: BTC's Macroeconomic Sensitivity and ETH's Allocation Paradox
6.4. Core Assessment Indicators: Quantifying Financial Health and Expansion Potential
7. Analysis of Typical Risk Management Cases
7.1. Strategy: Cyclical Pressure of Equity-Debt Arbitrage and Forward Debt Wall
7.1.1. Constraints of Premium Rate Fluctuations on Financing Windows
7.1.2. Payment Pressure of Forward Debt
7.2. Core Scientific: Painful Lessons of Debt Accumulation and Maturity Mismatch
7.3. MARA: Survival Game under Equity Dilution
8. Sustainability Analysis and Trend Outlook for DAT Companies
8.1. Sustainability Judgment Framework for DAT Companies: Premium Window, Cash Buffer, Debt Terms and Conditions
8.2. Trend Outlook: From Expansion Narrative to Survival Test
8.2.1. Core Proposition Restructuring: From Pro-Cyclical Expansion to Cross-Cycle Survival
8.2.2. Valuation Model Transition: Scarcity of Premiums and Functional Pricing
8.2.3. Differentiation of Underlying Assets: Consensus Pricing of BTC and Strategic Returns of ETH
8.2.4. Industry Endgame Simulation: Intensified Matthew Effect and Tail Clearing
1. Introduction
DAT (Digital Asset Treasury) typically refers to enterprises (or DAO organizations) incorporating cryptocurrencies like BTC and ETH into their balance sheets and managing and allocating them as "long-term reserves." Driven by the benchmark demonstration effect of Strategy (formerly MicroStrategy) and supported by signals from the U.S. White House regarding the "Strategic Bitcoin Reserve," this strategy is gradually transitioning from individual case exploration to a broader strategic option for publicly listed companies. A Bitwise report indicates that as of Q3 2025, 172 publicly listed companies globally held BTC, with a total holding exceeding 1 million coins. Thus, based solely on publicly listed companies, the asset scale related to BTC DAT has surpassed $100 billion (calculated based on the Bitcoin price at the time of the Bitwise report); if other digital assets and unlisted enterprises are further included, the potential coverage and scale still have significant expansion space.
However, as BTC and ETH prices have continued to weaken since Q4 2025, the effectiveness of the DAT path has begun to face broader skepticism. Some entities using "equity + debt" financing have experienced failures in their financing models and were forced to adjust strategies after stock price retracements: MicroStrategy, the largest Bitcoin treasury, saw its stock price drop over 50%, while Bitmine, the largest Ethereum treasury, saw its stock price drop over 80%. Meanwhile, some small and medium-sized DAT companies have also shown signs of strategy contraction or even suspension, such as the BTC treasury company Prenetics, which was endorsed by star David Beckham, halting its treasury strategy. These changes have shifted market attention from "whether to hold coins" to "how to navigate through the retracement cycle": In the context of price retracement, downward stock prices and debt pressures may create a dual impact— in other words, the core variables determining whether a strategy can cross cycles are "what financing method to hold coins + what coins to hold."
Based on this, this article reviews the current development status and latest stress tests of DAT enterprises as of early 2026, and provides a framework analysis of the sustainability and key risk points of corporate DAT strategies from the two main lines of financing structure and currency selection, aiming to provide verifiable references for subsequent strategy design and risk control.
2. Concepts and Definitions
2.1. Concept Definition: Definition of Treasury
This article studies DAT (Digital Asset Treasury) and first defines its concept.
· Broad Definition: Any fund pool that incorporates cryptocurrency assets into its financial management system and has a medium to long-term holding intention can be considered a DAT. According to the classification of treasury carriers (i.e., entities holding DAT), DAT can be divided into on-chain and off-chain categories.
(1) On-chain: Mainly includes DAO organizations and project foundations;
(2) Off-chain: One type is DATCo (Digital Asset Treasury Company) focused on "holding coins," while another type includes companies with other main businesses that incorporate cryptocurrency assets into their asset allocation (such as crypto mining companies);
(3) Shell Listing: In recent years, a new emerging path has appeared that combines on-chain and off-chain, such as project parties achieving shell listings through shell companies (SPAC, Special Purpose Acquisition Company) to connect on-chain funds with off-chain capital market channels.
· Narrow Definition: In the current market context, DAT often refers to DATCo (Digital Asset Treasury Company), which is a company (mostly publicly listed) whose main business activity is holding and managing cryptocurrency assets off-chain. [2]
Based on the above definitions, the "DAT enterprises" referred to in this article mainly refer to DATCo, which are enterprises (mainly publicly listed companies) that focus on off-chain coin holding as their main business—among which Strategy (formerly MicroStrategy) is the pioneer of this model. Enterprises with clear main businesses that only treat cryptocurrency assets as investments (such as mining companies) are not the focus of this analysis.
Table 1: Key Terminology Explanation Table
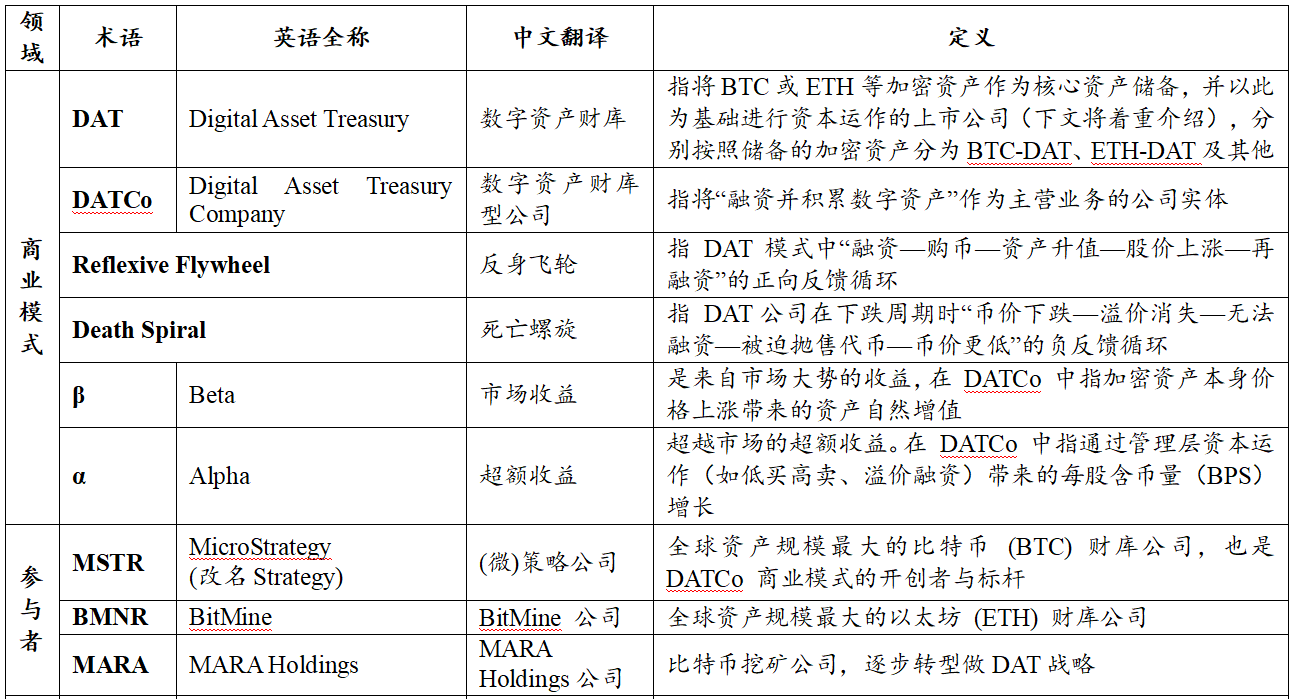
Source: PKUBA整理
2.2. Analysis of the Current Status of Digital Asset Reserves (DAT) in Global Publicly Listed Companies
Based on Coingecko data (as of January 2, 2026), the statistics of digital asset reserves (DAT) held by global publicly listed companies are as follows. (Note: This statistic only covers data from publicly listed companies and does not include unlisted enterprises.)
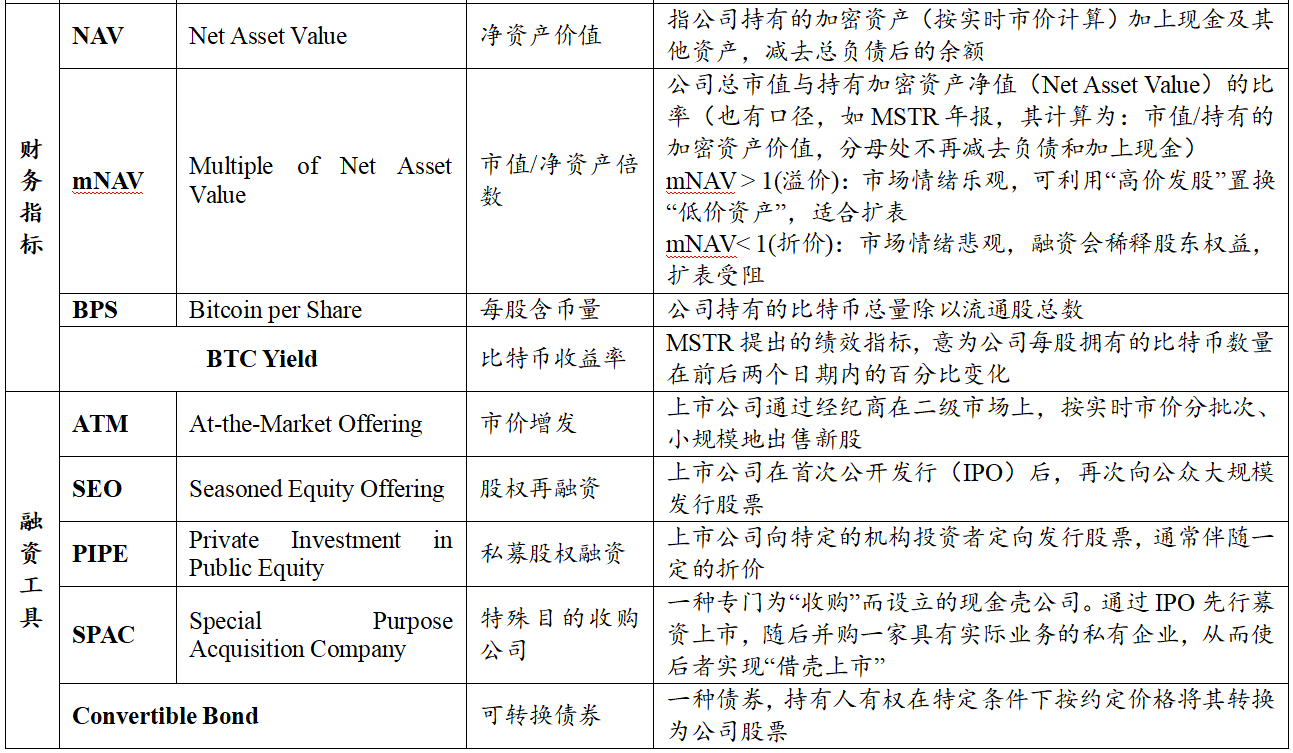
Table 2: Statistics of Digital Asset Reserves (DAT) in Publicly Listed Companies
Source: Coingecko, as of January 2, 2026
Note: Other currencies include assets such as XRP, BNB, TON, SUI, etc.
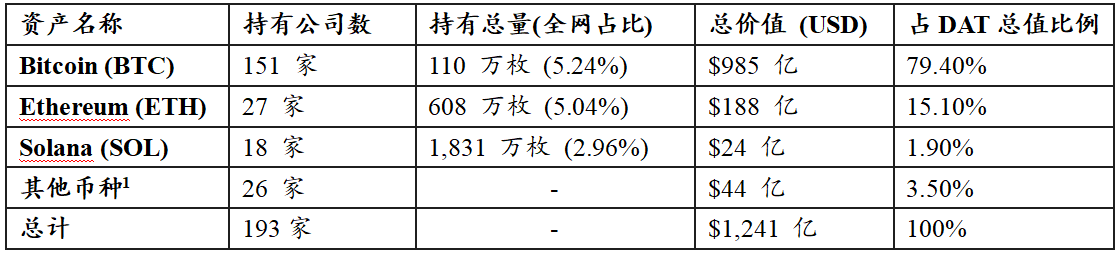
Figure 1: Value Proportion of Digital Asset Reserves (DAT) in Publicly Listed Companies
Source: Coingecko, as of January 2, 2026
Based on the above situation, the basic pattern of global publicly listed company DAT is as follows:
First, Asset Scale and Head Effect: Statistics show that the total scale of global publicly listed company DAT has reached $124.1 billion. In terms of value composition, Bitcoin (BTC) exhibits overwhelming dominance, accounting for 79.4%; Ethereum (ETH) ranks second, accounting for 15.1%; Solana (SOL) and other long-tail assets account for the remaining 5.5%.
Second, Allocation Preferences and Consensus Differences: There are significant differences in the penetration rates of various asset classes in corporate balance sheets. The total reserve value of BTC is approximately 5.2 times that of ETH and over 41 times that of SOL. In terms of institutional coverage, there are as many as 151 publicly listed companies holding BTC, far exceeding those holding ETH (27 companies) and SOL (18 companies). This data strongly supports that BTC remains the preferred target for institutional capital allocation.
Third, Structural Characteristics of Long-Tail Assets: In the composition of "other assets" (accounting for 3.5%), two main characteristics are presented:
Established Infrastructure: Includes established public chain or exchange tokens such as XRP, LINK, TRON, BNB, which are often related business holdings of publicly listed companies;
Capital Operation: Some emerging projects (such as 0G, Babylon, Pump.fun, etc.) exhibit obvious "coin-stock linkage" characteristics, reflecting that some project parties attempt to achieve a deep binding of publicly listed company equity and digital asset value through capital market operations.
3. Business Model of DAT Companies
3.1. Business Model Positioning: Actively Managed Balance Sheet Companies
DAT enterprises have a relatively clear and replicable business model: they are essentially actively managed companies centered on balance sheet management, rather than passive ETFs or closed-end funds that track target assets.
Unlike traditional companies that rely on products and services to generate operational cash flow, the core action of DAT is to finance through capital markets, purchasing and holding cryptocurrencies on a large scale for the medium to long term. Therefore, their asset side typically shows a high allocation ratio to digital assets such as BTC and ETH, while the liability and equity sides are mainly composed of equity financing and debt financing; the operational goal is more about continuously accumulating the scale of digital assets on the balance sheet and enhancing the asset content corresponding to each unit of equity.
Figure 2: Value-Added Cycle of DAT Companies (Reflexive Flywheel Diagram)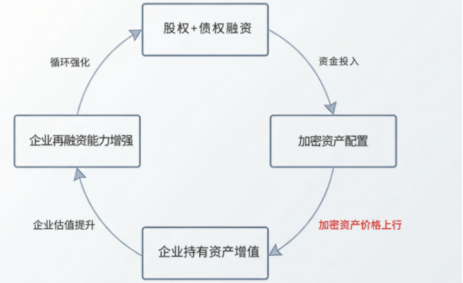
Source: PKUBA整理
Around this model, DAT is often summarized as a "Reflexive Flywheel": a pro-cyclical positive feedback process of financing—purchasing coins—asset appreciation—market capitalization increase—refinancing. Its logical chain can be broken down as follows: the company obtains funds through equity or debt financing and allocates cryptocurrency assets; when the coin price rises, the value of the asset side increases, leading to a revaluation of the company's valuation; the rising stock price further strengthens refinancing capability, thus driving a new round of balance sheet expansion.
Conversely, DAT may fall into a "Death Spiral" during a downturn: falling coin prices—disappearing premiums—unable to finance—forced token sales—reverse negative feedback process with even lower coin prices, meaning that the decline in the underlying asset (coin price) first leads to a shrinkage of the company's balance sheet; the loss of asset value triggers the disappearance of stock price premiums and valuation declines, causing external financing windows to close rapidly; liquidity exhaustion or debt default risks force the company to sell tokens at low prices to repay debts, further suppressing coin prices and exacerbating a new round of balance sheet contraction.
Figure 3: Downward Cycle of DAT Companies (Death Spiral Diagram)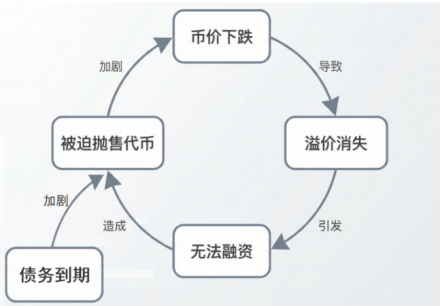
Source: PKUBA整理
This dual-cycle mechanism, both positive and negative, makes the DAT model exhibit strong pro-cyclicality in the highly volatile cryptocurrency market. The stability of its financial structure is highly dependent on the price trends of the underlying tokens; once it enters a downward channel, a lack of external liquidity injections can easily lead the company into irreversible asset sales and valuation collapses.
Therefore, the speed of balance sheet expansion for DAT enterprises depends on the financing window, which is influenced by the cryptocurrency asset cycle and the management's ability to complete financing and allocation during favorable valuation phases. The ability to manage assets proactively, reserve emergency liquidity, and dynamically adjust holding strategies becomes key to the survival of DAT enterprises during cycle transitions.
3.2. Value Creation Mechanism: Assets Determine Outcomes, Financing Determines Speed
At the mechanism level, the value creation of DAT can be summarized into two main lines: the asset side β determines the direction and outcome of net value changes, while the capital side α determines the speed and efficiency of asset expansion.
Asset side β: Comes from changes in cryptocurrency asset prices and holding yields (such as staking, if applicable);
Capital side α: Comes from valuation premiums and more favorable financing and expansion efficiency.
On this basis, companies also use leverage tools (such as convertible bonds, collateral financing, etc.) to enhance capital efficiency and liquidity—amplifying returns during upward phases but also increasing sensitivity to price retracements and refinancing conditions.
Table 3: Breakdown of Value Sources and Mechanisms of DAT Companies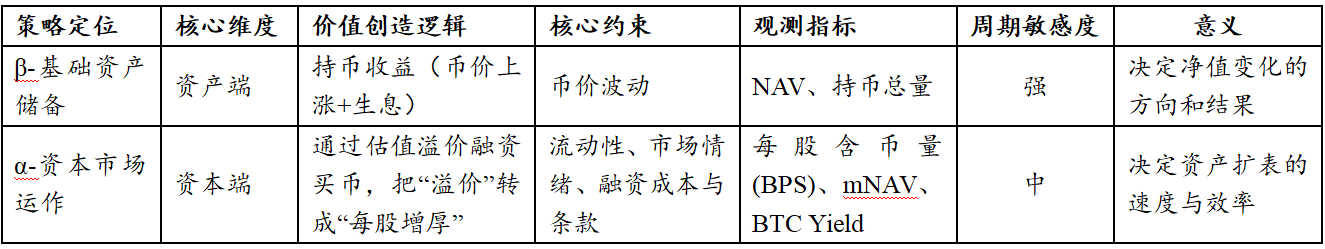
Source: PKUBA整理
In summary: β is more reflected through changes in NAV and holding scale; the key for α lies in whether the company can stabilize the conversion of valuation advantages into improvements in BPS when mNAV is at favorable levels; while the arrangement of the "tool layer" (debt, collateral, etc.) more affects execution flexibility and constraint intensity.
3.3. Structural Characteristics of the Business Model: Weakening of Income Statement, Asset Concentration, Financing Dominance, Valuation Differentiation
Under the framework of "β determines outcomes, α determines speed," the business model of DAT typically exhibits four structural characteristics, corresponding to evaluation systems, asset structures, financing structures, and valuation mechanisms.
First, the evaluation framework shifts from the income statement to the balance sheet. The core operational activities of DAT do not rely on traditional revenue generation from products or services but focus on balance sheet management around the holding and expansion of cryptocurrency assets. Therefore, indicators such as revenue, gross margin, and net profit have limited explanatory power for operational quality; more explanatory indicator systems often shift to the number of coins held and their changes, the amount of coins per share (BPS), and the premium level of market capitalization relative to net assets (mNAV), to measure whether balance sheet expansion is effective and whether the asset corresponding to each unit of equity has achieved substantial enhancement.
Second, assets are highly concentrated, and net assets are highly sensitive to coin price fluctuations. The asset structure of DAT typically exhibits a high concentration characteristic, with a high proportion of cryptocurrency assets, causing net assets to fluctuate significantly with coin price movements. Cash primarily serves as a liquidity buffer to cover interest expenses, financing windows, and operational safety during extreme market conditions. Overall risk-return performance tends to be more "non-linear": during upward phases, net asset elasticity is amplified; during downward phases, net asset contraction, valuation compression, and decreased financing capability often occur simultaneously.
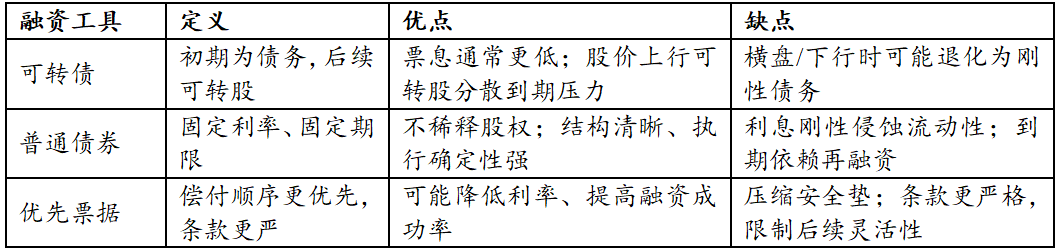
Third, financing is primarily equity-based, with debt as a supplement, and the structure determines cross-cycle pressure capacity. The liability side of DAT is mainly composed of equity financing, debt financing, and a small amount of short-term loans or repurchase structures. In practice, companies often promote balance sheet expansion through methods such as ATM, SEO, and PIPE during more favorable valuation phases, supplemented by convertible bonds, preferred stocks, and notes to introduce a second layer of funding sources. The two types of financing are not simple substitutes: equity financing relies more on valuation and absorption capacity; debt financing is more constrained by coin price retracements and refinancing conditions, and different clause structures can significantly alter the company's financial pressure and risk exposure across cycles.
Fourth, valuation is sensitive to expectations, and mNAV may still show long-term differentiation among similar assets. The stock price of DAT reflects not only the value of the underlying assets but also incorporates market expectations regarding its financing capabilities, management decisions, and sustainability of balance sheet expansion. Therefore, even if holding similar scales and structures of cryptocurrency assets, different DATs may still exhibit long-term differences in mNAV; these differences often stem from market sentiment, corporate governance, and financing path choices.
In summary, the risk-return characteristics of DAT are not determined by a single factor but are often shaped by the combination of "asset concentration + financing structure + market expectations," which can be amplified or weakened in different market environments.
3.4. Sources of Model Differences: Financing Structure × Currency Attributes
From the perspective of business model structure, the differences among DATs mainly focus on two dimensions: financing structure and core asset selection.
In terms of financing structure, equity financing-dominant DATs can achieve balance sheet expansion through issuance during phases when mNAV > 1, but their financing capabilities may weaken rapidly when valuations decline; DATs with a higher proportion of debt financing improve asset expansion efficiency through tools such as convertible bonds and preferred stocks but are more sensitive to coin price retracements and deteriorating refinancing conditions. In particular, the maturity structure, interest rate levels, and the presence of mandatory clauses directly affect their survival capabilities in bear markets.
On the asset side, currency selection is another key variable determining model stability. DATs centered on BTC as a core asset rely more on scarcity and market consensus; DATs centered on ETH or other platform tokens bear not only price volatility risks but also uncertainties related to technological routes, ecological competition, and changes in revenue models. Differences in volatility, retracement magnitude, and narrative stability among different currencies can transmit through the balance sheet to the shareholder level, significantly altering the risk curve.
Therefore, there is no unified "optimal business model" for DAT; its sustainability depends more on the degree of matching between financing methods and currency attributes; the more aggressive the financing and the higher the uncertainty of the core asset, the stronger the dependence on market conditions. The following sections will explore these aspects from the perspectives of financing structure and currency differences.
4. Comparison of Core Financing Structure Differences in DAT
Based on the previous judgment that "financing structure determines balance sheet expansion efficiency and cross-cycle pressure," this section further dissects common financing tools used by DAT and compares their applicability and constraints under different market stages.
4.1. Equity Financing: Core Driving Force of the DAT Flywheel
Among the main financing methods, equity financing is of the utmost strategic significance for DAT: under specific valuation conditions, equity financing not only does not necessarily dilute the value of each unit of equity but may also increase the number of corresponding cryptocurrency assets per share. The prerequisite for this is that the company's stock price is above the intrinsic net asset value, i.e., mNAV > 1. At this point, the company issues new shares to obtain funds, which can be allocated to BTC/ETH at a relatively "discounted" price on the asset side, forming a structural condition of "exchanging valuation advantages for asset scale," and constituting the core source of positive feedback in the flywheel.
In terms of tools, financing methods can be divided into three approaches: ATM (At-the-Market Offering), SEO (Seasoned Equity Offering), and PIPE (Private Investment in Public Equity).
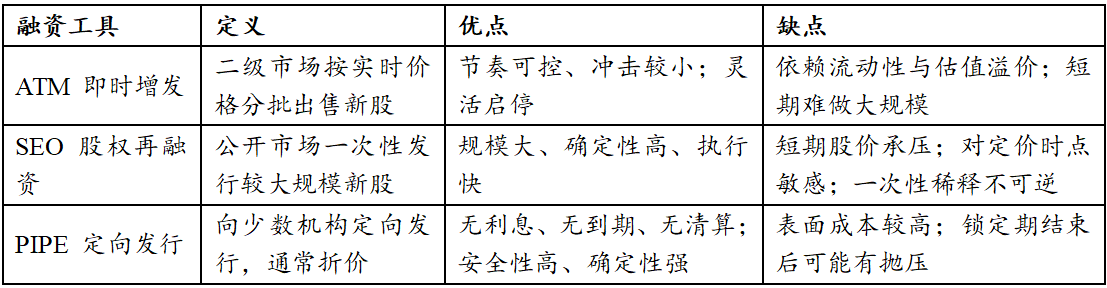
Table 4: Comparison of Three Major Equity Financing Tools
Source: Paramita Venture [3]
ATM (At-the-Market Offering) is regarded as the most ideal equity financing tool. Its advantage lies not in the scale of financing but in the highly decentralized financing rhythm, which can advance in sync with secondary market trends. By continuously and diversely completing issuances in the public market, DAT can convert the stock price increase itself into the ability to buy BTC/ETH without significantly disturbing the stock price. However, this model requires a very high market environment; once trading liquidity decreases or valuation premiums converge, the feasibility of ATM will quickly disappear.
SEO (Seasoned Equity Offering) is more of a phased choice. By completing a large-scale financing in one go, DAT can significantly expand its BTC/ETH holdings in a short time, but the cost is short-term pressure on the stock price and a high dependence on the timing of the issuance. If the market rises rapidly after the issuance, the opportunity cost of SEO will be magnified.
PIPE (Private Investment in Public Equity) is often issued at a discount; although it superficially increases financing costs, from the perspective of balance sheet safety, PIPE is one of the most robust funding sources for DAT. Since there are no interest burdens, maturity pressures, or liquidation mechanisms, PIPE transfers all uncertainties to equity investors, allowing DAT to maintain ample time options even in volatile environments. DATs that use PIPE financing typically do not fall into a passive deleveraging situation due to market fluctuations. This is why PIPE often becomes a practical choice for DAT during phases when valuations have not stabilized and market conditions are uncertain.
4.2. Debt Financing: Second Layer of Funding Source and Time Dimension Constraints
Compared to equity financing, debt financing usually does not directly bring positive feedback, but at certain stages, it can significantly expand the available funds, thereby enhancing asset expansion efficiency, and can be seen as a "second layer of funding source."
Among them, convertible bonds are widely used in DAT's financing structure, with the advantage of combining the certainty of debt with the upside flexibility of equity. When stock prices perform well, convertible bonds can alleviate repayment pressure through conversion; when market performance is poor, their interest costs are usually lower than ordinary debt, providing DAT with a certain buffer space. However, if cryptocurrency assets remain stagnant for a long time, and the stock price fails to meet the conversion conditions, convertible bonds will ultimately convert into rigid repayment pressure.
Moreover, a heavy reliance on convertible bond financing may trigger a further "downward spiral" led by arbitrage institutions—where institutions short the stock to hedge bond risks—when the stock price falls, these institutions will mechanically increase their short positions to maintain the hedge ratio, thereby accelerating the stock price collapse and closing the financing window. This embedded short-selling mechanism within the capital structure can passively amplify declines during DAT's downturns, deepening the "death spiral" and causing financing capabilities to reach zero before asset values do.[4]
Note: The "downward spiral" mentioned here is not equivalent to the "death spiral" under the reversal of the "reflexive flywheel," but it acts as an accelerator, further deepening the degree of the "death spiral" and speeding up its collapse.
The risks of ordinary bonds, preferred notes, and other debt instruments do not stem from short-term price fluctuations but more from the time dimension. Unlike on-chain leverage, DAT's creditors typically do not have the power to directly dispose of BTC/ETH, meaning the company will not be immediately liquidated due to falling coin prices. The real risk lies in the accumulation of interest expenses, the concentration of debt maturities, and the structural pressure brought about by deteriorating refinancing conditions.
Table 5: Comparison of Debt Financing Tools
Source: PKUBA整理
4.3. Coordination of Equity and Debt: Formation of the Flywheel and Survival Boundaries
In an ideal state, DAT does not rely on a single tool but gradually builds and strengthens positive feedback through phased coordination of equity and debt: rising stock prices drive mNAV up, enhancing financing capabilities; the proceeds from financing are used to increase BTC/ETH holdings, further improving elasticity to rising coin prices, ultimately reflecting as a further increase in stock prices.
In this process, equity financing is responsible for "creating the flywheel," while debt financing is responsible for "extending the flywheel radius." The former determines whether DAT has structural advantages, while the latter determines whether it can survive long enough before the flywheel is fully established and expand the scale of the flywheel.
Figure 4: Formation of the DAT Company Flywheel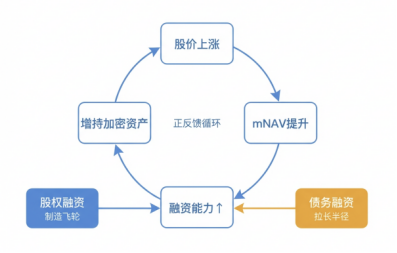
Source: PKUBA整理
From the perspective of risk-return-cost, the differences in financing methods do not lie in being good or bad, but in their impact on survival boundaries. DATs financed through PIPE are less likely to fail due to structural issues because their costs are clear and there are no mandatory exit mechanisms; DATs financed through debt typically do not exit immediately because creditors lack the power to dispose of core assets. What truly needs to be vigilant is the introduction of short-term financing structures with liquidation or forced liquidation clauses, as such arrangements directly undermine DAT's control over time.
Overall, DAT's financing structure does not simply pursue high leverage or high elasticity but revolves around a core goal: to extend the time of holding core cryptocurrency assets as much as possible through reasonable capital structure design in the highly volatile cryptocurrency market, and to amplify their profit potential within suitable cyclical windows.
5. Currency Analysis: How Core Assets Reshape DAT's Sources of Income and Resilience
Within the framework of "financing structure × currency attributes," asset selection is far from a simple bet on which will rise more. It actually determines three things: first, the volatility pattern of the asset-side net value; second, the ease and cost of the company obtaining funds; third, the market's tolerance for the company's valuation premium. Therefore, when the market focus shifts from simply "holding coins" to "how to navigate cycles," currency allocation becomes a key variable determining the success or failure of strategies.
The current situation of mainstream DAT institutions allocating cryptocurrency assets is shown in Figure 1: Bitcoin accounts for about 80%, Ethereum accounts for about 15%, and other currencies account for about 5%. This concentrated situation at the top reflects that institutional funds still highly prefer the interpretability and liquidity of assets. Based on this, this section divides the evolution path of DAT into BTC-dominant and "ETH-dominant (yield-generating flow)." After deeply analyzing the operational logic of these two core assets, typical cases of small currencies' "coin-stock linkage" will be further explored.
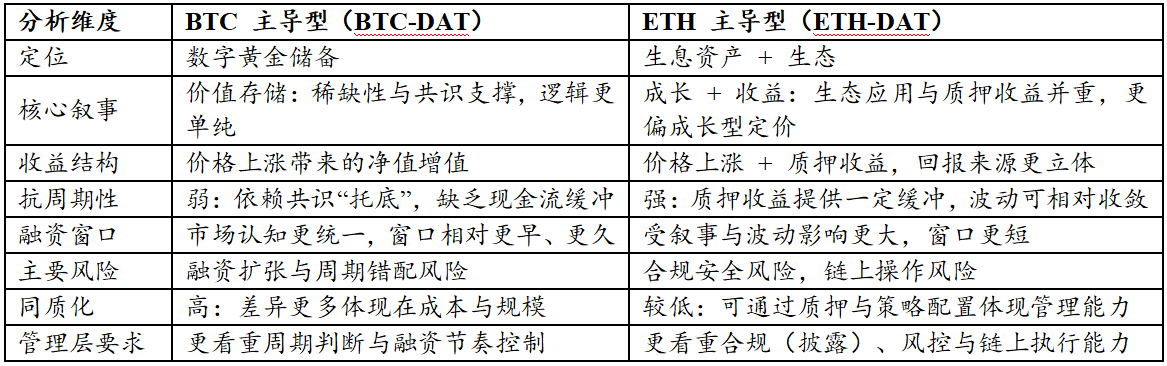
Table 6: Comparison of Characteristics of BTC-Dominant and ETH-Dominant DAT Enterprises
Source: PKUBA整理
5.1. Bitcoin (BTC): Consensus Advantage for a More Resilient Financing Window
The core logic of BTC-type DAT lies in its extremely low explanation cost. The market tends to define BTC as a digital gold reserve. Even if the company itself lacks operational cash flow, investors can easily establish a clear pricing model through the scale of holdings, the rate of increase, and the net assets per share. This strong consensus characteristic provides the company with two major financing advantages:
· Clear pricing framework on the asset side, thus long window benefits during upward cycles: Due to the clear asset attributes, the market's acceptance of BTC reserves is highest at the beginning of a bull market. This allows the company to obtain valuation premiums more quickly, thereby securing ample time windows and operational space for subsequent refinancing (such as issuance or convertible bonds).
· Lower uncertainty on the asset side, thus controllable discounts during downward cycles: When the market retracts, although premiums will be compressed, based on BTC's positioning as a mainstream asset, investors' assessment logic will still maintain within the framework of "net value—premium—financing capability," and will not easily question the zero-risk of the asset itself. This clear valuation anchor can effectively avoid narrative collapse.
Figure 5: Statistics of Global TOP 100 BTC Treasury Public Companies from Bitcointreasuries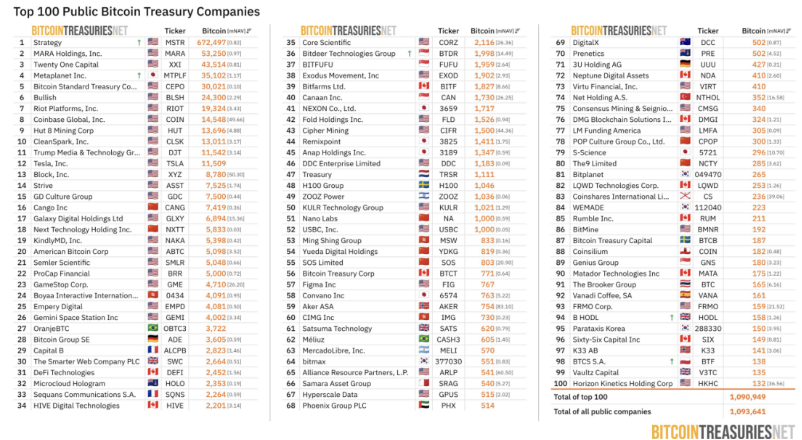
Source: Bitcointreasuries, as of January 2, 2026
However, BTC-type DAT is not a natural safe haven; its "high β" attribute also brings hidden structural risks:
First, lack of native income paths makes it extremely sensitive to financing rhythms: Due to the absence of a native staking income mechanism, treasury performance entirely depends on the rise and fall of coin prices. This causes companies to lose the means to smooth cycles, requiring high precision in timing for "financing—buying." If financing peaks correspond to high asset levels and are subsequently met with falling coin prices, companies will face severe maturity mismatch risks—i.e., the gap between rigid debt interest and asset shrinkage.
Second, homogenized competition weakens premium capabilities: When most DAT companies adopt a single strategy of "holding coins," the business model inevitably falls into homogenization. The market finds it difficult to grant specific companies higher management premiums, and stock prices may ultimately become shadows of BTC's ETF. This places higher demands on management: how to create Alpha through "financial techniques" in homogenized competition by precise macro timing or innovative financing structure design.
In summary, while BTC provides a stable narrative foundation, if a company lacks a yield-generating mechanism for buffering and misjudges the financing cycle, once valuation declines trigger financing exhaustion, the company will easily fall into a passive contraction dilemma.
5.2. Ethereum (ETH): Overlaying Ecosystem and Yield Variables, Raising Higher Transparency Requirements
Unlike the pure reserve attribute of BTC, ETH possesses a dual attribute of "yield mechanism + ecological governance." This means that ETH-type DAT faces a more complex pricing model—markets not only focus on price trends but also incorporate the prosperity of the network ecosystem, technological upgrade paths, and on-chain yield rates into valuation considerations.
This complexity provides DAT strategies with tools to smooth cycles and creates opportunities for differentiation among companies. Companies can use part of their ETH for staking or participating in on-chain DeFi, forming stable holding period returns. This upgrades the treasury narrative from simple coin holding to a "manageable yield-generating asset portfolio," providing a certain cash flow buffer during bear markets. Furthermore, this model gives companies the space for "active management"—the allocation of staking ratios, the layout of node validation, and the design of liquidity release mechanisms can all become key indicators for horizontal comparison.
Figure 6: Statistics of Global TOP 100 ETH Treasury Public Companies from Strategicethreserve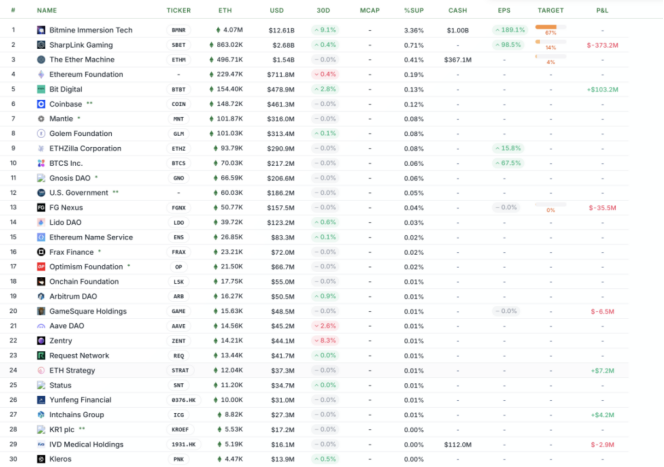
Source: Strategicethreserve, as of January 2, 2026
However, the other side of yield is the extreme requirement for risk control and transparency: given that ETH's staking mechanism may touch sensitive nerves of securities regulation (such as the U.S. SEC), and that on-chain interactions involve complex auditing issues. If a company cannot clearly disclose the sources of its income or prove the independence of asset custody, the market will find it difficult to assign a fair price, leading to severe valuation discounts. Only by completing high transparency audits can investor compliance concerns be alleviated.
Finally, compared to the strong cyclicality of BTC, ETH's volatility characteristics are more pronounced, resulting in "narrow and fast" financing windows. These windows often open quickly and close just as fast; whether financing can be completed and allocations implemented in a short time will directly shape the balance sheet forms for the subsequent quarters. In other words, ETH treasuries belong to an "opportunity window strategy": when execution and governance capabilities are inadequate, its complexity can amplify uncertainty.
5.3. The "Coin-Stock Linkage" Model of Small-Cap Coins: Asset Mapping and Liquidity Transmission under the SPAC Channel
Beyond mainstream assets, small-cap coins are exploring a more aggressive "coin-stock linkage" path. Unlike traditional business revenue supporting stock prices, this model uses SPACs (Special Purpose Acquisition Companies) as a listing vehicle, combined with PIPE, ATM, and other financing tools, to construct a transmission mechanism connecting U.S. stock market liquidity with on-chain assets.
In short, this is not merely a "backdoor listing," but rather encapsulating the "buying plan" of on-chain tokens into tradable Nasdaq stock assets, thereby achieving a deep binding of project assets with secondary market funds.
5.3.1. Core Mechanism: Liquidity Transmission after Backdoor Listing
On the surface, this appears to be a "backdoor listing" by the project party, but from an operational substance analysis: it is a liquidity transmission centered on capital operations—allowing funds from the stock market to be rapidly and directly transmitted to the token market. This operation includes two key links:
- SPAC provides compliance access: Utilizing shell companies to solve compliance subject issues, opening up access to U.S. dollar liquidity.
- Financing tools provide new funds: Through PIPE (Private Equity Investment), convertible bonds, or ATM (At-the-Market Offering), ensuring that the listed company continuously obtains low-cost funds, forming sustained buying pressure on on-chain tokens.
Under this structure, the pricing logic of stock prices changes: the market no longer anchors to the price-to-earnings ratio (P/E) but instead focuses on the net asset value (NAV) of token assets and refinancing capabilities. The stock price effectively becomes a leveraged mapping of the token price.
5.3.2. Typical Path Analysis: Static Treasury and Dynamic Market Making
Depending on the degree of involvement of the project party in the listed company and the operational goals, the linkage model of small-cap coins presents two different paths: one is a compliant treasury model, focusing on asset holding; the other is a control-driven model, emphasizing capital games and subjective market making.
As analyzed in the table below, StablecoinX (TLGY) adopts a structured asset mapping model. Its essence is to build a high-transparency token treasury on Nasdaq. Funds are primarily acquired through over-the-counter discounted purchases and locking tokens to avoid directly impacting the secondary market. In this model, stock price fluctuations are relatively smooth, mainly reflecting the true net asset value (NAV) of the underlying assets. The project party aims to leverage the compliance of U.S. stocks to provide a low-threshold channel for traditional institutional funds to allocate core cryptocurrency assets, facilitating auditability and supply locking.
Table 7: Comparison of Typical Paths for Small-Cap Coin-Stock Linkage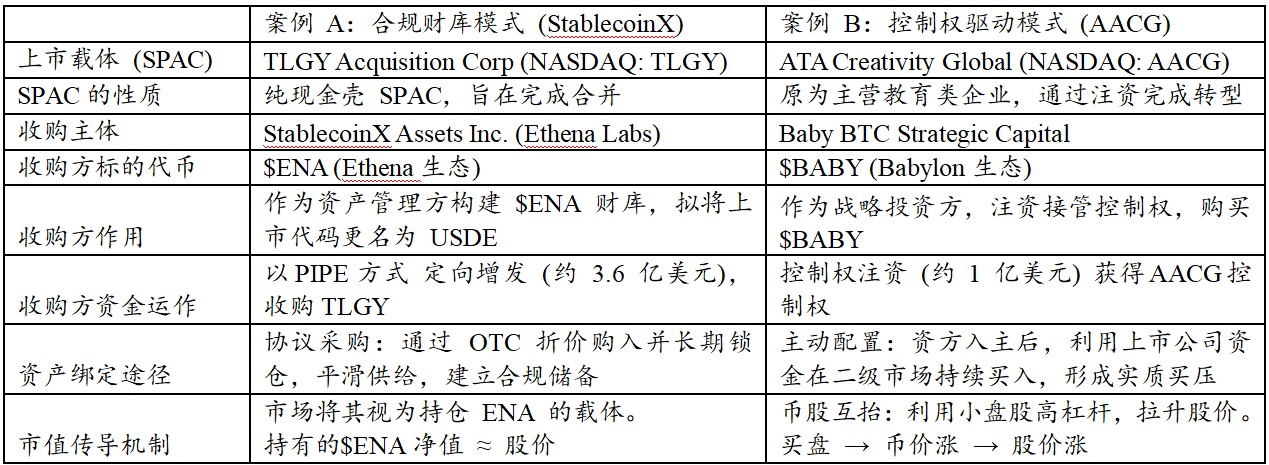
Source: PKUBA整理
The case of AACG (Baby) represents actively managed capital market making, i.e., capital-driven liquidity management. External capital gains control of the listed company through investment, rapidly converting balance sheet funds into token purchasing power. Due to the small circulation of small-cap coins, concentrated buying by the listed company can significantly improve token supply and demand, thereby driving stock price revaluation through rising token prices. This is a more aggressive strategy, attempting to use the liquidity premium of the capital market to benefit on-chain assets.
Although these two models differ in their paths, they essentially utilize the listing channel to achieve the securitization of asset allocation. However, this logic is not without flaws. The key risk of small-cap coin-stock linkage lies in whether the positive cycle between the asset side and the financing side can close. If the listed company merely becomes a one-way buying machine, once it encounters a closure of the secondary market financing window or a sharp decline in token prices, the high premium will quickly collapse.
Therefore, the most robust outcome should be that the listed company is not only a buyer of tokens but also a builder of the ecosystem. Only by binding the company's strategy with the long-term value of the ecosystem through governance structures can the stock price transform from a mere speculative leverage into a compliance shadow indicator measuring ecosystem prosperity.
6. DAT Risk Analysis
6.1. The Cyclical Phases and Differentiation Paths of DAT
The operation of DAT is not a static model but is influenced by two major factors: (1) the cyclical fluctuations of cryptocurrency asset prices, and (2) the premium levels of the secondary market for holding companies. Therefore, determining whether a DAT company is sustainable is not primarily about "whether it holds coins," but rather about which stage of the lifecycle it is in and whether its balance sheet has reserved enough safety space for the next stage.
The table below shows the complete lifecycle changes of DAT. From a lifecycle perspective, the key to success often lies not in the ability to expand during upcycles but in the differentiation results after downturns: during upcycles, premium financing is easier to open, and DAT companies can generally leverage market absorption capacity to expand their balance sheets; however, once a retraction occurs, the decline in coin prices and the contraction of premiums often happen simultaneously, narrowing or even closing the financing window. At this point, only companies with more stable debt structures and lower short-term rigid repayment pressures are more likely to withstand volatility and maintain continuity; conversely, companies with fragile funding chains and triggering conditions for disposal may be forced to reduce positions in unfavorable price ranges to meet repayment or clause requirements, thereby amplifying cyclical fluctuations into liquidation risks.
Table 8: Comparison of DAT Cyclical Phases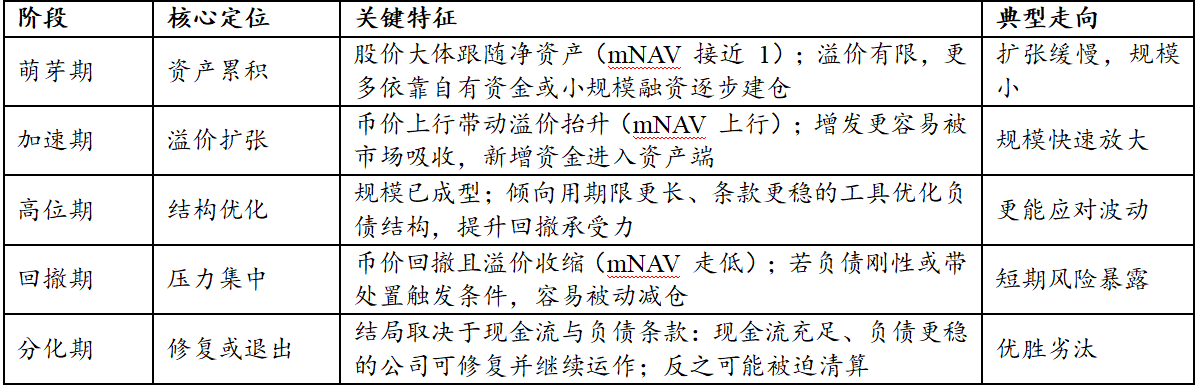
Source: PKUBA整理
6.2. Financing Structure Risks: Boundaries of Equity and Debt
The financing structure determines the speed of DAT's expansion and its ability to withstand pressure in different market environments. A reasonable financing structure design is largely key to DAT's response to market downturn pressures. During upswings, stock price premiums are more easily opened for issuance, allowing new funds to enter the asset side at lower costs, thus accelerating expansion; however, once premiums fall back, issuance efficiency significantly declines, and external funding supply contracts, forcing a slowdown in expansion.
Therefore, the core risk of equity financing lies in the unsustainability of premiums. As compliant holding channels such as spot ETFs become increasingly refined, investors' tolerance for DAT's premiums increasingly relies on information disclosure, governance, and execution discipline, rather than merely on channel scarcity; when mNAV falls back to around 1 or even turns into a discount, continued issuance often brings stronger dilution pressure.
The risks of debt financing mainly manifest as the accumulation of interest burdens and maturity pressures. Increasing leverage during market upswings can amplify returns, but during long-term adjustments, deteriorating refinancing conditions may force companies to sell cryptocurrency assets to obtain repayment funds, converting balance sheet fluctuations into actual position reductions. Additionally, if debt financing includes liquidation or forced liquidation arrangements, or is primarily based on short-term, rigid structures, it is more likely to trigger passive disposals during downturns, thereby amplifying liquidity pressures and price shocks.
It is worth noting that during downturn cycles, companies that overly rely on "convertible bond financing" are easily dominated by arbitrage funds, creating additional selling pressure on stock prices. The mechanism is that arbitrage institutions typically employ a strategy of "buying convertible bonds and shorting the underlying stock" for hedging. When stock prices fall, to maintain the established hedge ratio, arbitrage institutions often passively increase their short selling. This mechanical selling behavior amplifies short-term downward pressure, accelerates stock price declines, and triggers negative feedback in the "downward spiral."
Therefore, DAT companies must seek a dynamic balance between equity and debt when designing their financing structures to avoid the risks of stagnation in expansion or chain reactions caused by excessive reliance on a single financing method.
6.3. Currency Combination Risks: BTC's Macroeconomic Sensitivity and ETH's Allocation Paradox
As the core asset on the balance sheets of current DAT institutions, Bitcoin has long since detached from its early independent market and has instead shown a high correlation with the liquidity policies of the Federal Reserve, as illustrated in the following figure, which shows the correlation between MSTR stock prices and BTC prices, constrained by cyclical changes in liquidity.
Figure 7: Performance of BTC and Holding Company Stock Prices during the Federal Reserve's Tightening Cycle (2021/11-2022/12)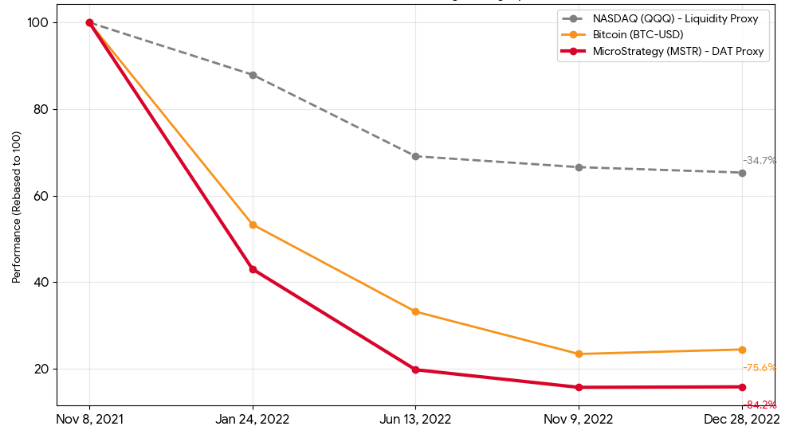
Source: Yahoo Finance Historical Data
For BTC-DAT companies with overly concentrated holdings, this correlation is a double-edged sword. During easing cycles, it acts as an accelerator for asset appreciation; however, during liquidity tightening cycles, companies will face a more severe "Davis Double Whammy" effect. That is, when the price of Bitcoin falls, leading to a shrinkage in net asset value, the market's tolerance for the company's premium will also decline simultaneously, causing stock price declines to often exceed the declines in Bitcoin itself. More troublesome is that native Bitcoin is a zero-yield asset, incapable of generating operational cash flow. This means that during the existence of debt, companies cannot rely on asset-side income to cover interest expenses on the liability side, and this absence of cash flow significantly weakens the company's resilience to risks during downturn cycles.
In contrast, Ethereum's primary challenge has long been concentrated on regulatory classification. Until the end of July 2025, with a substantial shift in the attitude of U.S. regulators, SEC Chairman Paul Atkins informally confirmed that Ethereum does not fall under the category of securities, thus lifting the legal sword that had long hung over institutions. However, its logic as a reserve asset remains fraught with contradictions:
From an asset perspective, Bitcoin is a scarce digital gold, while Ethereum resembles a high-volatility growth tech asset. Yet, the value support logic of Ethereum contains inherent contradictions: as technological upgrades and network efficiency improve, Ethereum's consumption may actually decrease, and this deflationary effect brought about by technological advancement weakens price support.
A more core contradiction lies in the staking dilemma: if not staked, holding zero-yield Ethereum will be completely suppressed by Bitcoin in terms of risk-reward ratio; if participating in staking to obtain a 3-4% yield, one will face liquidity lock-up, node penalties, and complex tax compliance challenges. This predicament makes it difficult for Ethereum to replace Bitcoin as the ballast of DAT at this stage.
6.4. Core Assessment Indicators: Quantifying Financial Health and Expansion Potential
To grasp the true value creation ability and risk baseline of DAT companies, it is necessary to establish an evaluation system that transcends traditional financial reports, focusing on the following three core dimensions:
First, Market Capitalization to Net Asset Ratio (mNAV): A barometer of financing efficiency. mNAV is not only a valuation indicator but also a leading signal for determining whether a financing window is open. When mNAV is significantly greater than 1, it indicates that the market has granted a substantial premium, allowing the company to efficiently raise funds through ATM (At-the-Market Offering) or private placements and to increase asset holdings at a cost below the market's implied value, thus achieving a positive capital cycle of "premium for assets." Conversely, if mNAV remains at a discount for an extended period, it means that external low-cost financing channels are closed, and the business model will lose its expansion momentum, even facing the risk of asset shrinkage.
Second, Bitcoin Per Share (BPS, BTC per Share): A true measure of shareholder value. This is the ultimate standard for judging the effectiveness of the DAT model after excluding the impact of equity dilution. Unlike the simple growth of total assets under management (AUM), this indicator reflects whether the management's capital operations have genuinely created incremental value for shareholders. A healthy DAT model must ensure that the compound growth rate of Bitcoin holdings consistently outpaces the expansion rate of equity. If financing to buy Bitcoin leads to a decrease in Bitcoin per share, it indicates that the company's financing costs are too high or that allocation efficiency is low; this "growth for the sake of growth" model essentially destroys shareholder value.
Third, the proportion of unsecured debt and interest coverage ratio: The bottom line of survival. In the high-volatility environment of cryptocurrency assets, the safety of the balance sheet depends on the rigidity of liabilities. A financially robust DAT structure should strictly limit asset-backed loans with mandatory liquidation lines (Margin Calls) and primarily rely on unsecured convertible notes or long-term credit bonds. As long as the company's main business cash flow is sufficient to cover interest expenses, and the debt terms do not include early repayment triggers for price declines, the company can maintain the initiative of "exchanging time for space" during significant asset price retraction cycles, avoiding being forced to collapse due to liquidity exhaustion.
7. Typical Risk Management Case Analysis
7.1. Strategy: Cyclical Pressure of Equity-Debt Arbitrage and Forward Debt Wall
The essence of Strategy's business model is to establish a cross-market capital arbitrage mechanism, operating on the price difference between the inefficiencies of fiat bond markets and the high volatility of digital assets. Its core strategy manifests as: during stable market periods, locking in extremely low funding costs using long-term unsecured convertible bonds, and safely navigating down cycles relying on terms that avoid mandatory liquidation; while in market recovery and up cycles, using high-premium ATM (At-the-Market Offering) to issue additional stock to purchase Bitcoin, thereby increasing Bitcoin per share and further enhancing financing capacity.
Although this equity-debt combination mechanism has helped the company successfully navigate past cycles, it essentially transfers market risk to the two key variables of "premium maintenance capability" and "forward debt repayment."
7.1.1. Constraints of Premium Rate Fluctuations on Financing Windows
The management's capital operations exhibit a high degree of discipline, with the pace of issuance showing a significant positive correlation with the premium rate (Premium to NAV) in the secondary market. Historical data shows that when the premium rate is high, the company's issuance volume surges; for example, at the end of 2024, when the premium rate exceeded 100%, its quarterly issuance reached a historical high. Conversely, when the premium decreases or even turns into a discount (as seen in 2022 and the second half of 2025), the company decisively suspends or significantly reduces issuance.
Figure 8: Correlation between Strategy's Premium Rate and Issuance Volume (2021-2025)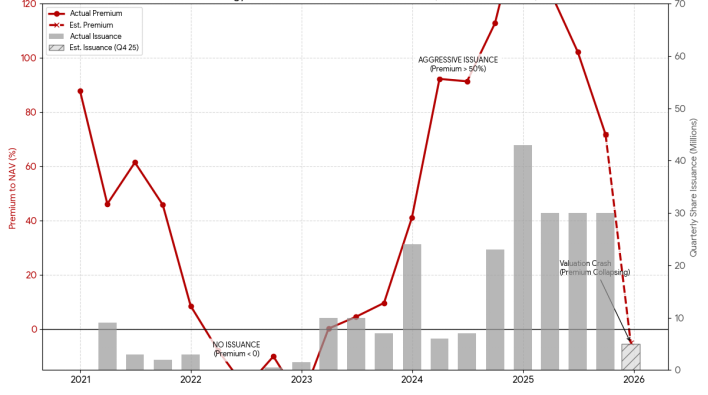
Source: Strategy News and Press Release Archive, SEC
Currently, Strategy is facing the challenge of a significant decline in premium rates, with stock prices having retreated nearly 60% from their highs. Based on past behavioral patterns, it is expected that the company will halt large-scale issuance in the last quarter of 2025. This means that the positive cycle supporting the company's asset expansion faces a temporary halt, and the company must wait for market sentiment to recover to drive the return of premiums, during which its balance sheet expansion capacity will be significantly constrained.
7.1.2. Pressure of Forward Debt Repayment
Although Strategy does not face immediate repayment pressure, as the debt maturity dates approach, if the stock price performs poorly and fails to trigger conversion by creditors, the company will face significant cash repayment challenges.
Specifically, the conversion prices for convertible bonds maturing in 2027 and 2030 are $143 and $150, respectively, below the current stock price of about $165, placing them in a relatively safe zone; if the stock price does not experience a significant decline, these two debts are likely to convert to equity, which, while diluting shareholder equity, can protect the company's cash flow.
Figure 9: Distribution of Existing Debt Maturity for Strategy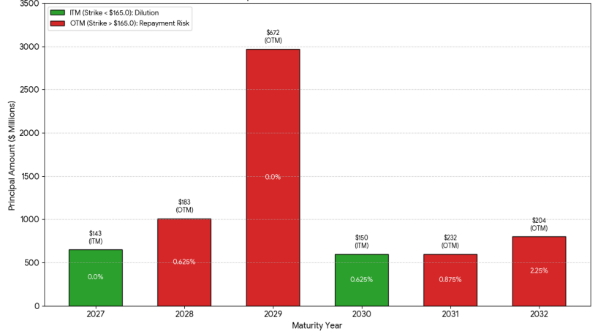
Source: SEC
However, the risk is primarily concentrated on the two debts maturing in 2028 and 2029. These debts stem from high-level issuances in 2024, with conversion prices reaching $183 and $672, the latter amounting to $2.97 billion. Although these debts currently enjoy a 0% coupon rate, considering the significant gap between the conversion price and the current stock price, if the stock price does not achieve substantial growth in four years, Strategy may face severe debt repayment difficulties.
7.2. Core Scientific: The Painful Lesson of Leveraged Coin Hoarding and Maturity Mismatch
Unlike Strategy's unsecured financing, the case of Core Scientific reveals the devastating consequences of aggressive leverage and maturity mismatch. Once the largest Bitcoin mining company in North America, the firm relied on a high-leverage strategy for rapid expansion. Its balance sheet's structural flaw lay in the debt side, primarily composed of high-cost equipment financing with floating interest rates and strict mandatory liquidation clauses; while the asset side consisted of rapidly depreciating, illiquid mining machines and highly volatile Bitcoin.[5]
Figure 10: Comparison of Core Scientific's Stock Price and BTC Price Trends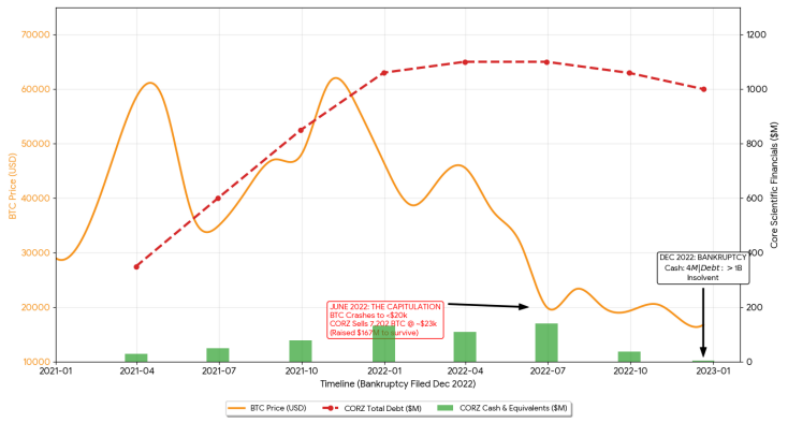
Source: Business Quant, Dgtl Infra, SEC
During the bull market of 2021, the company's debt scale rapidly ballooned from about $350 million to $1.06 billion by the end of the year. During this period, the company sold almost none of the Bitcoin it mined, relying entirely on external financing to cover operating costs and capital expenditures. However, this aggressive strategy left its year-end cash reserves at only about $130 million, extremely thin compared to its massive debt.
The risk ultimately concentrated and exploded in June 2022. As Bitcoin prices fell below $20,000, creditor pressure forced Core Scientific into panic selling at the market bottom. The company was compelled to liquidate 7,202 Bitcoins at an average price of $23,000, recovering only about $167 million.[6] Although this action temporarily alleviated the liquidity crisis, it completely drained the company's core assets. By the end of 2022, when it filed for bankruptcy protection, the company's debt remained high, while its cash on hand was only $4 million, ultimately leading to insolvency.[7]
7.3. MARA: Survival Game Under Equity Dilution
MARA (formerly Marathon Digital), another Bitcoin mining company, showcases a different survival path: maintaining survival through extreme equity dilution. Unlike Core Scientific's debt collapse, MARA adopted an At-the-Market (ATM) equity financing strategy, continuously issuing stock in the secondary market to obtain cash for rigid expenses like electricity and Bitcoin purchases.
Figure 11: MARA Stock Price and Outstanding Shares Display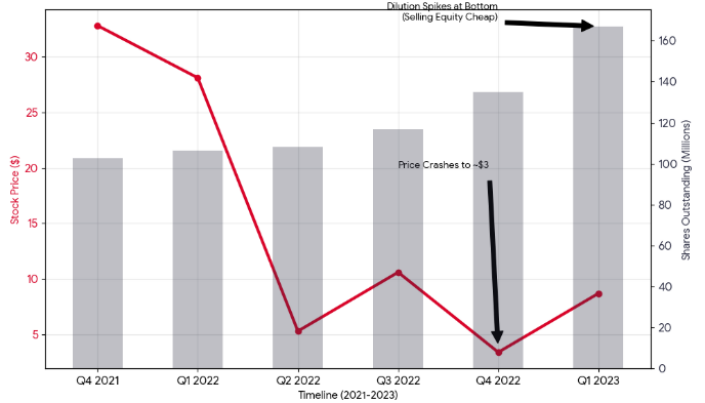
Source: Yahoo Finance Historical Data, SEC
Even in the extreme environment of Bitcoin's crash in 2022, where stock premiums nearly vanished, MARA persisted in continuous issuance to secure liquidity. While this approach preserved the company's ongoing operational eligibility, the original shareholder equity was thoroughly diluted. Data shows that in the fourth quarter of 2022, despite the stock price having dropped 95% from its 2021 peak, the number of outstanding shares surged against the trend: from 116 million in the previous quarter to 135 million, and further expanding to 167 million in the subsequent quarter, a year-on-year increase of nearly 60%.
Figure 12: Comparison of MARA Stock Price and Monthly Trading Volume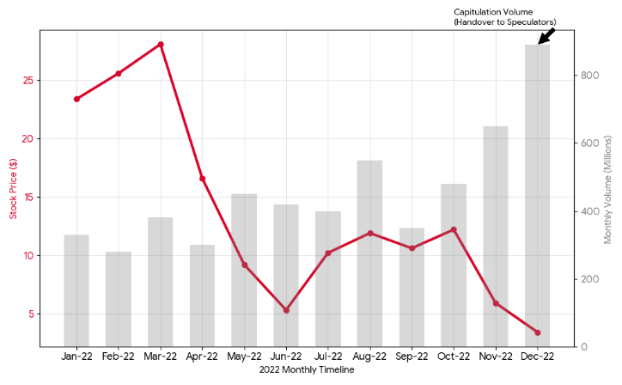
Source: Yahoo Finance Historical Data
The cost of this "exchanging equity for assets" is a complete overhaul of the shareholder structure. Most long-term shareholders chose to cut their losses and exit, replaced by high-frequency trading algorithms, market makers, quantitative funds, and speculative retail investors. The massive trading volume recorded at the end of 2022 is a true reflection of this reshuffling of the shareholder structure. The case of MARA shows that in a down cycle where debt financing capabilities are lacking, equity financing, while being the last lifeline, comes at the cost of sacrificing per-share value and the interests of long-term shareholders.
8. Sustainability Analysis and Trend Outlook for DAT Companies
8.1. Sustainability Judgment Framework for DAT Companies: Premium Window, Cash Buffer, Debt Maturity and Terms
Looking back at past cycles, many companies' failures did not begin with falling asset prices but rather with mismatches between debt maturity and cash flow capacity: price retractions turned "paper volatility" into "funding constraints," ultimately evolving into passive asset disposals and comprehensive credit contractions. Therefore, the most effective way to judge whether a DAT company can operate across cycles is not by the size of its holdings but by three hard constraints—premium, cash, and financing terms.
First, Premium Window: mNAV determines the speed of balance sheet expansion and whether financing is sustainable. mNAV is not just a valuation indicator; it directly reflects the economic viability of equity refinancing. When mNAV is significantly above 1, the company can issue equity instruments at relatively favorable prices, converting external funds into new assets, thus maintaining the pace of balance sheet expansion; when mNAV approaches 1 or even turns into a discount for an extended period, continued issuance often leads to dilution for existing shareholders, and the marginal returns on financing significantly decrease, naturally shifting expansion towards conservatism. Additionally, as compliant holding tools like spot ETFs gradually become more widespread, the market's tolerance for DAT premiums increasingly relies on information disclosure, governance quality, and execution discipline, rather than solely on the narrative of "scarcity of compliant channels."
Second, Cash Buffer: The ability to cover interest and necessary expenses is more critical than the book value of assets. The role of cash is not to increase returns but to ensure that the company can maintain operational safety when financing windows close or during extreme market conditions, and to meet interest and necessary expenses on time. For DAT, the core test of "survival" often occurs after a period of adverse market conditions—specifically, whether there is still enough cash and available credit to cover fixed expenses, and whether the company will be forced to dispose of core assets at low prices due to interest and operational pressures. The availability of cash and credit determines whether the company passively responds during downturns or maintains an active stance.
Third, Maturity and Terms: Does the debt leave the company with time to recover? Debt risk arises not only from interest rate levels but also from concentrated maturities, deteriorating refinancing conditions, and whether there are triggers for liquidation or forced disposals: (1) The pressure from ordinary debt mainly comes from interest accumulation and uncertainty regarding refinancing at maturity; (2) Convertible bonds may lose their conversion expectations during sideways or down phases, thus presenting pressures closer to "mandatory repayment at maturity." The maturity structure and trigger terms often determine whether a company can weather a downturn or is forced to dispose of core assets at low prices.
In summary, more resilient DATs often share two common traits: first, they avoid collateralized loans with mandatory disposal triggers on the liability side, relying more on unsecured convertible bonds or equity financing to ensure that the right to dispose of core assets is not squeezed by terms; second, on the cash flow side, they either have a continuous supply from core business operations or lock in longer-term, lower-cost funding in favorable environments, ensuring that interest expenses do not quickly consume cash. Ultimately, the long-term competitiveness of DATs is more reflected in their financial management capabilities: precise control over capital costs, maturity structures, and liquidity.
8.2. Trend Outlook: Shifting from Expansion Narrative to Survival Test
As the industry fully enters a downturn cycle in 2026, DAT companies face survival tests. Based on their current survival status, this article provides the following four outlooks.
8.2.1. Core Proposition Restructuring: Shifting from Pro-Cyclical Expansion to Cross-Cycle Survival
The downturn since the second half of 2025 has shifted DAT's focus from "pro-cyclical balance sheet expansion" back to "cross-cycle operation." When cryptocurrency prices decline and valuation premiums contract simultaneously, the pressure on companies does not primarily stem from paper losses but from the combination of liquidity and terms constraints: interest expenses and maturity structures determine the elasticity of the funding chain, while tightening refinancing conditions can convert price volatility into the real risk of passive asset disposals. At this point, the dividing line in competition is not the size of holdings but whether the company can maintain operational space when valuations converge, and whether it can sustain operations during financing windows and avoid being forced to dispose of core assets at low prices.
Within this framework, sustainability judgments can be distilled into three more actionable questions: first, can cash and available funds cover fixed expenses for the foreseeable future, especially interest and necessary operating costs; second, is there a concentration of debt maturities, and are there trigger terms highly sensitive to price declines that could amplify risks during downturns; third, when mNAV begins to approach 1 or turns into a discount, does the company still have executable financing and asset management plans, rather than merely waiting for market reversals? Only when all three points are satisfied can a company qualify to "survive until the next window."
8.2.2. Valuation Model Transition: Scarcity of Premiums and Functional Pricing
The proliferation of spot ETFs has weakened DAT's role as a "compliant holding channel," making DAT's valuation premiums scarcer. If DAT companies wish to maintain market value premiums, they must provide elements that ETFs cannot easily replace: more credible financing organizational capabilities, clearer asset management discipline, and more verifiable risk control and information disclosure. The likely new normal for DAT companies is shorter premium windows and longer discount phases, with premiums more likely to stabilize only for companies whose governance, custody, disclosure, and financing discipline are continuously recognized by the market.
At the same time, even with similar underlying asset scales, different companies' mNAVs will diverge over the long term, as the market will directly factor in "company quality" into pricing: whether financing capabilities are reliable, whether decision-making is restrained, whether capital structures are robust, and whether execution is transparent will all translate into valuation differences. Companies lacking clear value-added paths and existing merely as "shadow ETFs" will see their premiums tend to disappear and more easily slide into discounts; whereas entities that can maturely handle terms, maturities, and tool selections, while continuously maintaining transparent disclosures and verifiable processes, are more likely to preserve their financing windows.
8.2.3. Underlying Asset Differentiation: Consensus Pricing of BTC and Strategic Returns of ETH
From an asset perspective, BTC-type DATs have the advantage of low explanation costs and a more unified pricing framework, making it easier to secure longer financing windows; during downturns, the market is relatively less skeptical of the underlying assets. However, their shortcomings are also more direct: the lack of native revenue paths makes companies more sensitive to financing rhythms and cycle judgments; if they finance and expand at high levels, followed by price retractions, the pressures of maturity and cash flow are more likely to concentrate and expose themselves. At the same time, strategy homogenization will compress management premiums, making stock prices more likely to degrade into amplified reflections of underlying asset volatility.
ETH-type DATs primarily derive their space from revenue and strategic choices, but this comes with higher compliance, disclosure, and execution requirements. The market will pay more attention to whether custody arrangements are clear, whether revenue sources are traceable, whether risk isolation is sufficient, and whether on-chain operations are verifiable. The more complex the assets, the higher the demands for transparency and process verifiability; the ability to clearly articulate and continuously deliver on "how assets are managed, how revenues are generated, and how risks are controlled" will directly determine their pricing space and financing availability.
8.2.4. Industry Endgame Simulation: Intensifying Matthew Effect and Tail-End Cleansing
DAT, as a capital market strategy, will not disappear, but the winning hand will shift from "whether one can continue to buy" to "whether one can maintain options under different market conditions."
As premiums become scarcer and financing more selective, scale and reputation will translate into real advantages: leading entities will find it easier to complete financing when windows open, more likely to secure longer funding terms, and better positioned to delay pressures through more robust tool combinations, thereby increasing cross-cycle survival rates. Conversely, tail-end companies that primarily rely on continuous issuance to maintain liquidity, even if they do not break in the short term, often do so at the cost of sacrificing per-share value, leading to frequent changes in shareholder structure, increased difficulty in valuation recovery, and ultimately making them more likely to be marginalized by the market.
Ultimately, companies that can traverse cycles are typically not the most aggressive expanders but those who are more restrained when premiums are high and more stable when premiums are low: financing rhythms do not excessively overdraw, and debt and cash flow management leave room for maneuver, while custody and on-chain operations remain transparent and verifiable. In the future, the market will use stricter terms and less emotional premium to continuously filter out a few DAT companies with long-term sustainability.
References
[1] Bitwise Asset Management & Hougan, M. (2025, October 17). Crypto Market Review (Q3 2025). Bitwise Investments.
[2] Owens, W. (2025, July 30). The rise of digital asset treasury companies (DATCOs). Galaxy. https://www.galaxy.com/insights/research/digital-asset-treasury-companies
[3] TechFlow. (2025, August 14). Future trends of cryptocurrency from the perspective of "coin-stock." Deep Tide TechFlow. https://www.techflowpost.com/zh-CN/article/27575
[4] Ma, M. (2025, December 4). Bubble burst? MSTR: A liquidity crisis more brutal than Bitcoin's crash. TradingKey.
[5] Core Scientific. (2022, March 7). Core Scientific announces preliminary 2021 financial results, 2022 operating guidance and February updates. Core Scientific Investor Relations
[6] The Block. (2022, July 5). Core Scientific sold 7,202 bitcoin in June, generating $167 million.
[7] Zhang, M. (2022, December 21). Core Scientific – Chapter 11 bankruptcy filing in-depth. Dgtl Infra.
免责声明:本文章仅代表作者个人观点,不代表本平台的立场和观点。本文章仅供信息分享,不构成对任何人的任何投资建议。用户与作者之间的任何争议,与本平台无关。如网页中刊载的文章或图片涉及侵权,请提供相关的权利证明和身份证明发送邮件到support@aicoin.com,本平台相关工作人员将会进行核查。


