Qinglan's Crypto Class is now in session! BTC's four cycles + dual perspectives on news, guiding you to catch the rhythm of the crypto world.
Alright, let's get straight to the point. We'll look from smaller cycles to larger cycles for clearer insights.
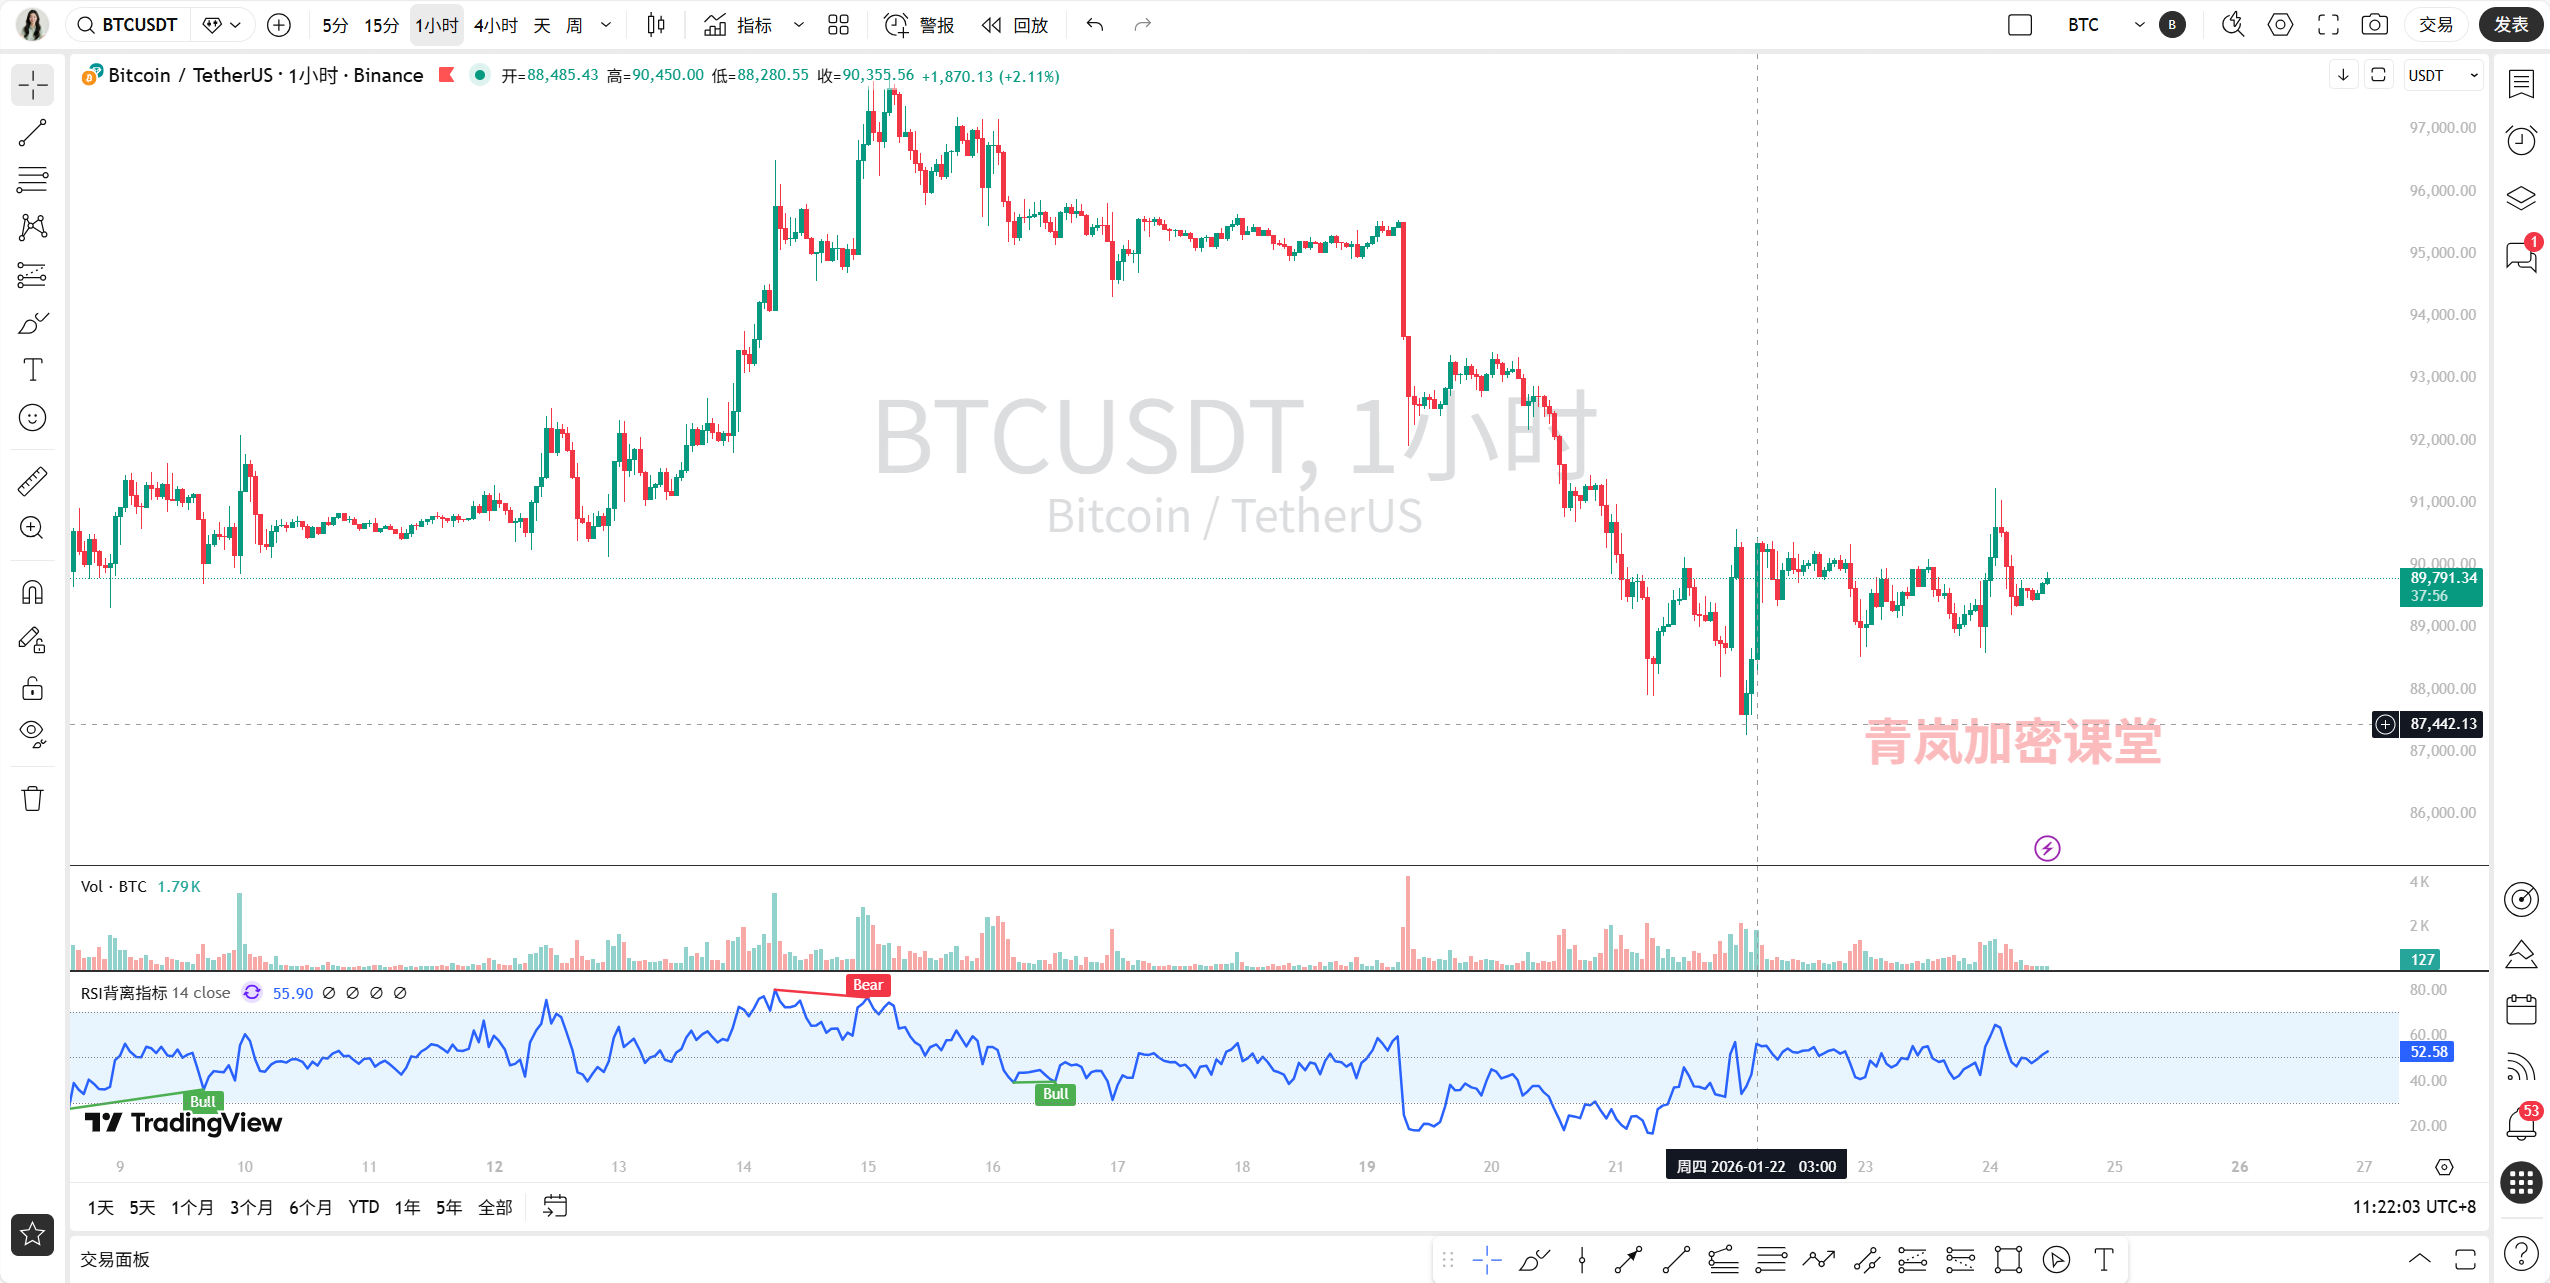
I. Technical Analysis: Multi-Cycle Resonance, Key Level Game
15-Minute Chart (Ultra Short-Term - Weak Fluctuation): The surge from 90,000 to 91,200 in the early morning now appears to be a "one-day trip" market. The price has been fluctuating down from the high point and is currently "bouncing around" in the small range of 89,500-90,000. On the indicators, after the MACD formed a death cross above the zero line, both the fast and slow lines have now crossed below the zero line, with the red bars still increasing; the RSI is weakly hovering below 50. This indicates that the bullish momentum in the ultra short term has exhausted, and the bears are temporarily in control. Watch closely for support at the previous small platform between 89,200-89,400; if it breaks, it may test lower support.
1-Hour Chart (Short-Term - Resistance to Rebound): The large bullish candle from yesterday morning (from 89,000 to 91,200) was indeed uplifting, but the subsequent candles have all shown a pattern of rising and falling, forming a "bearish engulfing" pattern. Currently, the price is suppressed below the MA20 moving average (around 89,600). Although the MACD has formed a golden cross, the fast and slow lines are flattening near the zero line, and the red bars are shortening, indicating a clear lack of rebound momentum. This cycle shows that the short-term rebound is facing strong resistance in the 90,500-91,000 area and needs to recharge.
4-Hour Chart (Medium-Term - Critical Decision Period): This is currently the most critical cycle! After the sharp drop on January 20, the price formed a descending channel. For the past few days, it has been fluctuating between the lower boundary of the channel (around 89,000) and the upper boundary (around 90,500). The good news is that the MACD's green bars have started to appear, and there are signs of a golden cross at the low, which is a potential bottom divergence signal (the price hasn't made a new low, while the indicators are strengthening). However, the bad news is that the price has consistently failed to effectively stay above the MA10 moving average (around 89,600). Therefore, the 4-hour level is in a critical decision window of "is it a bottoming rebound or a continuation of the decline." The 90,500-91,000 area is the core resistance zone that will determine whether the medium-term trend can be reversed.
Daily Chart (Long-Term - Trend Under Pressure): From a larger cycle perspective, since peaking at 97,000 on January 13, Bitcoin has entered a clear correction cycle. Currently, the price is operating below all major moving averages (MA5, MA10, MA20), which is a typical bearish arrangement. After the MACD formed a death cross at a high level, the green bars have continued to expand, indicating that the adjustment pressure is still being released. However, the RSI has fallen back to around 44, approaching a neutral to weak area, and the momentum for a significant drop has weakened. The strong support at the daily level is in the 88,000-87,000 area (near the previous low and long-term trend line), while 92,000-93,000 is the strong resistance that needs to be reclaimed above.
II. News Analysis: Ice and Fire Intertwined, Complex Emotions
On the news front, long and short factors are intertwined, and market sentiment is quite divided:
Bearish Factors: On-chain data shows that Bitcoin holders have experienced a net loss for the first time since October 2023, which is a warning sign indicating that some long-term holders are starting to exit or change hands. At the same time, the expectation for the Federal Reserve to cut interest rates has been pushed back to June, tightening macro liquidity expectations. The sharp drop on the day after BitGo's listing also reflects the cautious attitude of traditional capital markets towards crypto-related assets.
Bullish Factors: ARK Invest released a significant report, optimistic that Bitcoin's market value will reach $16 trillion by 2030, which is a long-term narrative. The SEC's withdrawal of the lawsuit against Gemini Earn is a small positive from a regulatory perspective. Additionally, spot gold and silver have reached historical highs, indicating strong global demand for safe-haven/inflation-resistant assets, which may spill over into Bitcoin.
Market Sentiment: Overall leaning towards "panic," the altcoin season index has dropped to 29, with funds clearly flowing back into Bitcoin. However, Bitcoin itself also lacks clear upward momentum, remaining in a state of "weak balance."
III. Comprehensive Forecast and Trading Ideas
Combining technical and news analysis, Qinglan's conclusion is: the market is in a "weak rebound within a downtrend" phase, with unclear short-term direction, but medium-term adjustment pressure has not been fully alleviated.
Trend Judgment:
Short-Term (Intra-day - Few Days): Weak fluctuation. There is heavy pressure above at 90,500-91,000, and support at 89,200-88,800 below. It is highly likely to continue fluctuating within this range, waiting for new catalysts.
Medium-Term (Few Weeks): Bottom-testing phase after the decline. The key is whether it can stabilize above 90,500 and break upwards. If not, it may test 88,000 again or even lower.
Long-Term (Monthly and Beyond): Deep correction within an upward trend. The structure of the bull market has not been destroyed, but it needs time and space to complete the adjustment.
Key Positions:
Core Resistance: 90,500 → 91,000 → 92,000 (layered increases, with increasing difficulty to break through)
Core Support: 89,200 → 88,800 → 88,000 (layered defenses, breaking below opens up downward space)
Trading Ideas (For Educational Reference Only):
Aggressive Traders (Short-Term): Can try to go long lightly in the support area of 89,200-89,500, with strict stop-loss below 88,800, targeting 90,500. Alternatively, can try to short lightly in the resistance area of 90,500-90,800, with stop-loss above 91,200, targeting 89,500. Remember, this is a range fluctuation strategy, quick in and out, do not linger in battle.
Conservative Traders (Medium to Long-Term): It is recommended to continue observing, with more watching and less acting. Wait for the market to provide clearer signals. The ideal right-side long opportunity requires waiting for the price to effectively stabilize above 91,000 with volume, or for a daily-level bottom divergence structure to appear. The ideal left-side layout opportunity requires the price to drop to the strong support area of 87,000-88,000 and show signs of stabilization.
Position Management: Given the current high uncertainty in the market, it is essential to strictly control positions, with a total position recommended not to exceed 30%. Avoid heavy bets when the direction is unclear.
For more quantitative breakdowns of how real-time news affects market sentiment, it has been updated in my Qinglan Crypto Class, www.qinglan.org.
Finally, I’ll leave you with today’s insight: “In a fluctuating market, it’s not about who sees more accurately, but who has more patience. Don’t trade in markets you don’t understand, and don’t hold onto capital you can’t protect; the market will always reward those disciplined hunters.”
Alright, that’s it for today’s analysis. The market changes rapidly, so we must stay vigilant and respond flexibly. I am Qinglan, see you next time!
免责声明:本文章仅代表作者个人观点,不代表本平台的立场和观点。本文章仅供信息分享,不构成对任何人的任何投资建议。用户与作者之间的任何争议,与本平台无关。如网页中刊载的文章或图片涉及侵权,请提供相关的权利证明和身份证明发送邮件到support@aicoin.com,本平台相关工作人员将会进行核查。