Qinglan Crypto Class is starting! BTC's four cycles + news perspective, guiding you to step in sync with the crypto market rhythm.
I. Technical Analysis: Multi-cycle Resonance, Intense Battle for Key Levels
Let's start from the small cycles and move to the larger cycles for clearer context.
- Short-term (15 minutes & 1 hour): Consolidation at the bottom, attempting a rebound
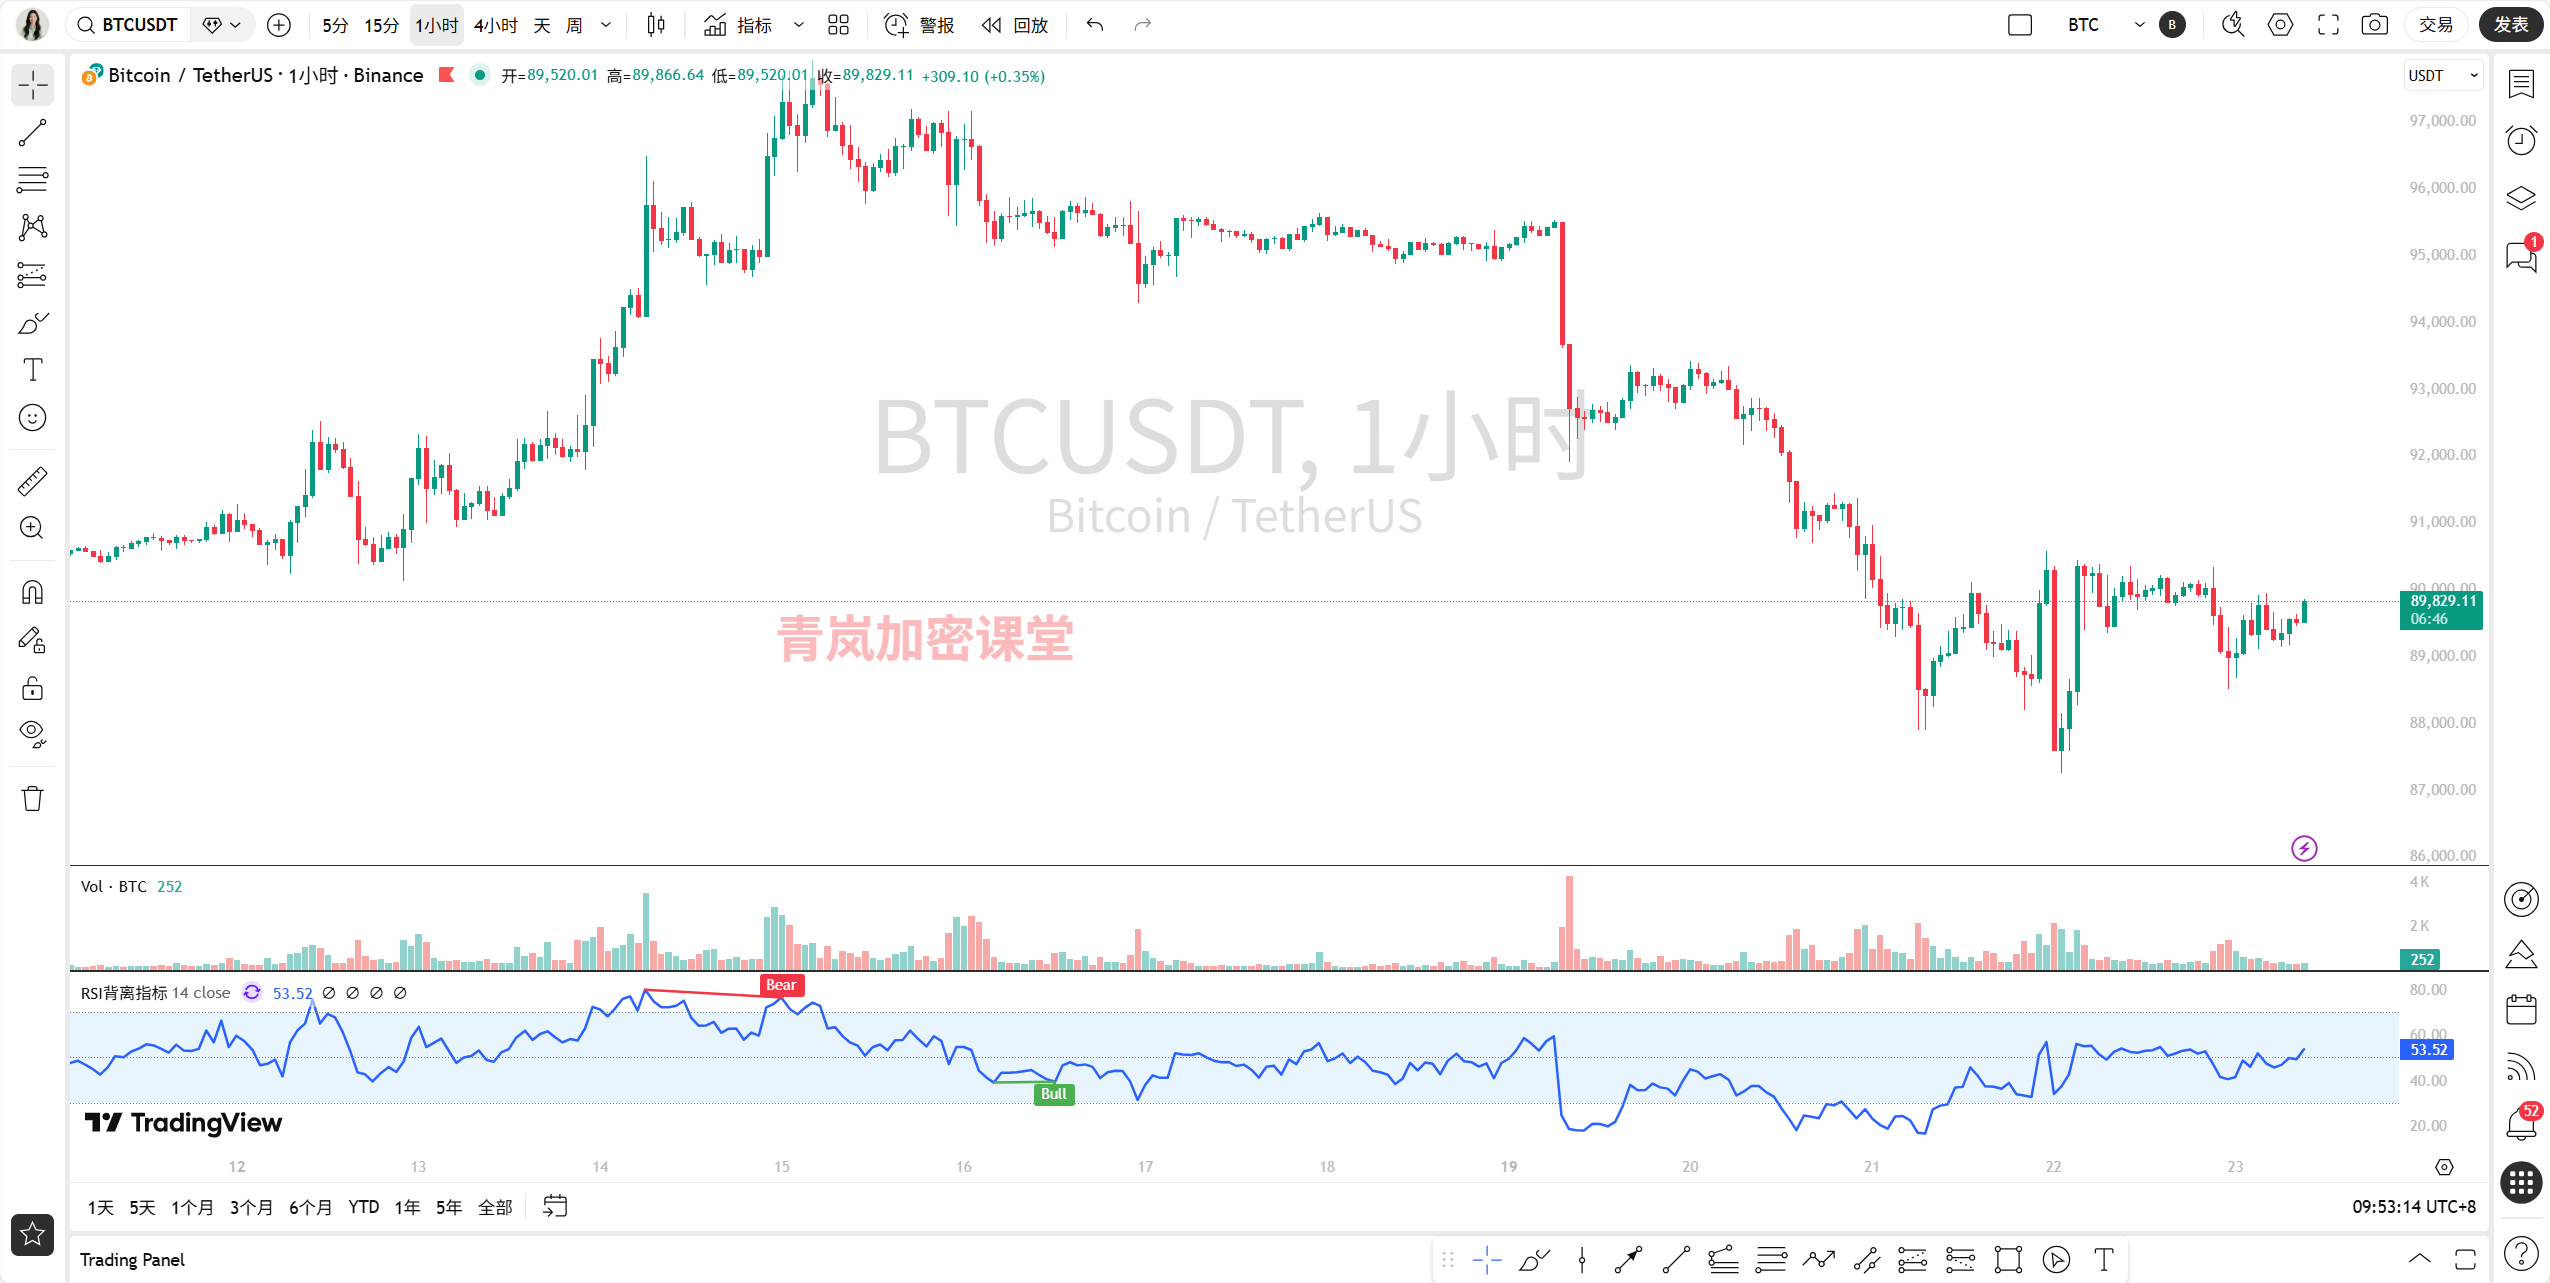
Trend: The sharp drop from 90300 to 88600 at 21:30 last night damaged the short-term structure. However, after the drop, the price lingered between 88600-89600 for several hours, forming a small platform on the 1-hour chart. From midnight until now, the price has been attempting to push upwards, especially after 9 AM today, with consecutive bullish candles on the 15-minute chart, and the price has regained above 89600.
Indicators: The 15-minute MACD formed a golden cross below the zero line, and the fast line (DIF) has crossed above the zero line, which is a positive short-term signal. Although the 1-hour MACD is still underwater, the green bars are starting to slightly increase, and the fast and slow lines show signs of flattening and merging, indicating a weakening of the downward momentum. The RSI has also climbed back from the oversold zone (below 30) to around the neutral area of 50.
Key Levels: The short-term support is around last night's low of 88600, which is the last line of defense for the bulls. The resistance level to watch is the psychological barrier of 90000, and above that is the area of 90300-90500 (the starting point of yesterday's sharp drop).
- Mid-term (4 hours): Downward trend slowing, but not reversed
Trend: The 4-hour chart shows more clearly that since peaking at over 97000 on January 14, it has been in a standard descending channel. The price has been pressured by the MA20 (currently around 90200). Recently, several candlesticks have repeatedly tested around 89000 without making new lows, indicating a potential halt in the decline.
Indicators: The green bars (negative values) of the 4-hour MACD are continuously shortening, and the fast and slow lines show signs of flattening or even turning in the deep water area, which is a potential bottom divergence that needs price confirmation to rise. The RSI is hovering around 35, having moved away from deep oversold conditions.
Key Levels: The core mid-term resistance is at the upper boundary of the descending channel and the MA20 moving average, approximately in the 90200-90500 area. If it can break through here with volume, the mid-term downward trend may pause. Strong support below is at 88000 (previous low area).
- Long-term (Daily): Deep pullback in an upward trend
Trend: The daily chart shows the largest pattern. Since the low point at the end of November last year, this bull market trend has not been broken. However, the recent week-long pullback has caused the price to fall below the short-term moving averages (MA5, MA10), testing a more critical support level—the MA20 (currently around 92300) and the upward trend line. Today's candlestick is currently a small bullish candle, showing signs of stabilizing.
Indicators: After the MACD on the daily chart formed a death cross at a high level, the red bars are still expanding, indicating that the adjustment cycle has not ended. The RSI has fallen from the overbought zone back to around 50, which is within a healthy pullback range.
Key Levels: The long-term bull-bear dividing line is in the wide range of 88000-90000. As long as the daily close does not effectively fall below 88000, the overall trend remains intact. To regain strength, it must reclaim 93000.
II. News Perspective: Mixed Sentiment, Cautious Mood
On the news front, today is a "tale of two extremes":
Bearish: The most eye-catching news is about "quantum computing threatening Bitcoin's security," stating that over 30% of BTC is at risk, which has triggered deep concerns in the market. Additionally, BlackRock transferred $600 million worth of BTC and ETH to Coinbase, which may be an institutional reallocation, but combined with the outflow of funds from its ETF, it inevitably raises market speculation.
Bullish/Neutral: Coinbase has established a quantum computing committee to assess risks, which is a positive response. BitGo's successful listing (although it surged and then fell on the first day) indicates traditional capital markets' recognition of crypto infrastructure. Furthermore, Trump is set to announce the Federal Reserve chair nominee (speculated to be a BlackRock executive), and the news of Ripple collaborating with banking giant DXC are long-term positives for the industry.
Summary: Overall, the news sentiment is bearish, especially the "long-term threat" of quantum computing and the "recent actions" of institutions, which suppress market risk appetite. However, industry infrastructure and development are still progressing.
III. Comprehensive Forecast and Trading Strategy
Combining technical and news perspectives, Qinglan's conclusion is: a short-term oversold rebound is expected, but mid-term adjustment pressure remains, with the 90000 level being the "line of life and death."
- Trend Judgment:
Short-term (1-3 days): Consolidation biased towards bullish. Technically, there is a demand for an oversold rebound, with stabilization signals appearing on the 15-minute and 1-hour charts.
Mid-term (1-2 weeks): Consolidation biased towards bearish. The 4-hour downward trend has not been broken, the daily adjustment has not ended, and combined with bearish news pressure, a direct V-shaped reversal is difficult.
Long-term (1 month or more): Pullback in an upward trend. As long as key support is not broken, the bull market logic remains unchanged.
- Key Positions:
Core Support: 88600 (short-term lifeline) -> 88000 (mid-term bull-bear dividing line).
Core Resistance: 90000 (psychological barrier) -> 90200-90500 (4-hour trend line & MA20) -> 93000 (daily strength dividing line).
- Trading Strategy (for reference):
Aggressive Long Position: At the current price (around 89700), take a small position to go long, with a strict stop loss below 88600. The initial target is 90000, and if broken, look for 90300-90500. This trade is for a short-term rebound, aiming for quick entry and exit.
Conservative Long Position: Wait for the price to break through and stabilize above 90500, then enter on a pullback confirmation, with a stop loss at 89500. Alternatively, wait for the price to stabilize again in the support area of 88000-88500, with a stop loss at 87500. These two positions offer a better risk-reward ratio.
Short Position Strategy: In the resistance area of 90200-90500, if there are clear signs of stagnation (such as upper shadows or volume-price divergence), a small short position can be taken, with a stop loss above 91000, targeting a return to 89200-89500. Remember, the risk of chasing a short position at this level is greater than that of going long.
For more quantitative analysis on how real-time news affects market sentiment, it has been updated in my Qinglan Crypto Class, www.qinglan.org.
Finally, I’ll leave you with today’s insight: “The pits created by the market in panic are often filled in hesitation. Don’t be scared during a sharp drop, and don’t be greedy at the beginning of a rebound; rhythm is more important than direction.”
Alright, that’s it for today’s analysis. The market is lingering, and we must keep our hands steady and maintain patience. If you have any questions, see you in the comments!
免责声明:本文章仅代表作者个人观点,不代表本平台的立场和观点。本文章仅供信息分享,不构成对任何人的任何投资建议。用户与作者之间的任何争议,与本平台无关。如网页中刊载的文章或图片涉及侵权,请提供相关的权利证明和身份证明发送邮件到support@aicoin.com,本平台相关工作人员将会进行核查。


