Original Title: Failed Breakout
Original Authors: CryptoVizArt, Chris Beamish, Antoine Colpaert, Glassnode
Original Compilation: AididiaoJP, Foresight News
As we enter early January 2026, the market shows signs of seller exhaustion, creating an opportunity for prices to rebound towards the upper range of the current trading zone. However, this rebound comes with higher risks, as prices approach the area around $98,000, where recently bought investors have formed active "break-even" selling pressure near their cost basis.
Core Insights
· On-chain structure remains fragile: Prices hover near key cost basis levels, lacking sustained confirmation of strong conviction from long-term holders.
· Ongoing supply surplus issue: Recently bought investors face resistance above, limiting the sustainability of upward movements and making any rebound susceptible to sell-offs.
· Spot fund flows trend positively: Selling pressure from major trading platforms has eased, but buying behavior remains selective rather than broadly initiated.
· Treasury fund inflows are sporadic: Treasury activities exhibit sporadic, event-driven characteristics, failing to form a coordinated buying trend, thus having limited impact on overall demand.
· Low participation in the derivatives market: Futures trading volume has shrunk, and leverage usage is cautious, with the market in a state of low participation.
· Options market only under short-term pressure: Short-term implied volatility reacts to risk events, while mid to long-term volatility remains stable.
· Hedging demand briefly heats up before returning to normal: The spike in put/call volume ratio has calmed down, indicating that risk aversion is tactical.
· Traders' gamma positions are bearish: This weakens mechanical support for price stability and increases market sensitivity to liquidity shocks.
On-Chain Deep Analysis
In the past two weeks, the anticipated technical rebound has largely materialized, with prices stagnating below the cost basis of short-term holders after hitting resistance, reaffirming substantial selling pressure above. This report will focus on analyzing the structure and behavior of this "hanging top" supply, revealing emerging seller dynamics.
Technical Rebound Encounters Resistance
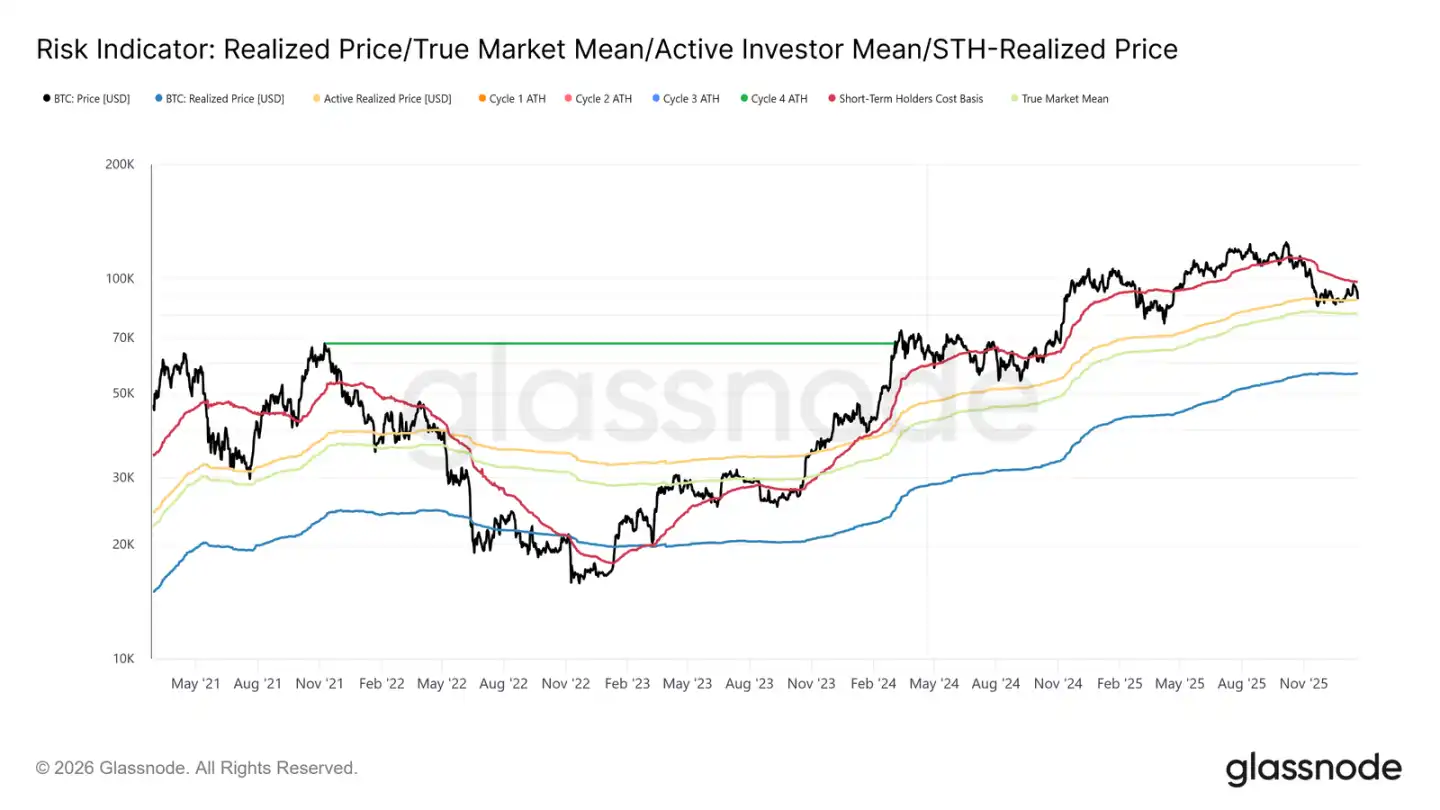
A clear narrative has formed: the market has been in a mild bear phase. The downward bottom is supported by the real market average of $81,000, while the upward top is constrained by the average cost of short-term holders. This range creates a fragile balance, where downward pressure is absorbed, but upward attempts are repeatedly met with sell-offs from investors who bought between Q1 and Q3 of 2025.
As we enter early January 2026, the weakening of seller power opens a window for prices to rebound towards the upper range. However, as prices approach the area around $98,000, the selling willingness of recently bought investors near their cost basis increases, heightening the risk of this rebound.
Recent prices have faced resistance around $98,400 (the cost basis of short-term holders), mirroring the market structure of Q1 2022. At that time, the market repeatedly failed to effectively break through the cost area of recent buyers, leading to an extended consolidation period. This similarity highlights the fragile nature of the current recovery attempt.
Supply "Hanging Top" Pressure Remains
Based on the observation of price resistance at key cost levels, a further examination of on-chain supply distribution can more clearly explain why upward momentum is repeatedly thwarted.
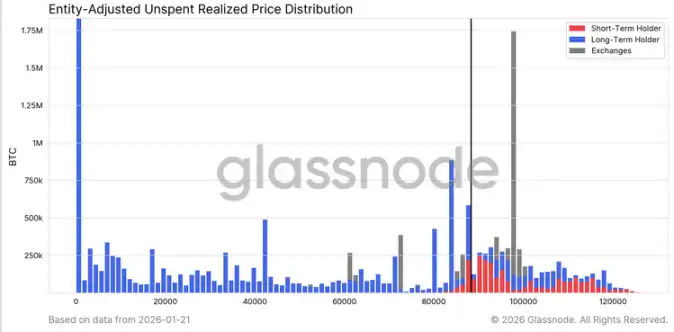
The URPD (Unrealized Profit/Loss Distribution) chart clearly reveals why the surplus supply above $98,000 remains a major force suppressing mid to short-term rebounds. The recent rebound partially filled the "vacuum" between $93,000 and $98,000, primarily due to early buyers transferring to new entrants, forming a new cluster of short-term holder supply.
However, the supply distribution above $100,000 shows a broad and dense supply zone, with this portion of tokens gradually converting into long-term holder positions. This unabsorbed "hanging top" supply is a continuous source of selling pressure, likely keeping prices below $98,400 (the short-term holder cost line) and the psychological barrier of $100,000. Therefore, to achieve an effective breakout, demand momentum needs to accelerate significantly and sustainably.
Long-Term Holders Also Constitute Resistance
Expanding the perspective from short-term holders to long-term holdings, we find that the same structural constraints still exist.
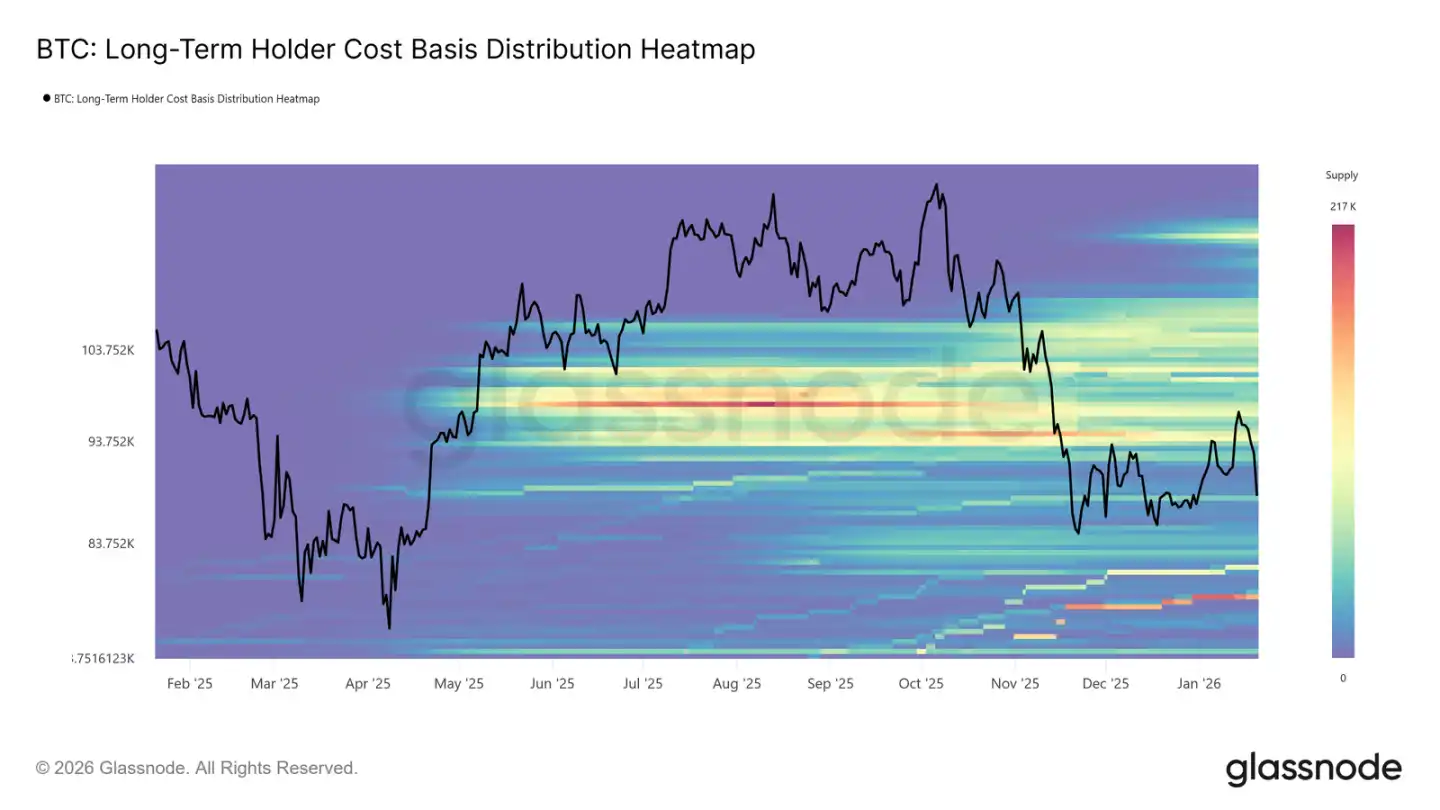
The heatmap of long-term holder cost basis distribution shows a dense long-term holding cost area above the current spot price. When prices rebound to these historical buying levels, this area represents a significant potential selling liquidity.
Until new, sufficiently strong demand emerges to absorb this upper supply, long-term holders will always be a potential source of resistance. Therefore, unless this "hanging top" supply is fully digested, upward space may continue to be limited, and any rebound is likely to encounter new sell-offs.
Rebound Encounters Profit-Taking and Stop-Loss Sell-Offs
Furthermore, we can identify which groups of investors have been actively cashing out (either for profit or stop-loss) during the recent rise towards around $98,000, thereby suppressing prices.
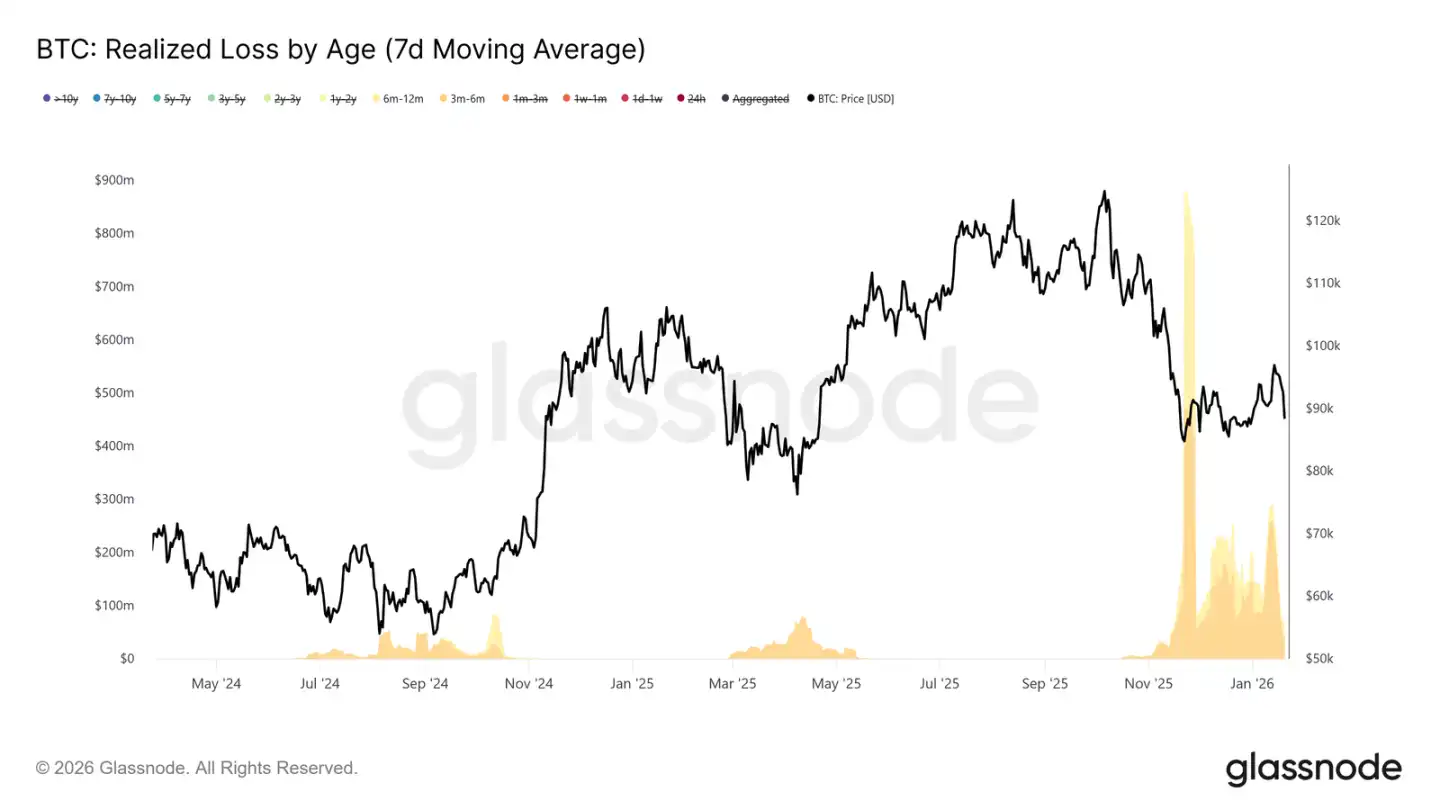
Data on realized losses categorized by holding duration shows that loss sell-offs mainly come from the group holding for 3-6 months, followed by holders for 6-12 months. This pattern is a typical characteristic of "painful sell-offs," especially common among those who bought above $110,000 and now choose to exit as prices approach their cost line. This behavior reinforces selling pressure near key recovery price levels.
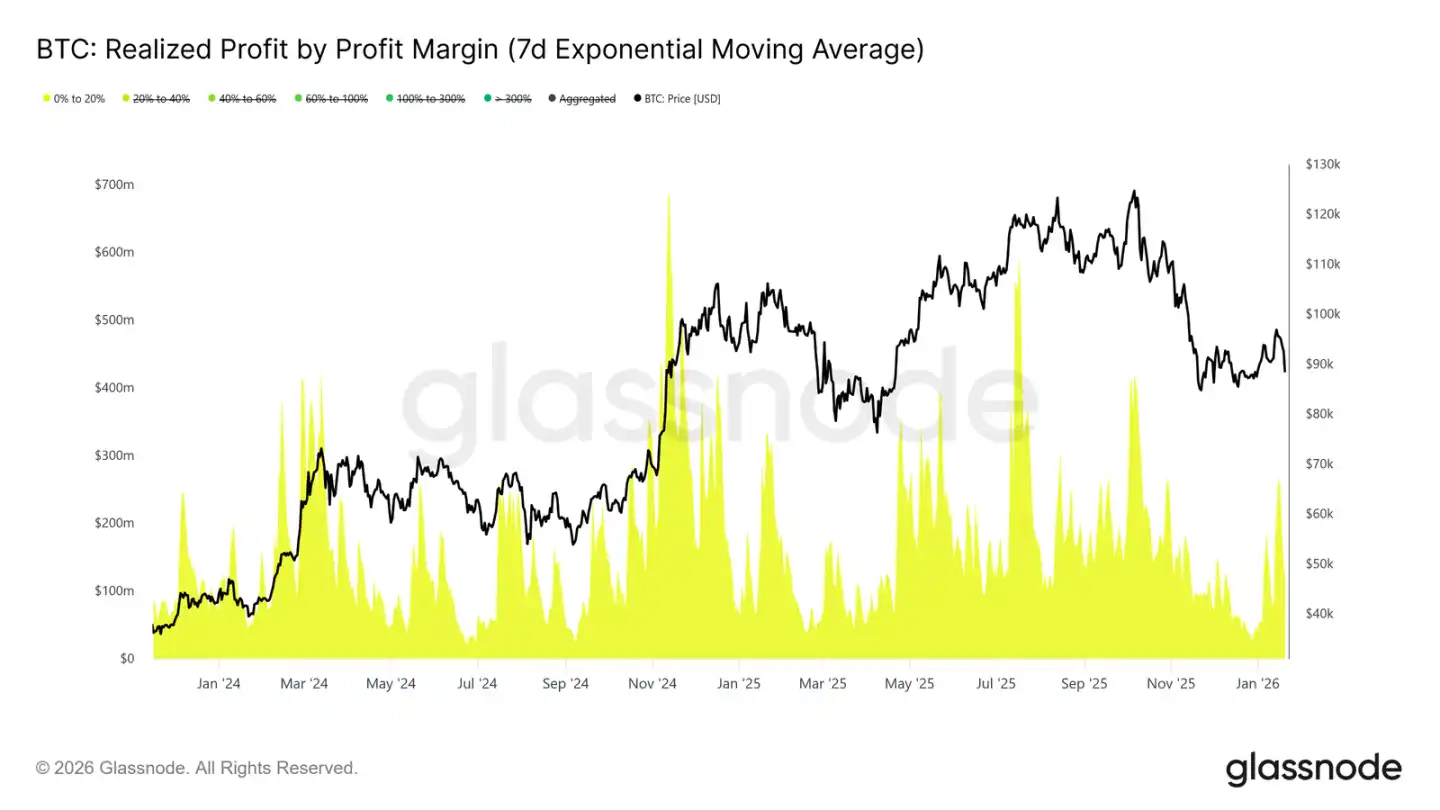
Meanwhile, data on realized profits categorized by profit margin indicates a significant increase in profit-taking within the 0% to 20% margin range. This highlights the influence of "break-even sellers" and short-term swing traders, who tend to exit with small profits rather than waiting for trend continuation.
This behavior is common during transitional market periods, where investor conviction is weak, and there is a greater focus on capital preservation and tactical profit-taking. The increase in low-profit sell-offs continuously undermines upward momentum, as supply continues to be released near the cost basis.
Off-Chain Market Observations
Spot Fund Flows Trend Positive
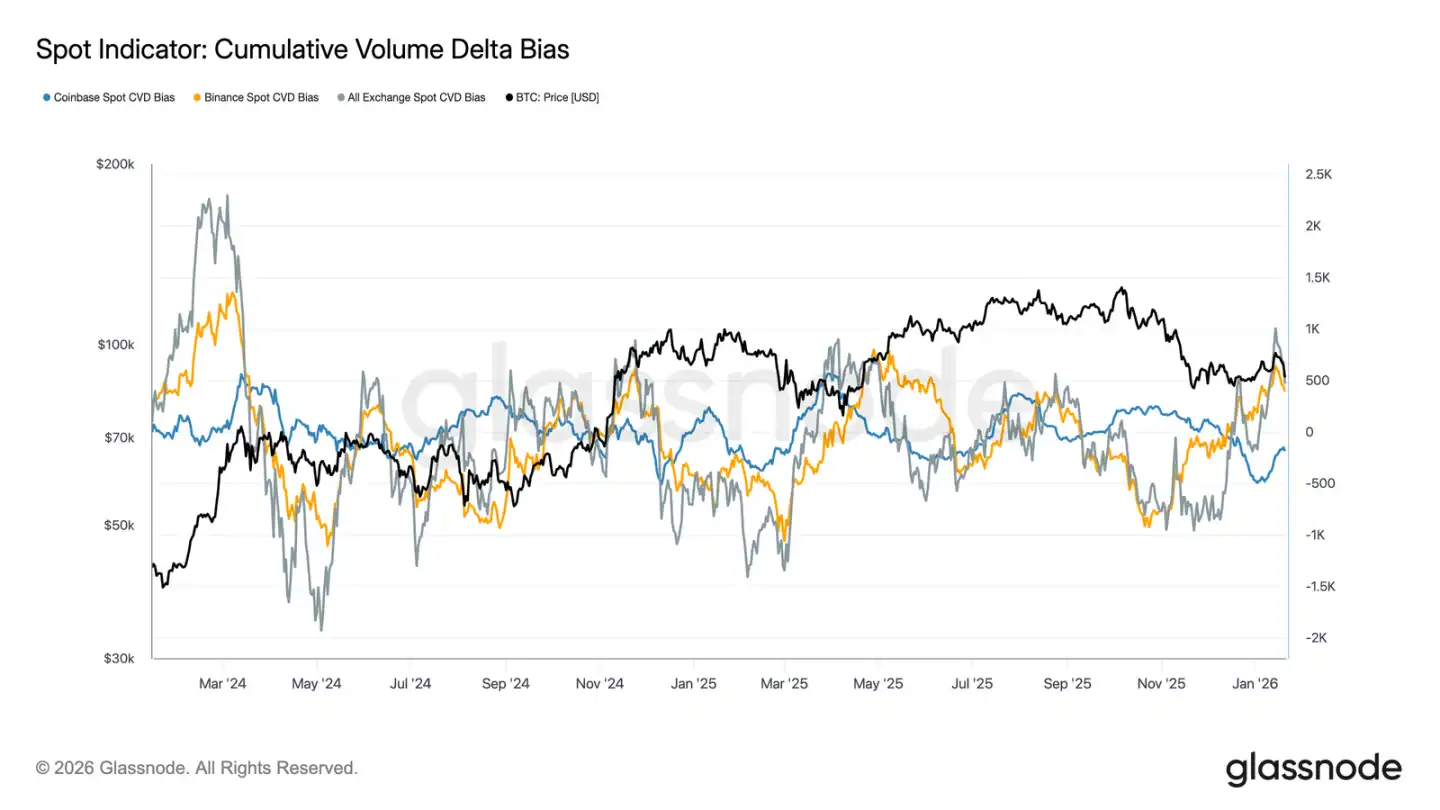
Spot market behavior has improved following recent declines. The CVD (Cumulative Volume Delta) indicator from Binance and other trading platforms has returned to a net buying state, indicating that spot participants are beginning to absorb chips again rather than selling at highs, contrasting with the sustained selling pressure during the previous consolidation period.
Previously a major source of selling pressure during the range-bound phase, Coinbase's net selling speed has also significantly slowed. The reduction in selling pressure from Coinbase helps to decrease upper supply, stabilize price movements, and support the recent rebound.
Although spot participation has not yet entered a phase of sustained, aggressive buying typical of trend expansions, the major platforms' return to net buying marks a positive improvement in the underlying spot market structure.
Digital Asset Treasury Fund Inflows Remain Sporadic
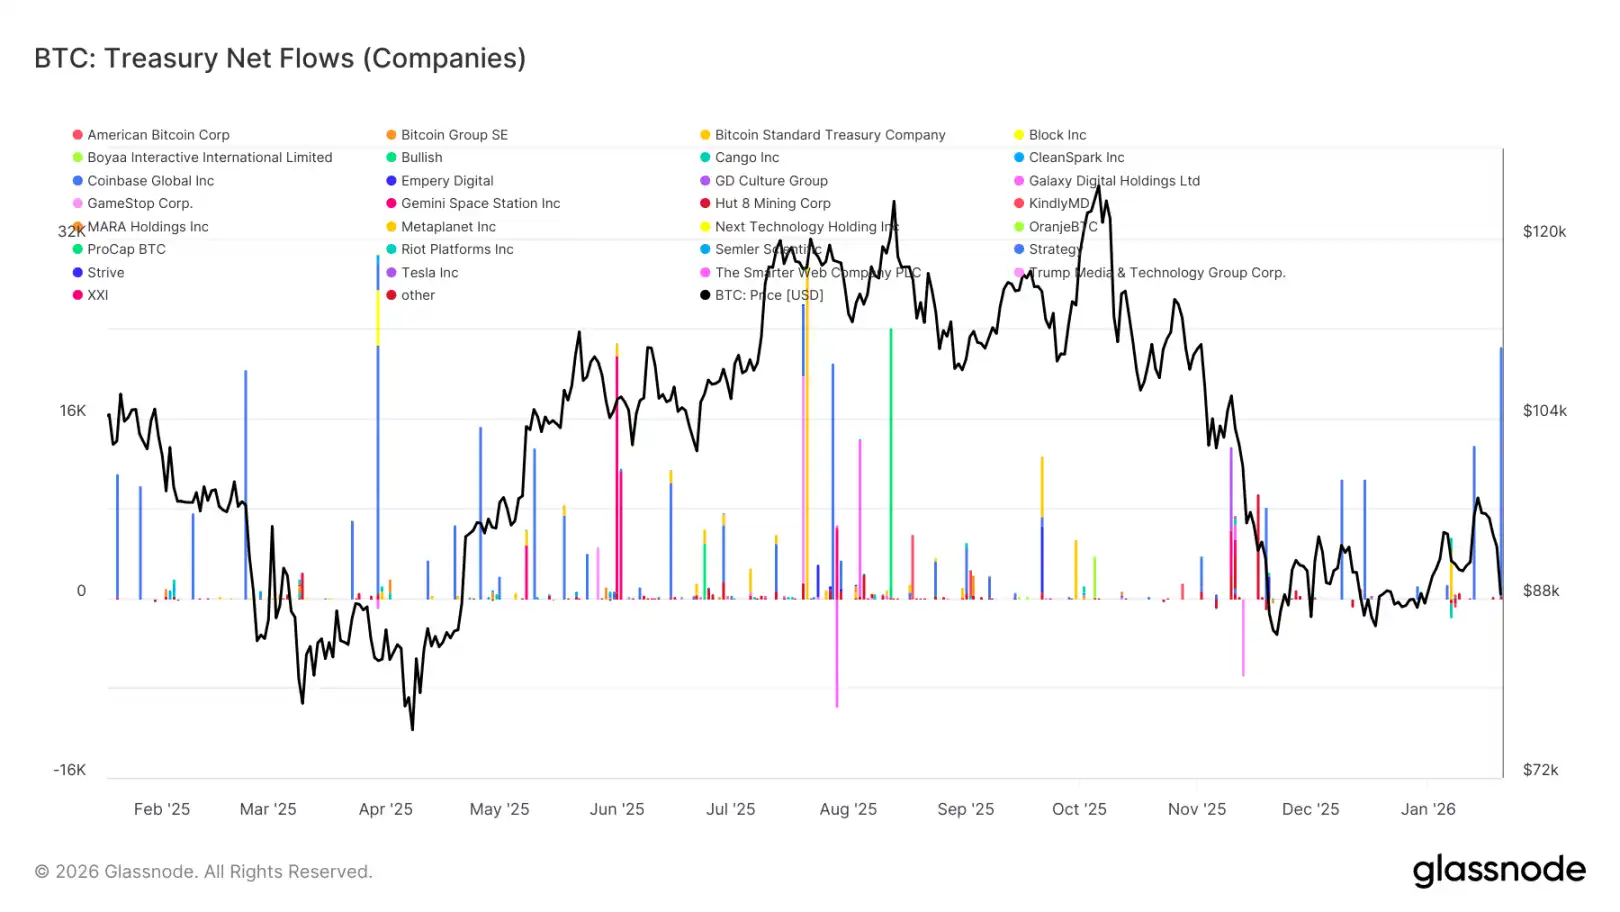
Recent net fund flows into digital asset treasuries continue to exhibit sporadic and uneven characteristics, driven more by isolated events than widespread trend-based buying. While a few companies have seen significant buying spikes in recent weeks, overall corporate demand has not entered a sustained accumulation mode.
Overall, digital asset treasury fund flows fluctuate narrowly around the zero line, indicating that most corporate treasuries are currently in a wait-and-see or opportunistic operation state rather than systematically increasing their holdings. This sharply contrasts with earlier phases where multiple companies coordinated buying to accelerate trends.
In summary, the latest data shows that corporate treasuries are merely marginal, selective sources of demand, with intermittent impacts that have yet to play a decisive role in overall price dynamics.
Derivatives Market is Quiet
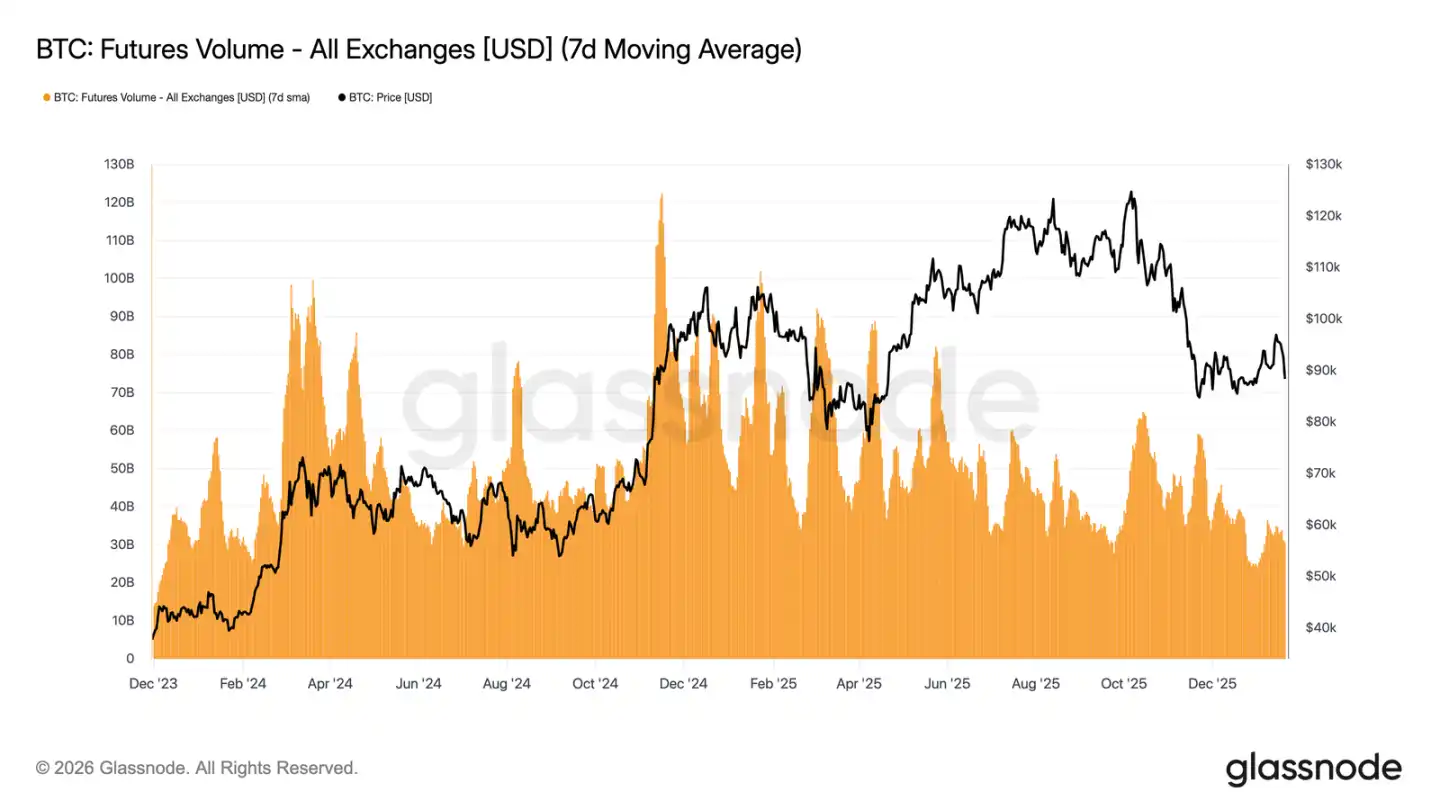
The 7-day moving average trading volume of Bitcoin futures continues to shrink, far below levels typically associated with trending markets. Recent price fluctuations have not been accompanied by effective volume expansion, highlighting low participation and lack of confidence in the derivatives market.
Current market structure indicates that recent price movements are driven more by sparse liquidity than by aggressive position layouts. Adjustments in open interest have not been accompanied by synchronized increases in volume, reflecting more the adjustment of existing positions and risk rebalancing rather than the introduction of new leverage.
In conclusion, the derivatives market is currently in a low participation "quiet" state, with scant speculative interest. This "ghost market" characteristic suggests that the market may be very sensitive to any rebound in trading volume, but currently, its influence on price discovery is limited.
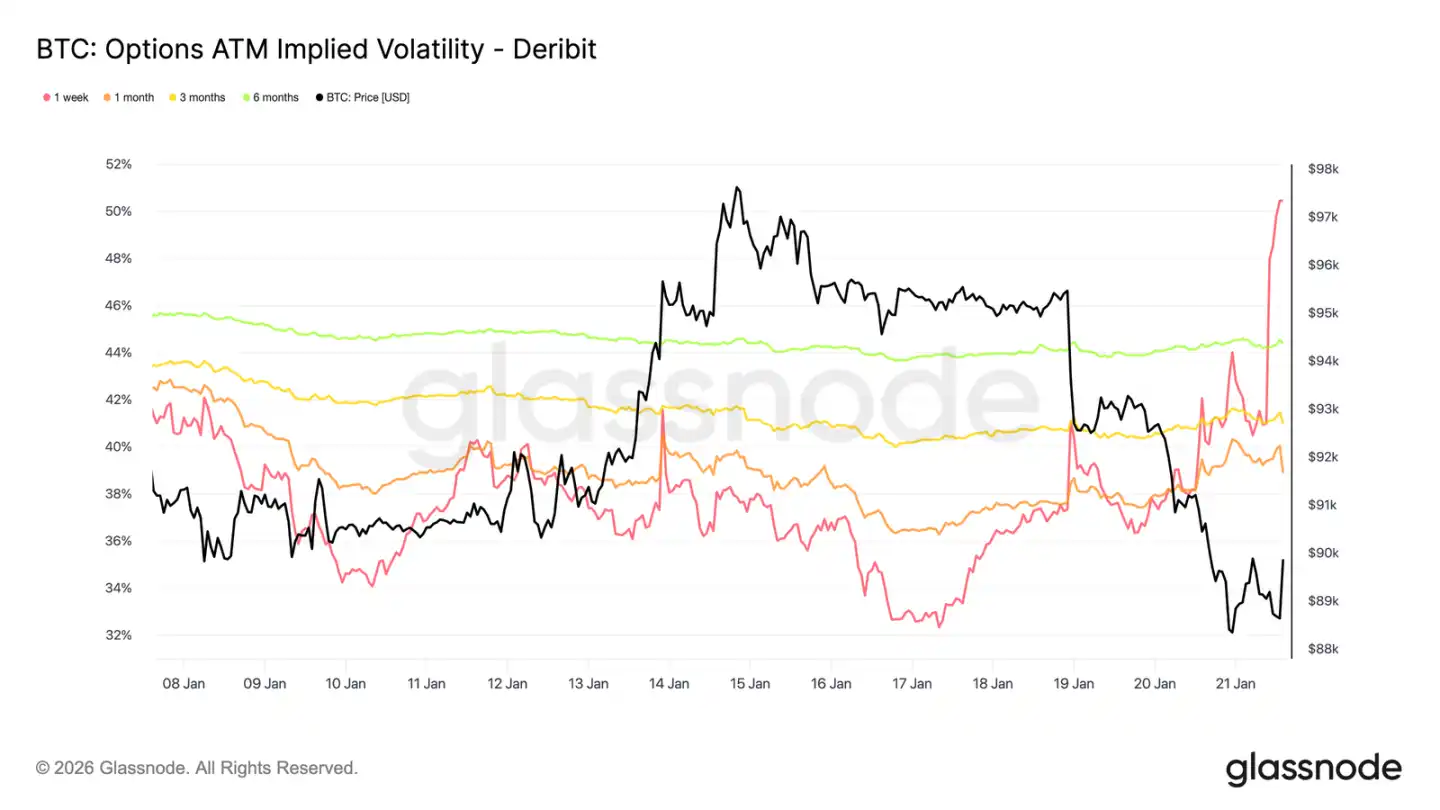
Implied Volatility Only Jumps in the Short Term
The spot sell-off triggered by macro and geopolitical news has only stimulated a rise in short-term volatility. Since the drop on Sunday, one-week implied volatility has risen by over 13 volatility points, while three-month implied volatility has only increased by about 2 points, and six-month implied volatility has hardly moved.
The sharp steepening of the volatility curve at the front end indicates that traders are engaging in tactical operations rather than reassessing mid-term risk structures. Only short-term volatility adjustments reflect event-driven uncertainties, rather than a shift in the entire volatility system.
The market is pricing for short-term risks rather than enduring turmoil.
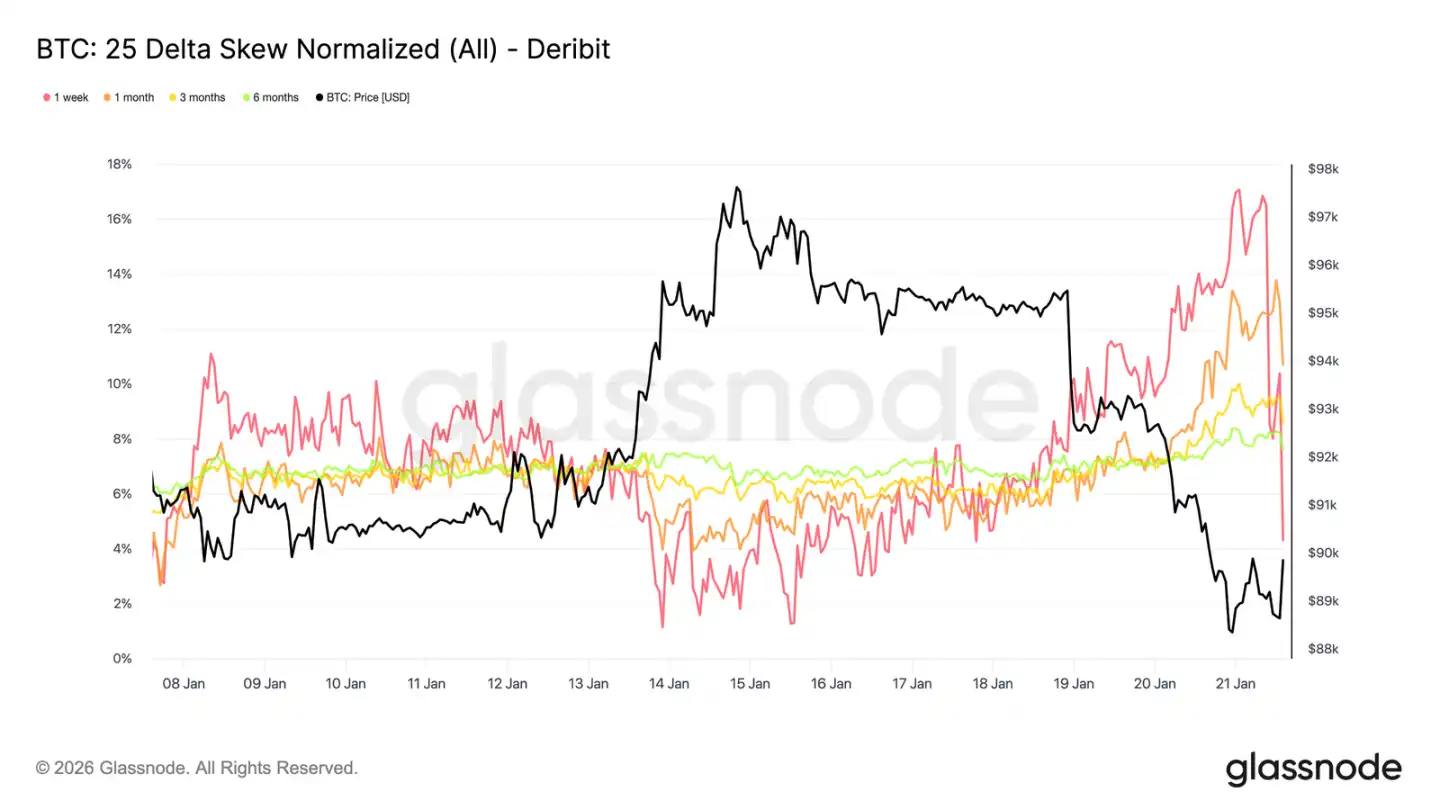
Short-Term Options Skew Volatility Fluctuates Wildly
Similar to at-the-money volatility, short-term skew has also dominated this adjustment. The one-week 25 delta skew, which was close to equilibrium a week ago, has sharply turned into a state where "put options are more expensive."
Since last week, the skew indicator has moved approximately 16 volatility points towards puts, reaching a put premium of nearly 17%. The one-month skew has also reacted, while longer-term skews, which were already in the put zone, have only slightly deepened this time.
Such a sharp skew typically accompanies localized extreme market conditions, where positions are crowded and difficult to sustain the original trend. After the market digested the impact of comments related to the Davos Forum, the premium in the downward direction has been partially realized, and the skew has begun to retract rapidly.
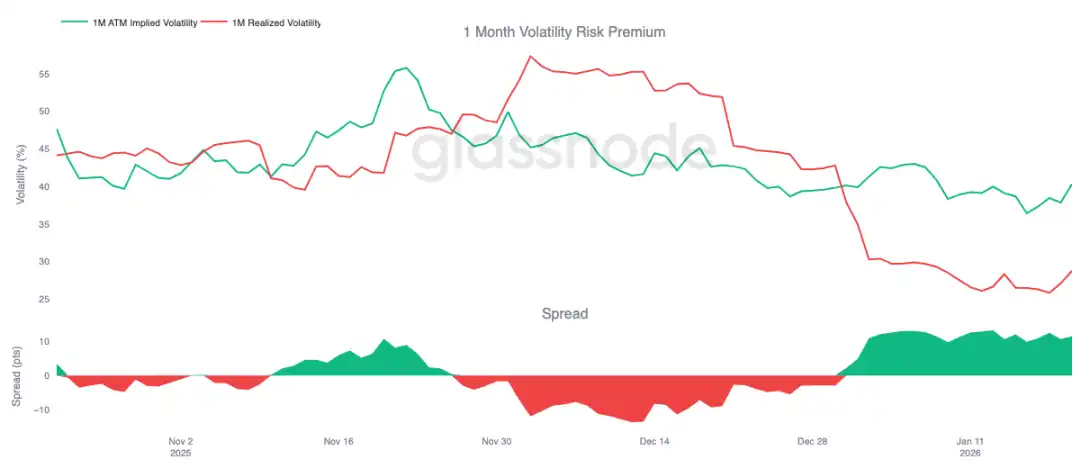
Volatility Risk Premium Remains High
The one-month volatility risk premium has remained positive since the beginning of the year. Although implied volatility is at historically low absolute levels, its pricing continues to be above the actual realized volatility. In other words, option prices remain "overpriced" relative to the actual price fluctuations that have occurred.
The volatility risk premium reflects the difference between implied volatility and realized volatility. A positive premium means that option sellers are compensated for bearing volatility risk. This creates a favorable arbitrage environment for "shorting volatility"—as long as actual volatility remains within a limited range, holding a short gamma position can generate profits.
This dynamic can be self-reinforcing, suppressing volatility increases. As long as selling volatility is profitable, more participants will join in, thereby keeping implied volatility suppressed at lower levels. As of January 20, the one-month volatility spread is approximately 11.5 volatility points, favorable to sellers, clearly indicating that the current environment remains friendly to selling volatility behavior.
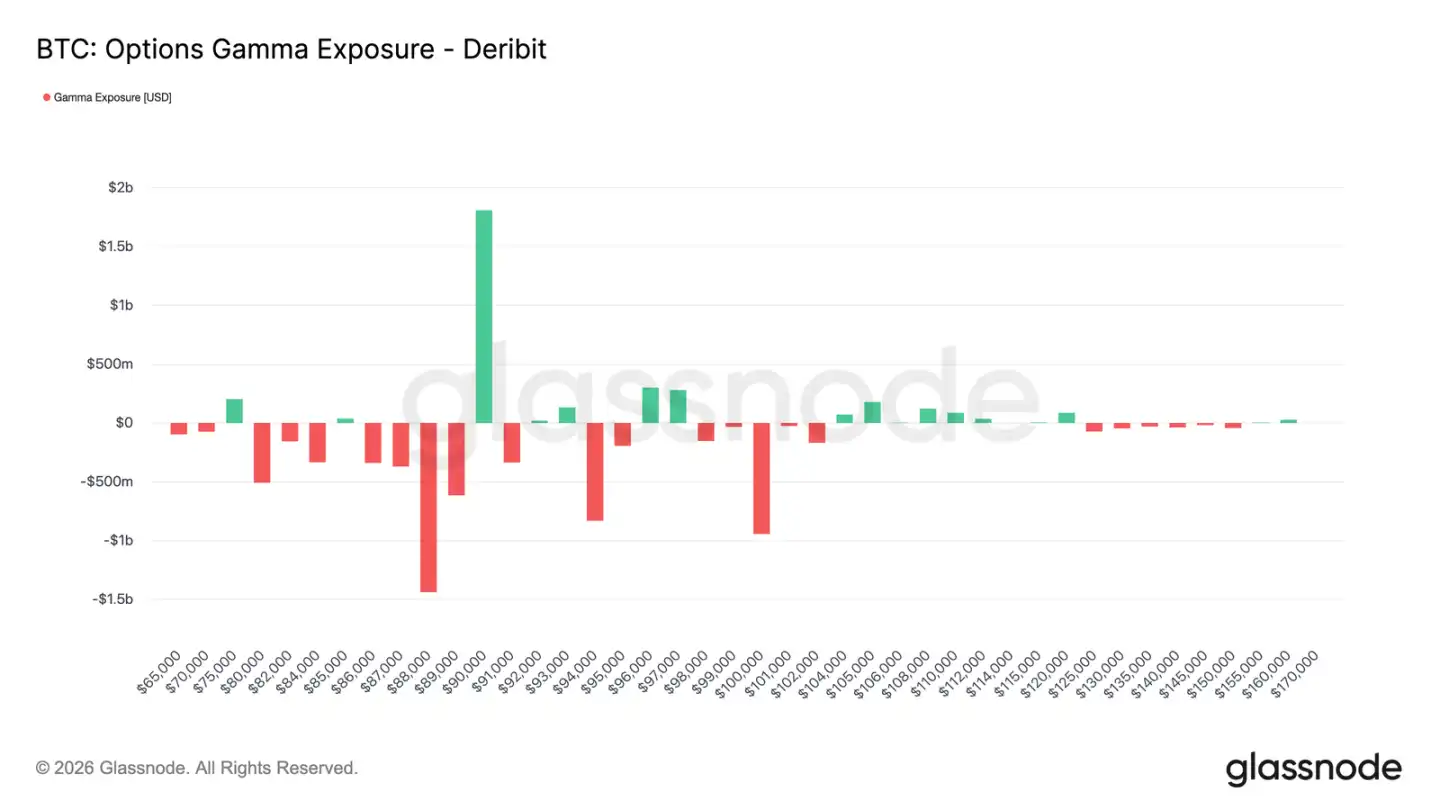
Traders' Positions Turn to Net Short
Traders' gamma positions are a key structural force affecting short-term price behavior. Recent fund flows show that investors are actively buying downside protection, leading traders to hold short gamma positions below $90,000. Meanwhile, some investors are financing this by selling upside options, resulting in traders holding long gamma positions above $90,000.
This creates an asymmetric pattern: below $90,000, traders hold short gamma, meaning that price declines may accelerate due to their hedging operations (selling futures or spot). Above $90,000, traders' long gamma acts as a stabilizer, as upward movements trigger their hedging buy orders, thereby suppressing the rally.
Therefore, price performance below $90,000 may remain weak, while $90,000 itself will become a key friction point. To effectively and sustainably break through this level, sufficient market momentum and confidence are needed to absorb traders' hedging fund flows and push their gamma risk exposure to higher price levels.
Summary
The Bitcoin market remains in a state of low participation, with current price movements stemming more from "eased selling pressure" rather than "active buying." On-chain data continues to reveal issues of supply surplus and weak structural support. Although spot fund flows have improved, they have not yet translated into a sustained buying trend.
Institutional demand remains cautious, with treasury fund flows stabilizing around the zero line, primarily driven by sporadic transactions. The derivatives market is quiet, with futures trading volume shrinking and leverage usage limited, collectively creating a low liquidity environment that makes prices exceptionally sensitive to slight position changes.
The options market also reflects this restraint. Volatility repricing is limited to the short term, hedging demand has returned to normal, and the elevated volatility risk premium continues to anchor overall volatility levels.
Overall, the market seems to be quietly building a bottom. The current consolidation is not due to overheated participation but rather a temporary pause in investor conviction, as they await the next catalyst that can stimulate widespread participation.
免责声明:本文章仅代表作者个人观点,不代表本平台的立场和观点。本文章仅供信息分享,不构成对任何人的任何投资建议。用户与作者之间的任何争议,与本平台无关。如网页中刊载的文章或图片涉及侵权,请提供相关的权利证明和身份证明发送邮件到support@aicoin.com,本平台相关工作人员将会进行核查。


