In the analysis from last Friday and Saturday, we clearly indicated that
the market trend this week is likely to be dominated by a decline, and the previous rebound has basically ended.
Before last Friday and Saturday, our view was still to focus on short-term buying after a pullback;
Short-term buying can be participated in, but the trading focus needs to shift to medium- and long-term bearish positioning.
I. Review of the Previous Rebound Structure
From a structural perspective, let's review the previous phase of the market:
After the price rose above 90,000, the first target was set at 94,000;
After reaching 94,000, a phase of pullback was expected;
After testing the support at 90,000, we looked towards the area around 98,000.
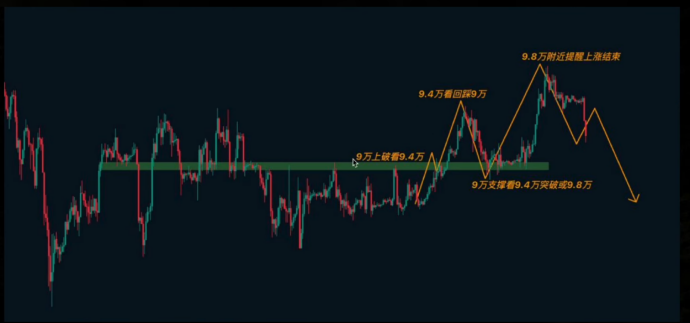
In the actual market movement:
94,000 was successfully broken;
The high point reached around 97,900, slightly below 98,000;
The overall movement was basically consistent with previous projections.
From an equidistant structure perspective, this round from just above 80,000 to 94,000, then extending to 97,900,
indicates that the adjustment phase lasting about a month and a half has basically ended.
II. Major Direction Judgment: Trend Reverts to Bearish
Based on the current structure, our core conclusion is:
The daily level adjustment has basically ended;
The market has returned to a long-term bearish trend;
Subsequent movements will primarily be downward.
The corresponding target range is:
Short-term target: around 80,000;
Medium- to long-term target: below 70,000.
This judgment was not formed temporarily; it was already indicated when the price was at 124,000 that a weekly level top was seen, and a downward range expectation of 70,000 to 50,000 was given.
III. 4-Hour Structure: Key Support Broken
From the 4-hour level, 94,000 is the core structural point:
Before the breakout, it was resistance;
After the breakout, it turned into support;
There was a reaction during the pullback phase.
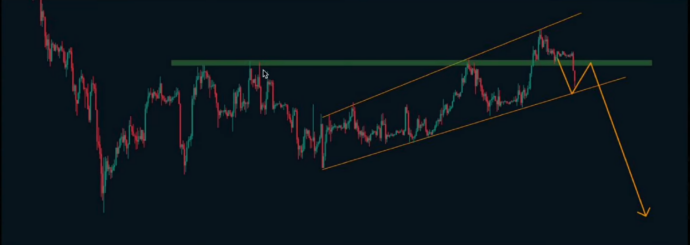
However, in yesterday's movement, this position was effectively broken.
Once key support is lost, the structure turns bearish.
In this case, the significance of continuing to look for "support levels" is diminished,
as reversal signals at the hourly level are sufficient to establish bearish logic at the daily and even weekly levels.
IV. Defensive Thinking on the Trading Level
From a practical operation perspective:
The defensive position remains at 98,000;
As long as the price does not rise above 98,000 again;
The current area layout for medium-term bearish positioning is valid.
The market may experience a pullback before declining again, or it may decline directly; both paths exist, but based on current performance, the probability of continuing downward is higher.
V. Weekly Perspective: 50-Week Moving Average and Downward Structure
At the weekly level, we have been focusing on the 50-week moving average:
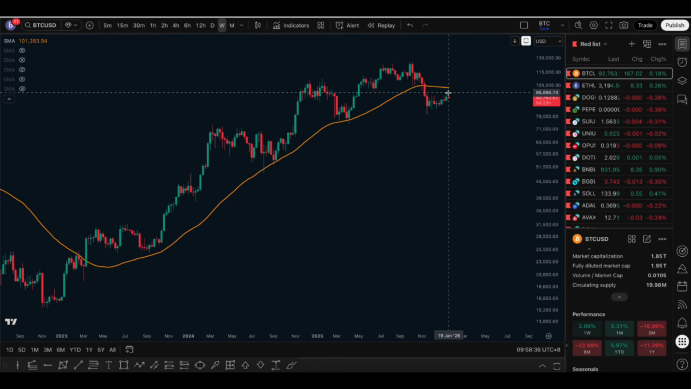
It is an important dividing line for bulls and bears at the weekly level;
Once it breaks down and starts to decline, the certainty of the trend turning bearish significantly increases.
The current weekly structure shows a typical two-phase decline:
The first phase of decline;
Followed by an adjustment;
Next, there is still a new phase of downward space.
After this phase is completed, the weekly level downward structure will be closer to completion.
VI. Medium- to Long-Term Key Range: 70,000 to 50,000
From the historical structure and chip distribution perspective:
Around 70,000 is an important high point from the previous bull market;
This area has experienced a long period of oscillation and turnover;
Therefore, the range from 70,000 to 50,000 constitutes a highly dense trading area.
Because of this, this range is regarded as an important support zone for the medium to long term.
If the price enters this range, it is more inclined to be a key focus area at the spot level.
VII. Short Cycle Supplement: Market Reaction After a Sharp Decline
From the hourly level observation:
A sharp decline occurred yesterday;
After the sharp decline, there was no rapid V-shaped rebound;
Instead, there was prolonged oscillation at a low level.
This characteristic usually indicates:
The price has not yet fallen into a true demand zone,
and the probability of continuing downward is relatively higher.
Summary and Risk Warning
Considering different cycles:
The short cycle structure has turned bearish;
The daily level adjustment is likely to be over;
The weekly downward structure is still continuing;
The medium- to long-term focus is on the range of 70,000 to 50,000.
Follow me, join the community, and let's progress together.

免责声明:本文章仅代表作者个人观点,不代表本平台的立场和观点。本文章仅供信息分享,不构成对任何人的任何投资建议。用户与作者之间的任何争议,与本平台无关。如网页中刊载的文章或图片涉及侵权,请提供相关的权利证明和身份证明发送邮件到support@aicoin.com,本平台相关工作人员将会进行核查。