Shiba Inu's most recent 7% decline initially appears to be a continuation of the company's overall downward trend. SHIB was momentarily forced below short-term support as the price rapidly declined and triggered stops. However, the market's immediate response to that move is far more significant than the decline itself, and it was objectively positive.
Candlestick reversal
Rather, it bounced almost immediately, creating a long lower wick on the daily candle. Typically, that type of candlestick structure indicates aggressive dip-buying, as opposed to panic-sales. Sellers lowered the price, but buyers quickly took advantage of the liquidity. Those drops grind lower in weak markets rather than rising.
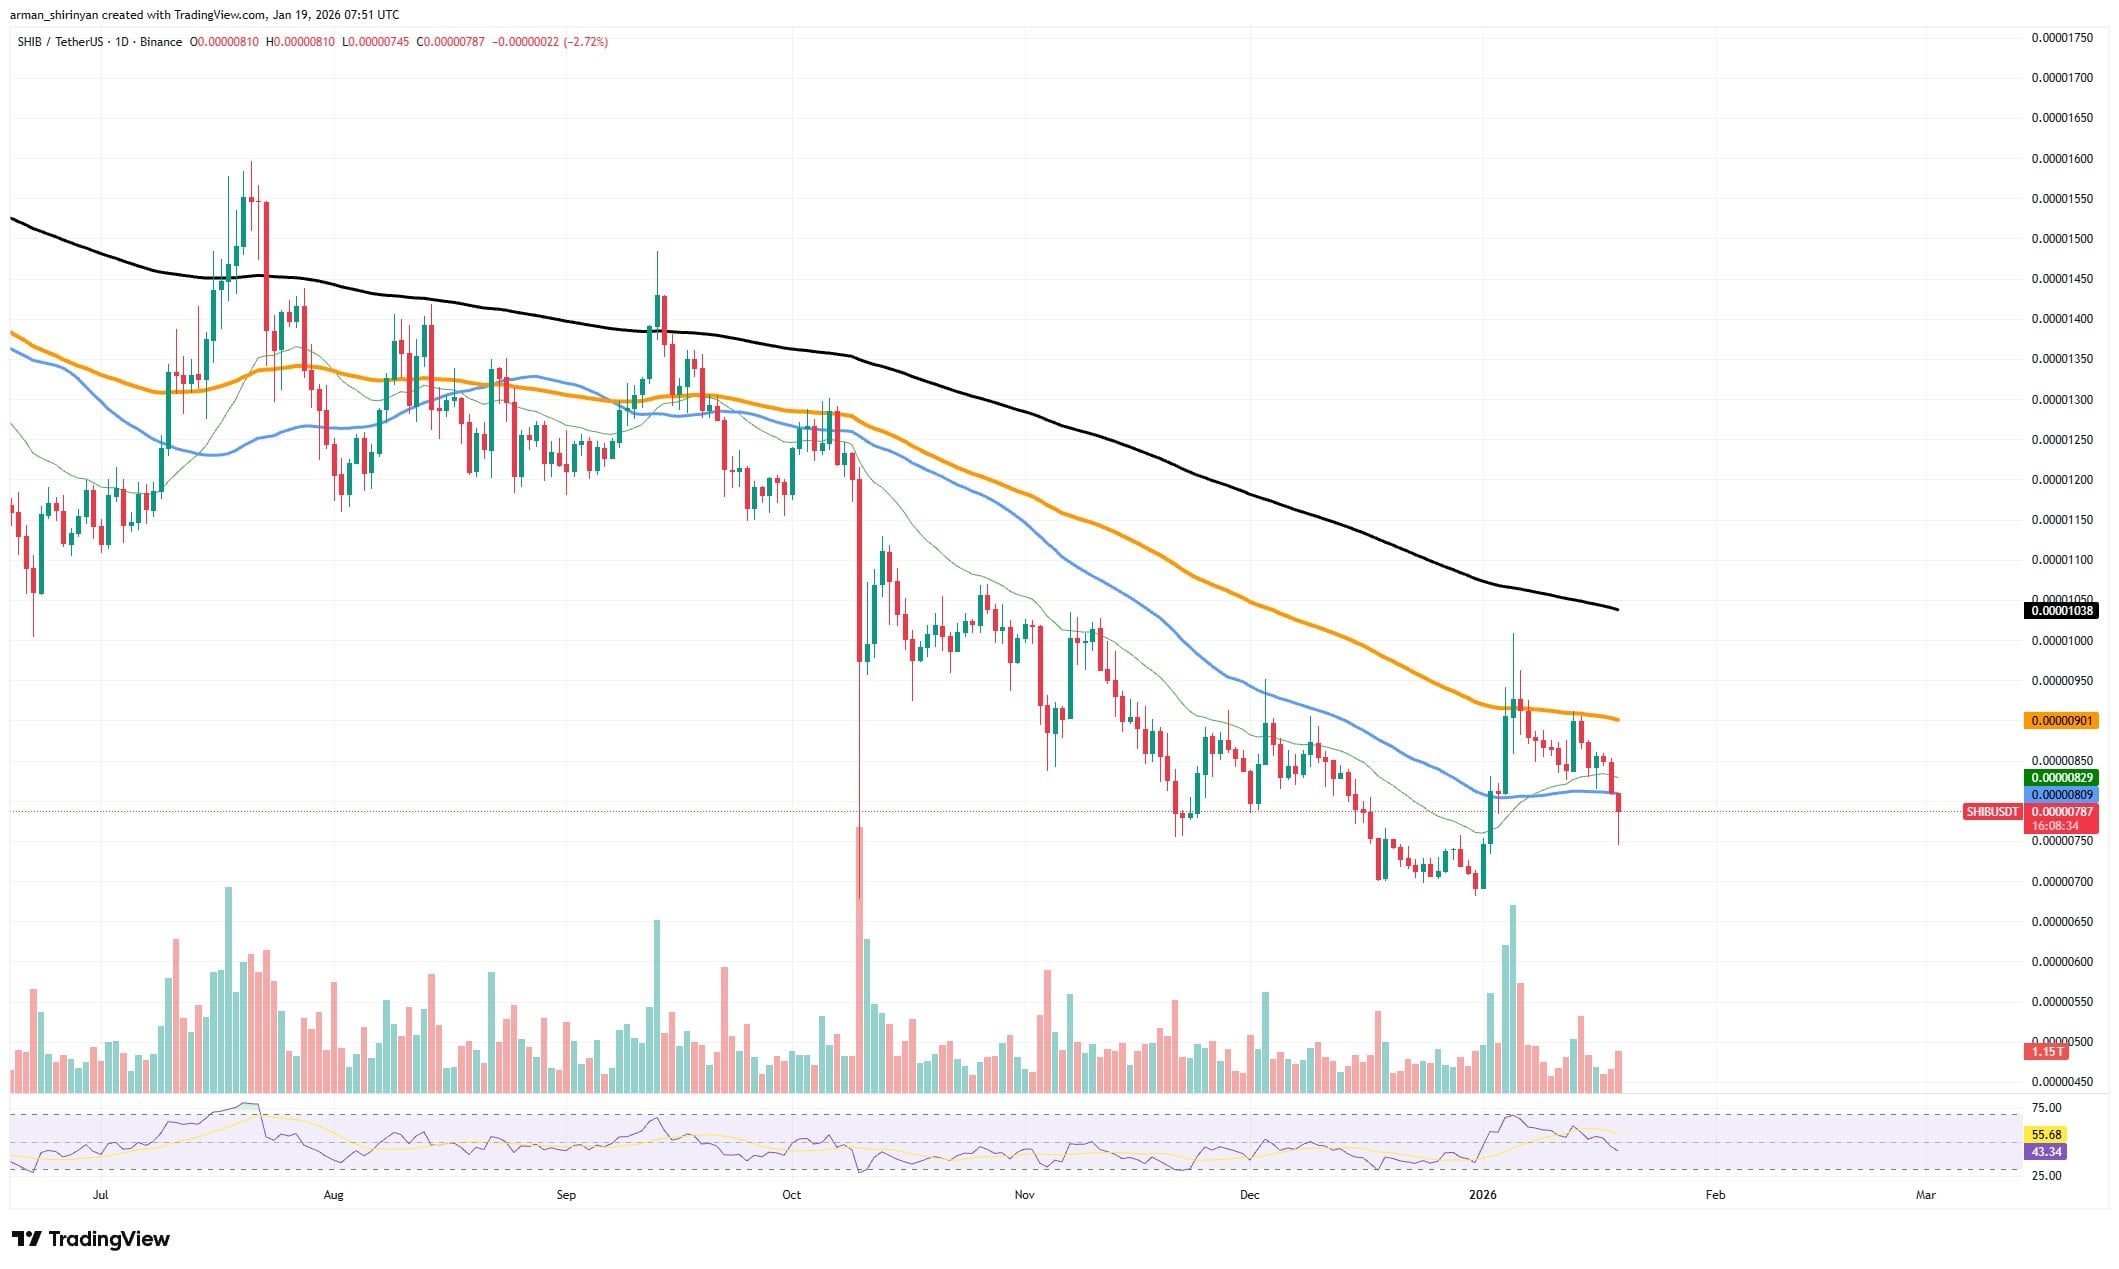
SHIB/USDT Chart by TradingView
The bounce indicates that liquidity is still available and in use. This is significant because SHIB has been trading under a number of declining moving averages, and there is strong bearish sentiment. Even in the absence of a verified trend reversal, a strong rejection of lower prices indicates that market participants are still prepared to intervene. It is obvious that buyers have stayed in the building.
HOT Stories Morning Crypto Report: XRP Bears Burned in 16,559% Liquidation Imbalance Chaos, Binance Cuts 22 Coins From Bitcoin and Ethereum, Pro-Ripple Lawyer Blasts Coinbase CEO: Here's WhyCardano Founder Attacks Ripple CEO. Key Reason WhyBitcoin Price Dump Raises EyebrowsSHIB Price Teases 22% Breakout, Ripple Scores Major EU License Win, XRP Rockets 428% in Capital Allocation, Strategy Makes Biggest BTC Purchase in Months — Top Weekly Crypto News
You Might Also Like
Mon, 01/19/2026 - 03:00 U.Today Crypto Market Review: XRP Volume Hits 0; Shiba Inu (SHIB) Can Skyrocket; Did Bitcoin (BTC) Reach Top?ByArman Shirinyan
This move appears to be more of a liquidity sweep than a breakdown from a structural standpoint. Volume surged, price snapped back toward the short-term EMA cluster and stops below recent lows were taken. In contrast to clean trend continuation moves, that behavior frequently occurs close to local bottoms or during transition periods. Although it greatly lowers the likelihood of an instant collapse, it does not ensure upside.
Momentum indicators support this. SHIB is kept flexible rather than trapped because RSI cooled off with the decline but stayed out of extremely oversold territory. There is only compression and reaction here, not significant bearish momentum expansion. That is typically not how trends accelerate downward but rather how bases begin to form. All of this does not imply that SHIB is suddenly optimistic or poised to soar higher.
Overhead resistance and long-term moving averages continue to cap it. But the most important lesson is straightforward: following a steep decline, sellers were unable to regain control. The failure is more important than the actual red candle.
SHIB has a realistic chance to stabilize and try another recovery push if buyers keep defending these levels and volume remains responsive on dips. The market is neither dead nor in a state of euphoria. For the time being, that 7% decline appears to be more evidence that demand is still present where it matters than a warning.
免责声明:本文章仅代表作者个人观点,不代表本平台的立场和观点。本文章仅供信息分享,不构成对任何人的任何投资建议。用户与作者之间的任何争议,与本平台无关。如网页中刊载的文章或图片涉及侵权,请提供相关的权利证明和身份证明发送邮件到support@aicoin.com,本平台相关工作人员将会进行核查。


