I. Market Background Review
Last Friday, I clearly pointed out that the market has basically entered a phase of a top. On Saturday, I emphasized again that Bitcoin's rise is nearing its end, "Prepare for a market around 20,000 points."
II. Structural Logic of the 90,000 Line
Regarding the key position of 90,000, our previous thoughts were quite clear.
After the price broke through 90,000, the short-term bullish target looked towards 94,000. Once 94,000 was reached, we judged that there would be a pullback to the previous resistance area below, which would convert into subsequent support.
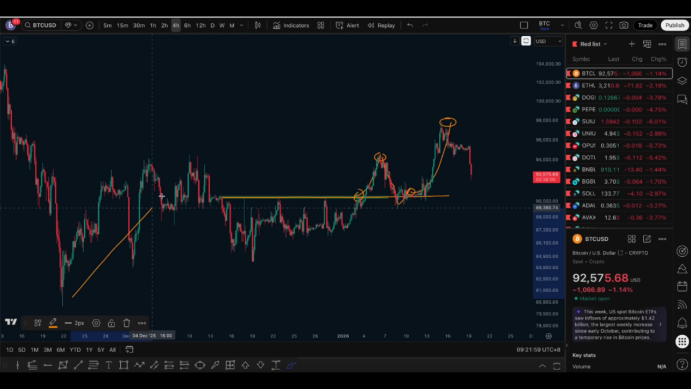
After the pullback is completed, the target range above is 98,000 to 99,000. Ultimately, the price peaked at over 97,900, very close to 98,000, and the equidistant upward target was basically achieved.
III. Top Confirmation and Shift in Trading Focus
Based on this structural judgment, we repeatedly emphasized last Friday and Saturday that this area has a high probability of having topped out, and the focus of trading needs to shift towards medium to long-term bearish positions.
For the bulls, we also mentioned a possibility at that time, which is that the market might have one more surge, even refreshing the high before falling again. However, this idea is only suitable for low leverage participation, and it can be done or not; overall, the focus should still be on medium to long-term bearish positions.
IV. Verification Results of the 94,000 Support
This morning, the price quickly dropped from around 95,000, reaching a low of 92,000, forming a drop of about 3,000 points.
Last Saturday, we mentioned that the price was then pulling back and verifying the key support level of 94,000.
If the support holds, we cannot rule out the possibility of reaching a new high; if the support is directly broken, it may turn into a larger bearish trend.
It is important to emphasize that this shift to bearish is not just for short-term pullbacks, but rather that the hourly level turns bearish while the daily and weekly charts simultaneously enter a bearish trend.
V. Two Expectations and Current Choices
At that time, we provided two expectations:
The first, after pulling back to the 94,000 support, would be to reach a new high and then fall;
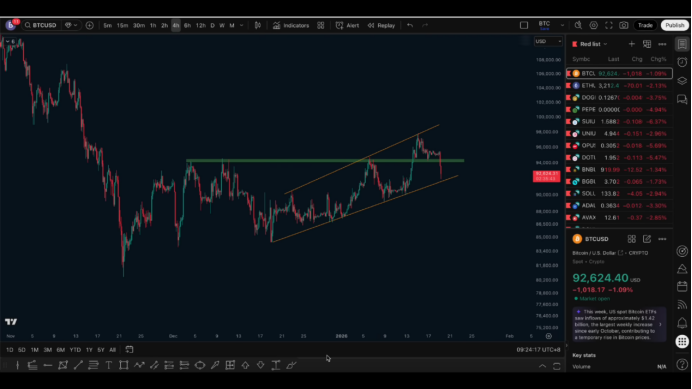
The second, directly breaking the 94,000 support, pulling back to the rising trend line, and then segmenting downwards, continuing the bearish trend.
From the current trend, the market has already followed the second expectation. The price has broken below the rising trend line and effectively broken the 94,000 support, currently pulling back near the lower trend line.
VI. Next Steps in Trading Strategy
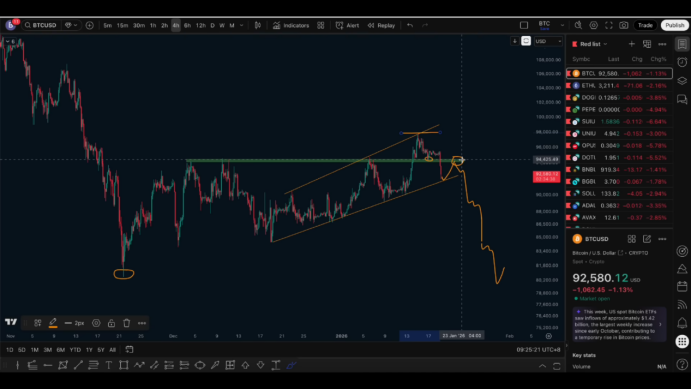
The next strategy is relatively clear: wait for a rebound, then position for shorts at high levels. The current structure has already entered a typical reversal market, and the previous adjustment is basically over.
The previously mentioned expectation of "reaching a higher point" is no longer valid. The likely subsequent trend is that after a price rebound, 94,000 will convert from a support level to a resistance level, leading to another decline.
VII. Key Levels and Target Ranges
In terms of operations, one can wait for a rebound exceeding 1,500 points and consider positioning medium to long-term short positions near 94,000.
Defense level: 98,000
Short-term target: around 80,000
Medium to long-term target: around 70,000
This strategy aligns with our previously emphasized viewpoint that the main focus area for spot trading remains between 70,000 and 50,000. This viewpoint was given as early as around 124,000.
VIII. Daily and Weekly Structure Explanation
From a structural perspective, we are still in a mid-term adjustment after a decline. Some market sentiment has turned bullish at this position, which is actually unreasonable; it is essentially still in the adjustment phase at the daily level.
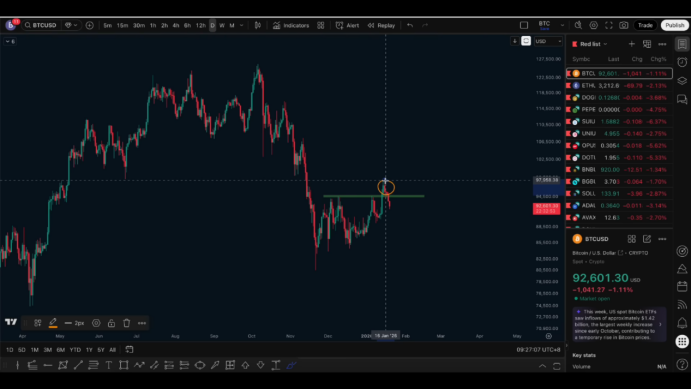
From a weekly perspective, this structure is quite similar to the ultimate adjustment during the last bear market decline; switching to a daily perspective, we can see that before the decline, the price completed a false breakout and squeeze through the horizontal resistance level, clearing out short positions, and then continued the original bearish trend.
The current daily structure is logically consistent with previous high points.
Follow me, join the community, and let's progress together.

免责声明:本文章仅代表作者个人观点,不代表本平台的立场和观点。本文章仅供信息分享,不构成对任何人的任何投资建议。用户与作者之间的任何争议,与本平台无关。如网页中刊载的文章或图片涉及侵权,请提供相关的权利证明和身份证明发送邮件到support@aicoin.com,本平台相关工作人员将会进行核查。