Odaily specially invited market analyst Conaldo, a master's degree holder in financial statistics from Columbia University in the United States, has focused on quantitative trading in U.S. stocks since college and has gradually expanded to Bitcoin and other digital assets. He has built a systematic quantitative trading model and risk control system in practice; he possesses keen data insights into market fluctuations and is committed to continuously delving into the professional trading field, pursuing stable returns. He will deeply analyze changes in BTC technology, macroeconomics, and capital flow weekly, review and showcase practical strategies, and forecast significant recent events for reference.

Core Summary of the Weekly Trading Report:
• Strategy Execution (Short-term): Last week's trading strictly followed the established strategy, completing a short-term operation (1x leverage) with a return of -1.07%. (See Figure 1 for details)
• Verification of Core Views (Short-term): The core views proposed last week have been accurately validated by the market. Over the past week, the price of Bitcoin broke through the important resistance range of $94,500 to $95,000 and is currently confirming its validity. The price peaked at $97,963, which is less than 0.5% away from the lower boundary of the given resistance zone at $97,500, further confirming our judgment of key levels.
• Market Analysis for the Coming Weeks: Is Bitcoin about to transition from a bear market to a bull market? Is the current market a rebound or a reversal? The 21-week moving average may become a dividing line for bulls and bears in the market. (See Figure 4 for detailed analysis)
The following will provide a detailed review of market predictions, strategy execution, and specific trading processes.
I. Review of Bitcoin Market Last Week (01.12–01.18)
- Review of Short-term Operations Last Week: As shown in (Figure 1)
We strictly followed the trading signals generated by our self-constructed spread trading model and momentum quantitative model, combined with our market trend predictions, to complete a short-term operation, resulting in a loss of 1.07%.
Specific trading details and review are as follows:
Bitcoin 30-minute K-line chart: (Momentum Quantitative model + Spread Trading model)
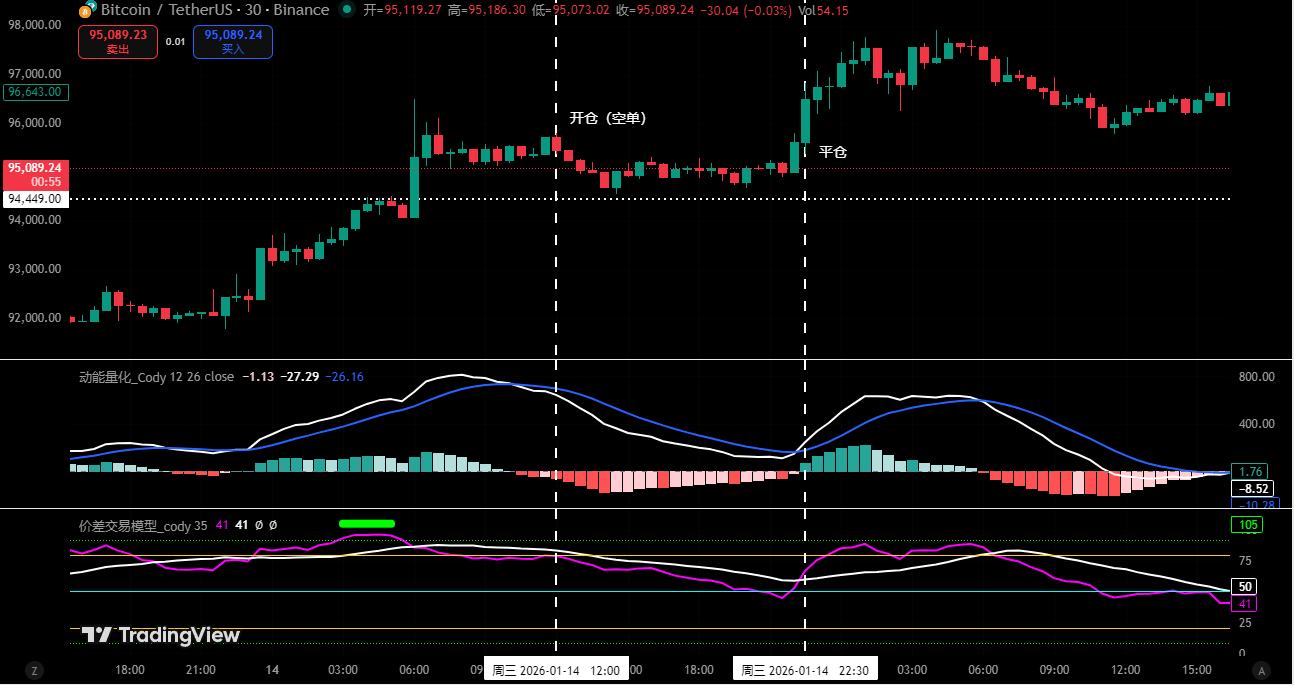
Figure 1
① Summary of Trading Details: (No Leverage)

② Review of Short-term Trading:
• First Trade (Loss of 1.07%): This operation executed Plan A (Short on Resistance) strategy: When the price reached the key resistance zone of $94,500 to $95,000 and encountered resistance signals, the spread trading model simultaneously triggered a top signal (green dot), forming a double confirmation. We then established a 30% short position at $95,460 as planned; however, the market trend deviated from expectations and instead found support near $94,500, turning upward. When the momentum quantitative model and spread trading model triggered a bottom signal again, we immediately exited at $96,493 to stop loss. Although this trade resulted in a loss, we strictly adhered to the operational discipline of “trade upon signal trigger, prioritize risk control,” achieving unity of knowledge and action.
- Review of Last Week's Trend Predictions and Operational Strategies:
① Last week, it was clearly pointed out: Maintain a range of $84,000 to $94,500 with a focus on observing directional choices and effectiveness at both ends of the range.
② Review of Core Points: Resistance is seen at the $94,500 to $95,000 area, with significant resistance at around $97,500 to $99,500; support is seen at the $89,500 to $91,000 area.
② Review of Operational Strategies:
• Medium-term Strategy: If the price successfully breaks through and stabilizes above $94,500, clear all medium-term positions (shorts) and hold cash for observation.
• Short-term Strategy: If the price maintains a range of $84,000 to $94,500, execute operations according to Plan A:
• Opening Position: When rebounding to the $94,500 to $95,000 area and combined with model top signals, a 30% short position can be established.
• Risk Control: Initial stop loss for shorts set above the cost price at around 1.5% (i.e., 1.015 * cost price).
• Closing Position: When approaching the core support level and combined with model signals, positions can be gradually closed for profit-taking.
II. Technical Analysis of Bitcoin Price Structure: Comprehensive Analysis Based on Multiple Models and Dimensions
Combining market operations, the author conducts an in-depth analysis of Bitcoin's price structure based on a self-constructed trading system from multiple models and dimensions.
Bitcoin Weekly K-line Chart: (Momentum Quantitative Model + Sentiment Quantitative Model)
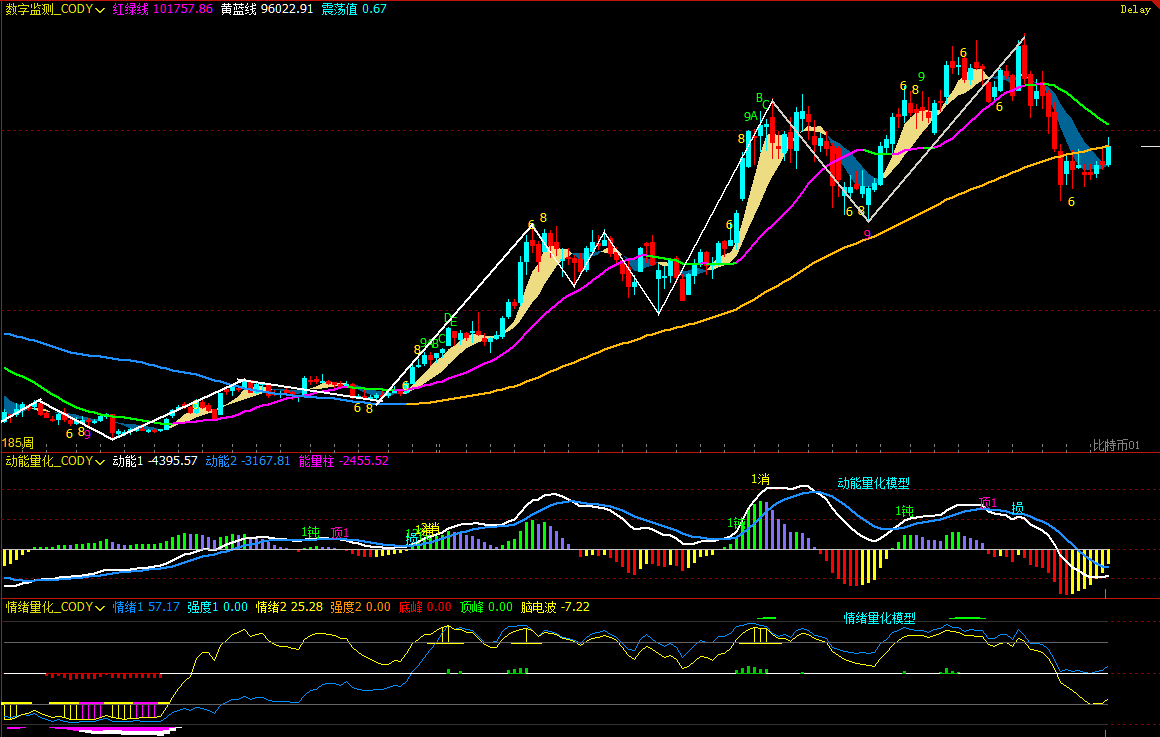
Figure 2
- As shown in (Figure 2), from the weekly chart analysis:
• Momentum Quantitative Model: Technical indicators show a continuation of the previous weeks' patterns, with the momentum line gradually approaching, while the negative energy bars continue to shrink. However, the current signal has not confirmed a reversal of the bearish trend.
The momentum quantitative model indicates: Price Decline Index: High
• Sentiment Quantitative Model: The blue sentiment line value is 57.17, with an intensity of zero; the yellow sentiment line value is 25.28, with an intensity of zero, and the peak value is 0.
The sentiment quantitative model indicates: Price Pressure and Support Index: Neutral
• Digital Monitoring Model: The price has been below the bull-bear (yellow-blue line) boundary for 9 weeks. Last week, bulls once again attacked this line, closing near the line .
The digital monitoring model indicates: Monitoring (top-bottom) digital signals have not appeared; the weekly K-line closed with a medium bullish line, with an increase of about 2.92%.
The above data indicates: The weekly bearish trend of Bitcoin requires caution against the risk of oscillation adjustments.
Bitcoin Daily K-line Chart: (Momentum Quantitative Model + Sentiment Quantitative Model)
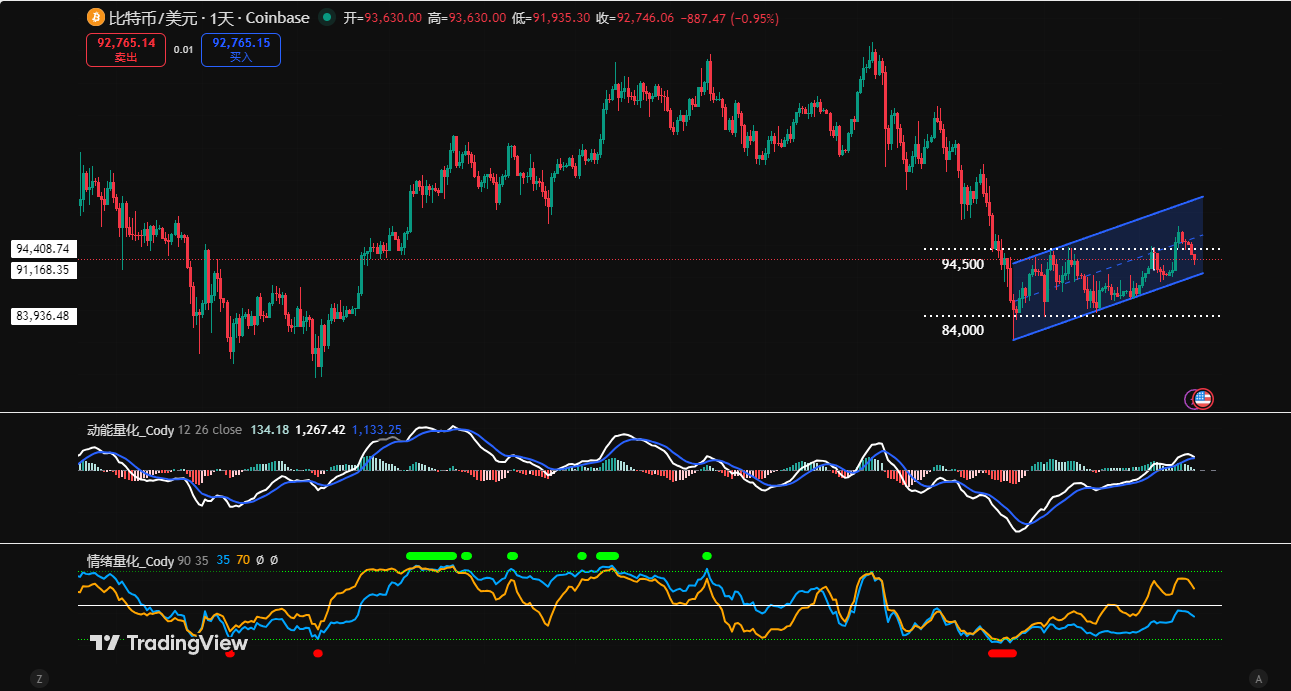
Figure 3
- As shown in (Figure 3), from the daily chart analysis:
• Momentum Quantitative Model: Last week showed an overall "rise then fall" trend. In the first half of the week, the price accelerated its rebound, with the momentum line above the zero axis, and positive energy bars rapidly expanding; however, in the latter half, the energy bars noticeably shrank, and the momentum line began to converge, slowly approaching the zero axis.
The momentum quantitative model indicates: Daily bullish momentum is showing signs of exhaustion, pay attention to the gains and losses around the zero axis.
• Sentiment Quantitative Model: After last week's daily close, the blue sentiment line value is 38, with an intensity of zero; the yellow sentiment line value is 76, with an intensity of zero.
The sentiment quantitative model indicates: Pressure and Support Index: Neutral
The above data suggests: The daily level rebound continues, and the market is beginning to show a bullish pattern, but its effectiveness still needs confirmation. The focus will be on the competition between bulls and bears for the zero axis.
III. Market Forecast for This Week (01.19–01.25)
- Core View for This Week: Focus on the $94,500 to $95,000 area.
• Effective Pressure: If the price rebounds to this area and confirms resistance, it is expected to maintain oscillation within the $84,000 to $94,500 range, with the primary testing target looking at the $89,500 to $91,000 area.
• Effective Stabilization: If it can strongly stabilize in this area, the price is expected to rebound, but the height will be limited.
- Core Resistance Levels:
• First Resistance Zone: $94,500 to $95,000 area (upper edge of the previous box)
• Second Resistance Zone: $97,500 to $99,500 area (previous oscillation center)
• Important Resistance Level: Near $102,000 (around the 21-week moving average)
- Core Support Levels:
• First Support Level: $89,500 to $91,000 area (previously dense trading area)
• Second Support Level: $86,000 to $86,500 area (previous important support level)
• Important Support Level: Near $84,000 (lower edge of the previous box)
IV. Operational Strategies for This Week (Excluding Sudden News Impact) (01.19–01.25)
Medium-term Strategy: Hold cash, as market trends may oscillate and fluctuate; temporarily hold cash for observation.
Short-term Strategy: Utilize 30% of the position, set stop-loss points, and look for "spread" opportunities based on support and resistance levels. (Using 30 minutes as the operational cycle).
In operations, focus on the gains and losses in the $94,500 to $95,000 area. To dynamically respond to market changes and combine with real-time model signals, we propose two short-term operational plans A/B:
• Plan A: If the price stabilizes in the $94,500 to $95,000 area:
• Opening Position: If the price breaks through the $94,500 to $95,000 area and shows stabilization signals, combined with model bottom signals, a 30% long position can be established.
• Risk Control: Initial stop loss for longs set below the cost price at around 1.5% (i.e., 0.985 * cost price).
• Closing Position: When rebounding to the core resistance level and combined with model signals, positions can be gradually closed for profit-taking.
• Plan B: If the price effectively breaks below the $94,500 to $95,000 area:
• Opening Position: If it rebounds to this area and confirms a valid break, a 30% short position can be established.
• Risk Control: Initial stop loss for shorts set above the cost price at around 1.5% (i.e., 1.015 * cost price).
• Closing Position: When approaching $86,500 and combined with model signals, positions can be gradually closed for profit-taking.
Bitcoin Weekly K-line Chart: Comparative Analysis of Historical Price Structure (2021.11 VS 2025.10)
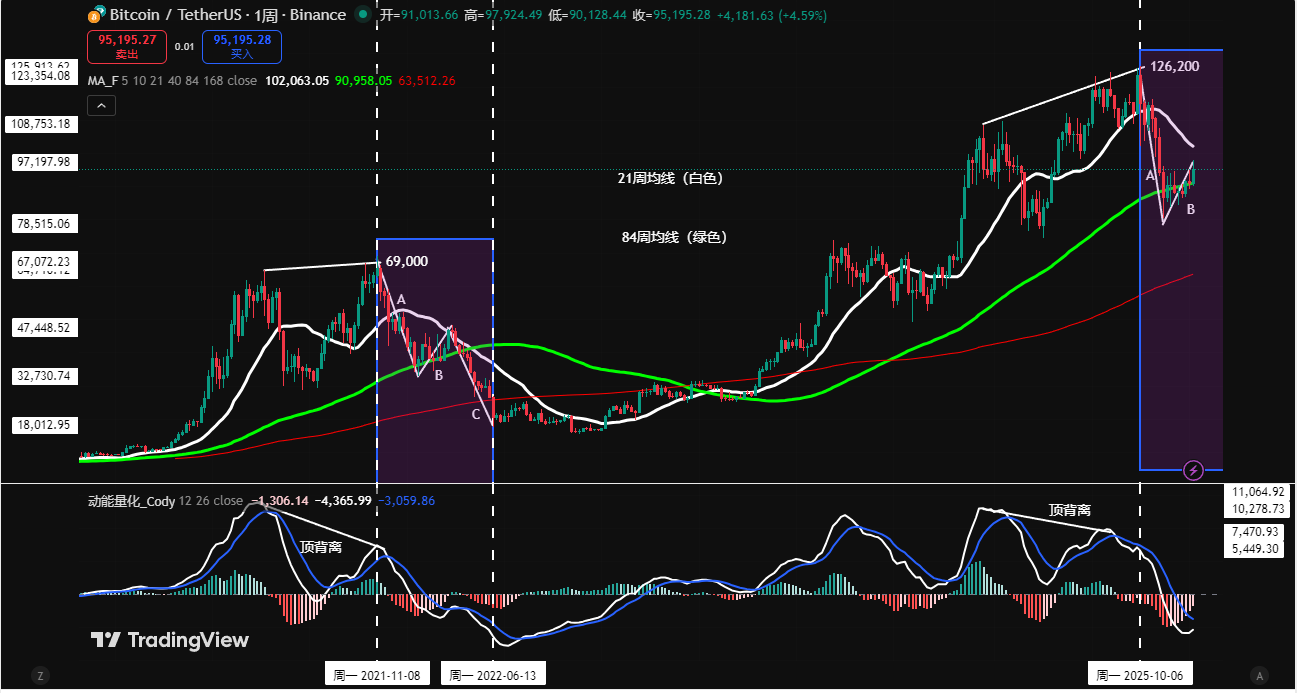
Figure 4
Note: In the above figure, the 21-week moving average (white), 84-week moving average (green)
V. How Will History Repeat Itself? Comparing the Similarities and Differences of Two Rounds of Weekly Level Adjustments and Their Insights:
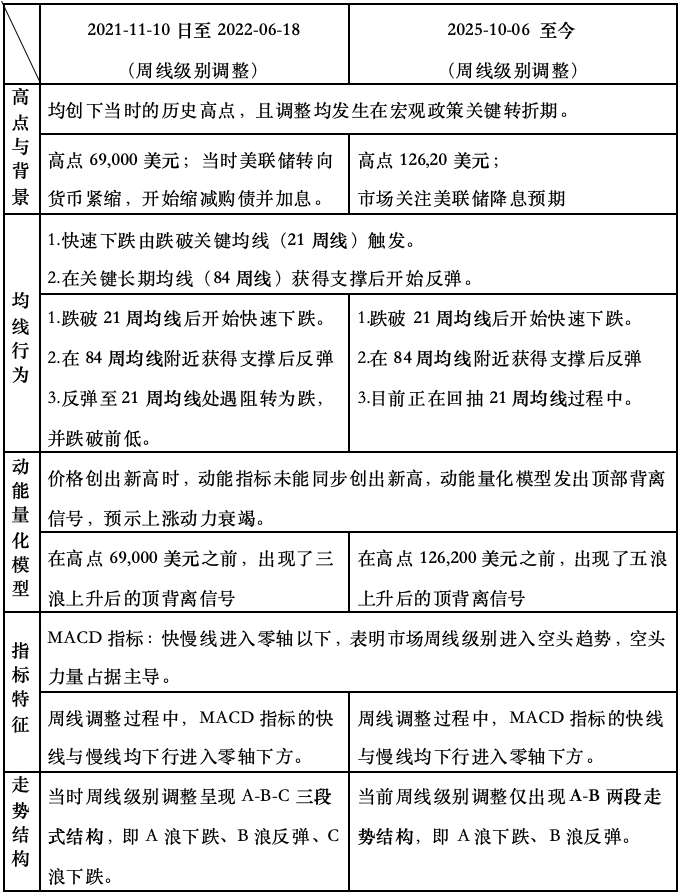
In summary, we can extract the following core insights:
The current weekly level is in a bearish trend, which limits the space for daily rebounds.
In the coming weeks, whether the price can effectively break through and stabilize above the 21-week moving average will become the focus of the market. If the price rebounds to this moving average without forming an effective breakthrough, the market may replicate the historical adjustment pattern, potentially breaking below the $80,000 mark.
Whether the weekly MACD indicator can show signs of stabilizing and whether the momentum line effectively crosses above the zero axis will be a key basis for judging whether the market trend is reversing.
VI. Special Reminder:
When opening a position: Immediately set the initial stop-loss level.
When profit reaches 1%: Move the stop-loss level to the opening cost price (break-even point) to ensure capital safety.
When profit reaches 2%: Move the stop-loss level to the position of 1% profit.
Continuous Tracking: After that, for every additional 1% profit, the stop-loss level will be moved up by 1% to dynamically protect and lock in profits.
The financial market is ever-changing, and all market analyses and trading strategies need to be dynamically adjusted. All views, analytical models, and operational strategies mentioned in this article are derived from personal technical analysis and are for personal trading logs only, not constituting any investment advice or operational basis. The market carries risks, and investments should be made cautiously; DYOR.
免责声明:本文章仅代表作者个人观点,不代表本平台的立场和观点。本文章仅供信息分享,不构成对任何人的任何投资建议。用户与作者之间的任何争议,与本平台无关。如网页中刊载的文章或图片涉及侵权,请提供相关的权利证明和身份证明发送邮件到support@aicoin.com,本平台相关工作人员将会进行核查。


