Hello sisters! I am your old friend, Sister Qinglan. Today, let's have a good chat about the recent Bitcoin market, especially after experiencing a "Black Monday." What is the market trend like? We have K-line data from different time frames and the latest news, so let's unravel the details and understand the logic behind it to find our trading ideas.
First, let's take a look at the amount of data we are analyzing this time: We have collected K-line data as follows: 46 K-lines for the 15-minute period, 47 K-lines for the 1-hour period, 20 K-lines for the 4-hour period, and 50 K-lines for the daily period. As for the news, we have gathered a total of 50 pieces of information.
We will analyze from the larger time frame to the smaller one, which allows for a more comprehensive view, just like we do in our classes: first look at the "big picture," then the "details":
Daily Chart (Long-term Trend): K-line performance and trend: From the daily chart, Bitcoin is currently experiencing a significant correction after a previous surge. We can clearly see that the latest K-line is a large bearish candle with a long upper shadow, pushing the price down to around $92,563. Although the current price is slightly above the MA20 ($92,353), it has already fallen below the MA5 ($94,507) and MA10 ($93,772). This indicates that the long-term upward momentum has clearly weakened, and the market is undergoing profit-taking and adjustment. Technical indicators: In terms of MA alignment, the MA5 has crossed below the MA10, which is not a good signal, indicating the beginning of a short-term correction. Although the MACD's DIF line is still above the DEA line, the green energy bars (if displayed as negative, they are red) have significantly shortened, showing that the bullish strength is exhausted. If it continues to decline, the DIF is likely to form a death cross, which would be a stronger bearish signal. The RSI is at 51.62, in the neutral zone, indicating that the market has not reached an extreme panic oversold state, but it is no longer strong. Summary: The long-term bullish pattern is being challenged and is undergoing a deep correction, requiring caution against trend reversal risks. We can consider the range of $92,000-$92,300 (near MA20 and psychological level) as a key support level on the daily chart. If it is lost, we may need to look for support at a deeper bottom. The resistance above is seen at $93,700-$94,500 (MA10 and MA5 area).
4-Hour Chart (Medium-term Trend): K-line performance and trend: Wow, the movement on the 4-hour chart is even more heart-pounding! The recent K-lines are all large bearish candles, directly smashing the price from above $95,000 down to around $92,500, with significantly increased trading volume, indicating that the bearish strength is very fierce. This is a solid downtrend! Technical indicators: The MA system has completely turned into a bearish arrangement, with MA5, MA10, and MA20 all diverging downwards, and the price is firmly suppressed below all moving averages. As for the MACD indicator, the DIF line has clearly crossed below the DEA line, forming a distinct death cross, and the negative red energy bars are huge and continuously expanding, signaling an explosion of medium-term bearish momentum. The RSI is at 32.28, very close to the oversold zone, indicating that market panic is spreading. Summary: The medium-term trend has clearly turned bearish. $92,000 is the current key support level; if it cannot be effectively held, the lower $90,000 round number may face a test. The resistance level above is at $93,000-$94,000, which was previously a range of price fluctuations and is now likely to become a resistance for rebounds.
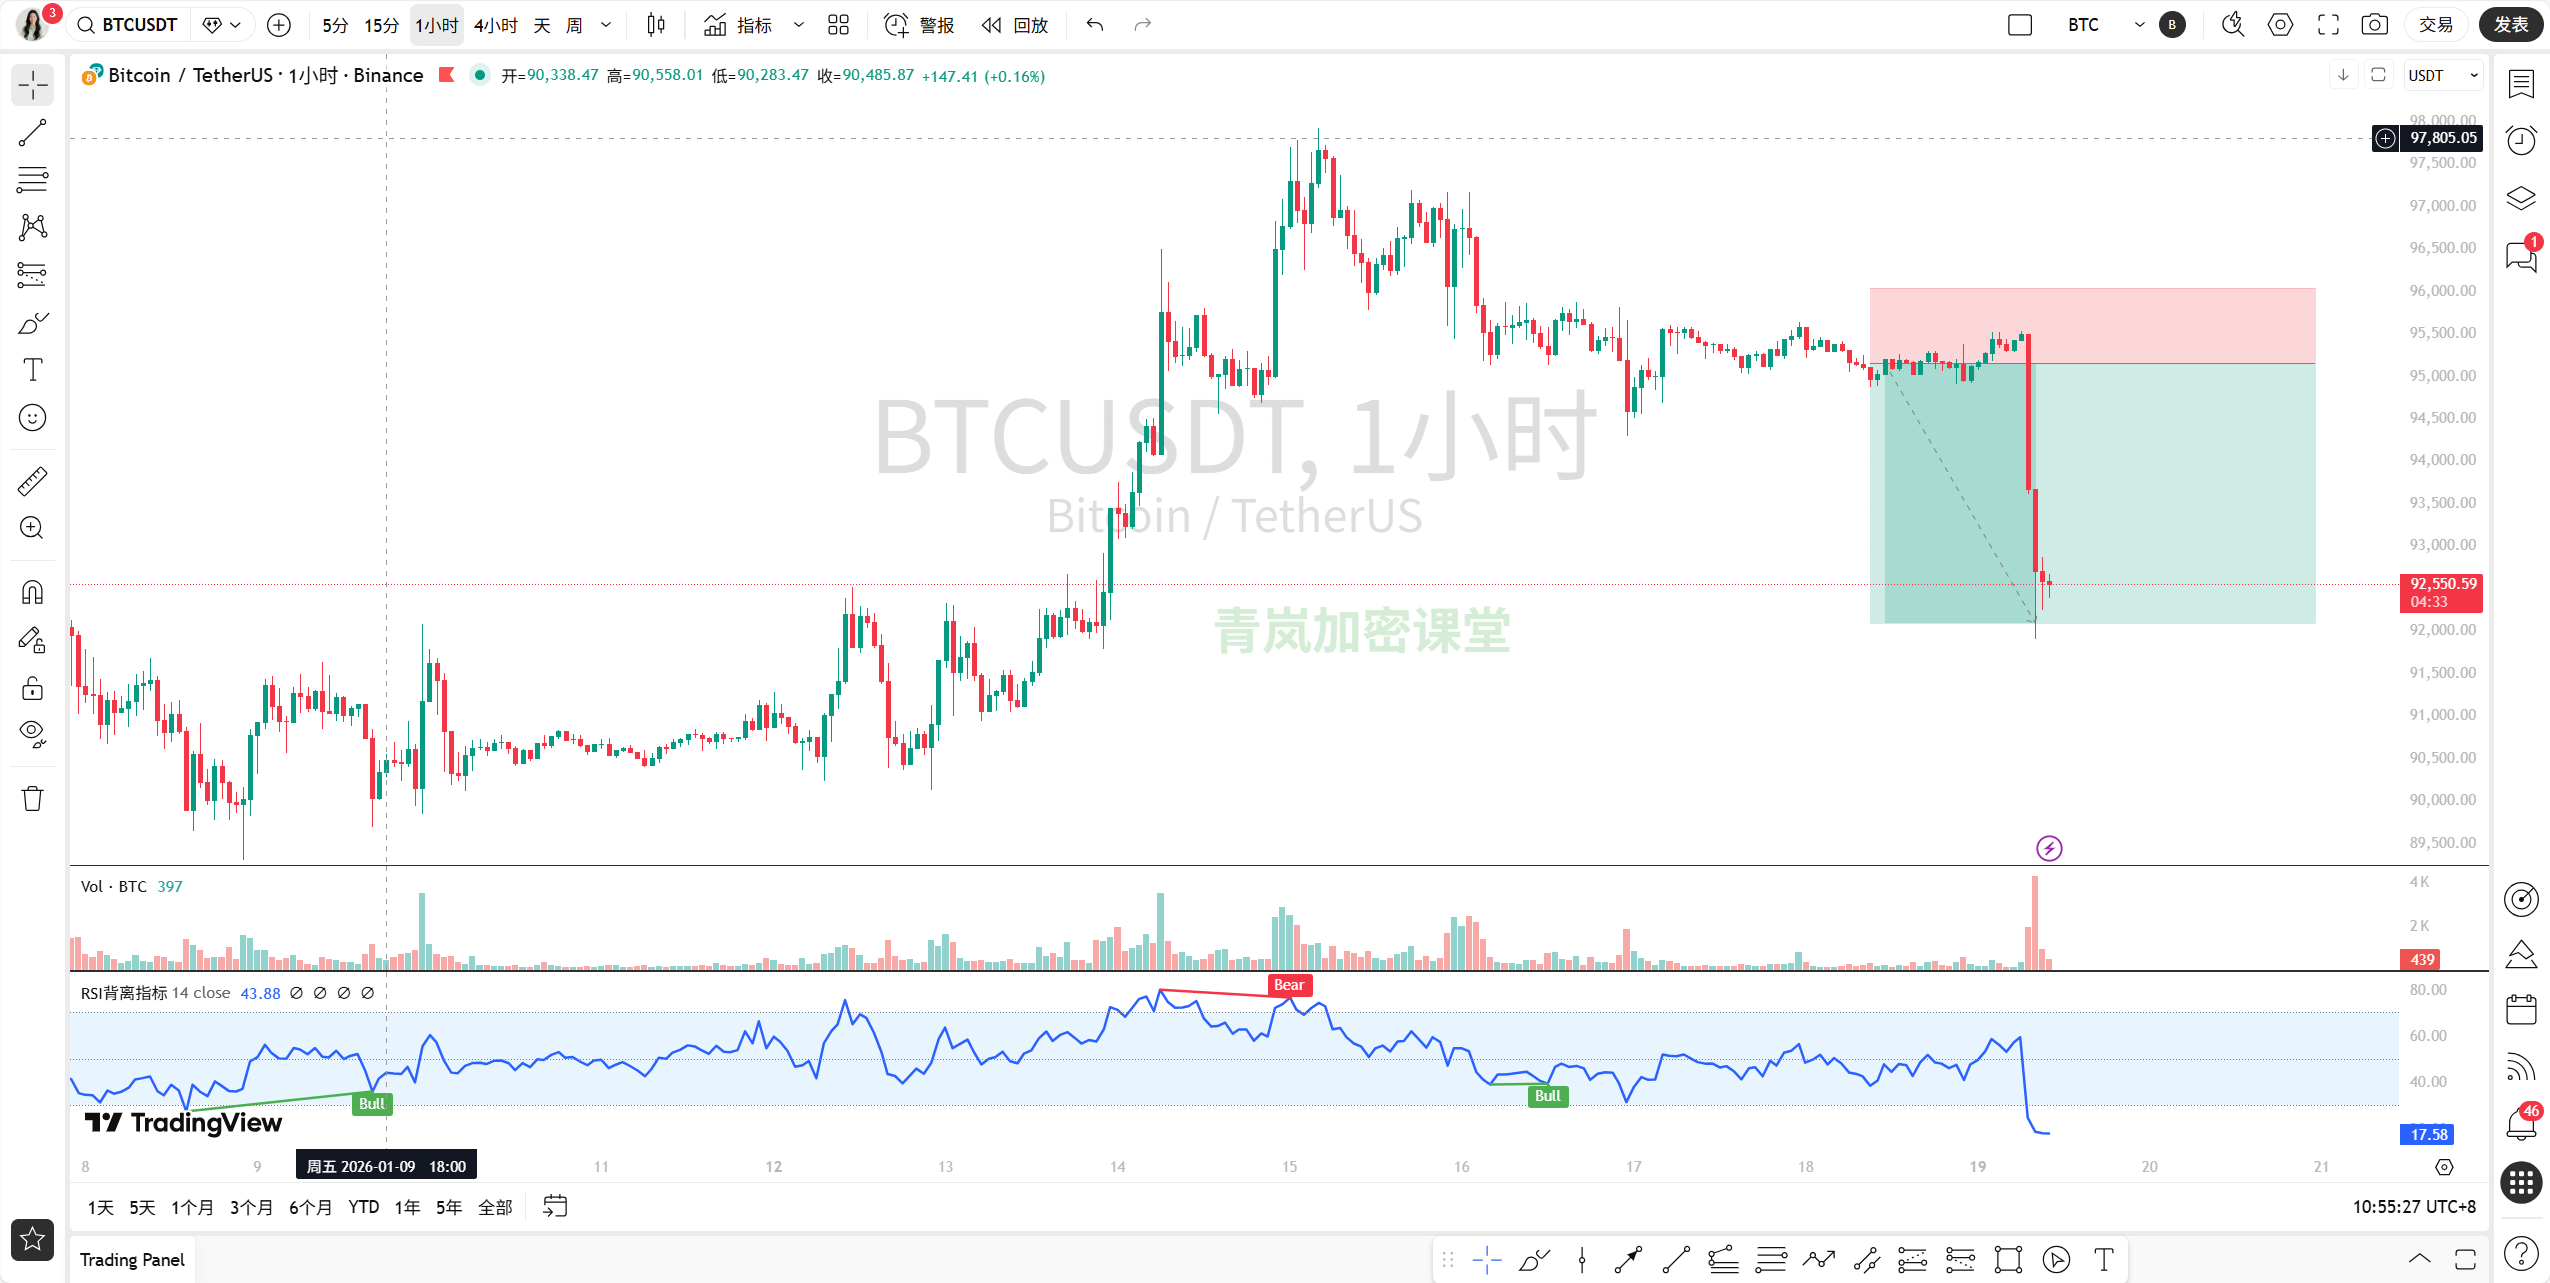
1-Hour and 15-Minute Charts (Short-term Trend): K-line performance and trend: These two short periods are simply a "bloodbath"! The K-line chart shows continuous panic selling with huge trading volume, causing the price to plummet rapidly. This is a typical "flash crash" market. Technical indicators: All MA lines are in an extremely bearish arrangement, with the price far from the moving averages, completely under the control of bears. In the MACD indicator, both the DIF and DEA lines are deep in negative territory, with the DIF far from the DEA, and the red energy bars are shockingly large, indicating that the short-term bearish momentum is exceptionally strong. The RSI is at 17.65 on the 1-hour chart and 25.99 on the 15-minute chart, both in an extremely oversold state! Summary: In the short term, there is a significant decline, but the oversold signal from the RSI suggests that a technical rebound may occur at any time. We need to pay special attention to the $92,000 support level; if it can hold, we may see a small rebound from short-term bottom-fishing funds.
Now, let's delve deeper into the news:
Our K-line chart and technical indicators completely corroborate the first piece of news: "Trump's policies disturb the crypto market: The Fed's leadership change and the tariff war triggered Black Monday." The accumulation of macro-negative news led to Bitcoin's rapid decline from the high of $97,000, briefly falling below the $92,000 mark, even triggering nearly $600 million in long liquidations, which is a "nightmare" for bulls! Sister Qinglan also reminded everyone in news 3, "After a crash, first heal the wounds before charging forward," which is exactly what we should be doing now.
However, we also see some positive signals, such as news 18 mentioning that the U.S. spot Bitcoin ETF welcomed its best weekly inflow in nearly three months last week after recent fluctuations, attracting $1.42 billion. News 20 and 33, 43 also mention that institutional giants like Vanguard Group and MicroStrategy are still continuously buying or hinting at expanding their Bitcoin investments. This indicates that despite the short-term macro sentiment being hit, institutions still have confidence in crypto assets in the long run. This decline may be a deep correction or "washout" within a long-term upward trend.
Comprehensive judgment and trading ideas:
Combining all these analyses, our judgment is much clearer.
Short and medium-term trends: The market is currently in a strong downtrend, especially with the 15-minute, 1-hour, and 4-hour charts showing significant bearish dominance. The extreme oversold RSI in the short term suggests a possible technical rebound, but this is just a "breather" and does not indicate an immediate trend reversal. Long-term trend: The large bullish structure on the daily level has been severely impacted but has not been completely destroyed. It is currently in a critical adjustment period, with bullish momentum significantly exhausted.
Key support and resistance levels: Short-term support: $92,000. Medium-term support: $90,000 (psychological level and also the lower edge of the stronger support range on the daily chart). Short-term resistance: $92,700-$93,000 (recent resistance above on the 15-minute/1-hour charts). Medium-term resistance: $93,500-$94,000 (MA area on the 4-hour chart). Long-term resistance: $95,000 and above.
Possible reversal patterns: Given the extreme oversold RSI, we may see the price attempt to build a bottom near $92,000, forming a W bottom or triple bottom pattern, or showing hammer lines, bullish engulfing, and other K-line reversal combinations. However, to truly confirm a reversal, we need to see a volume breakout above key resistance levels, and the MACD indicator gradually forming a golden cross from smaller time frames. Currently, market sentiment is still very fragile, and any rebound may face significant selling pressure.
Our trading ideas: The current market sentiment is very fragile; although the short-term bearish momentum is extremely oversold, the inertia should not be underestimated. We must not rush to "lick blood from the knife's edge" to seize a rebound.
Short-term traders: It is best to observe for now. If you must operate, wait for a clear stop-loss signal near $92,000 (such as consecutive small bullish candles or long lower shadows), and if trading volume supports it, you can try a small position for a short-term rebound, targeting $92,700-$93,000, but be sure to set a stop-loss, enter and exit quickly, and avoid prolonged battles.
Medium to long-term investors: There is no need to panic, but do not blindly bottom-fish. Although the daily level's major trend is challenged, institutional funds' long-term confidence remains. You can patiently wait for the market to stabilize, such as when the green bars on the daily MACD no longer shorten or even begin to show signs of a golden cross, or when the price forms a reliable bottom pattern in the $90,000-$92,000 range, then consider building positions in batches to lower the average cost.
For more quantitative breakdowns of how real-time news affects market sentiment, it has been updated in my Qinglan Crypto Classroom, qinglan.org. Finally, Sister Qinglan wants to say: "In a stormy market, patience is more valuable than impulse." We can wait for the rain to pass and then lay out our plans calmly; stability is the most important!
免责声明:本文章仅代表作者个人观点,不代表本平台的立场和观点。本文章仅供信息分享,不构成对任何人的任何投资建议。用户与作者之间的任何争议,与本平台无关。如网页中刊载的文章或图片涉及侵权,请提供相关的权利证明和身份证明发送邮件到support@aicoin.com,本平台相关工作人员将会进行核查。