Floating Bamboo in the Crypto Circle: 1.18 Bitcoin and Ethereum Short-term Pressure Analysis
Article edited on January 18, 2026, at 21:00. All opinions do not constitute any investment advice! For learning and communication purposes only.
Self-discipline hides infinite possibilities in life, and its depth also measures the height of life. Every step of deep cultivation has its own echo; the more disciplined one is, the further they go. I am Floating Bamboo, deeply analyzing mainstream coin trends, breaking down market logic with professional accumulation, and providing pragmatic trading ideas.
The cryptocurrency market showed a mixed and volatile trend over the weekend, with a total market value of about $3.35 trillion, fluctuating slightly by 0.5%-1.5% in 24 hours, and a trading volume of about $140 billion. Bitcoin consolidated in the $95,000-$96,000 range, briefly falling to around $94,800 in the early session before rebounding slightly. Ethereum was relatively stronger, holding the $3,200 level. Institutional ETF inflows were strong, but the delay of the CLARITY Act and the expiration of options (total value of about $3 billion) caused uncertainty. The performance of altcoins was mixed, with demand concentrated on large assets while smaller tokens lagged. BTC's dominance was about 57%, ETH's share was 12%, and the Fear and Greed Index was neutral to slightly bullish (around 55).
BTC benefited from a resurgence of institutional interest and easing geopolitical risks, with record ETF inflows and futures reaching $95,600, while CME trading volume surged. The CLARITY Act and optimistic predictions fueled the market, with institutions optimistic about breaking the $100,000 level. However, the expiration of options and a rebound in global bonds suppressed risk appetite, and after on-chain leverage washout, buying interest gradually increased. The number of active ETH addresses surged over 800k, with strong staking activity (reaching $170 million), and ETF inflows of about $160 million, leading to an increase in the ETH/BTC ratio.
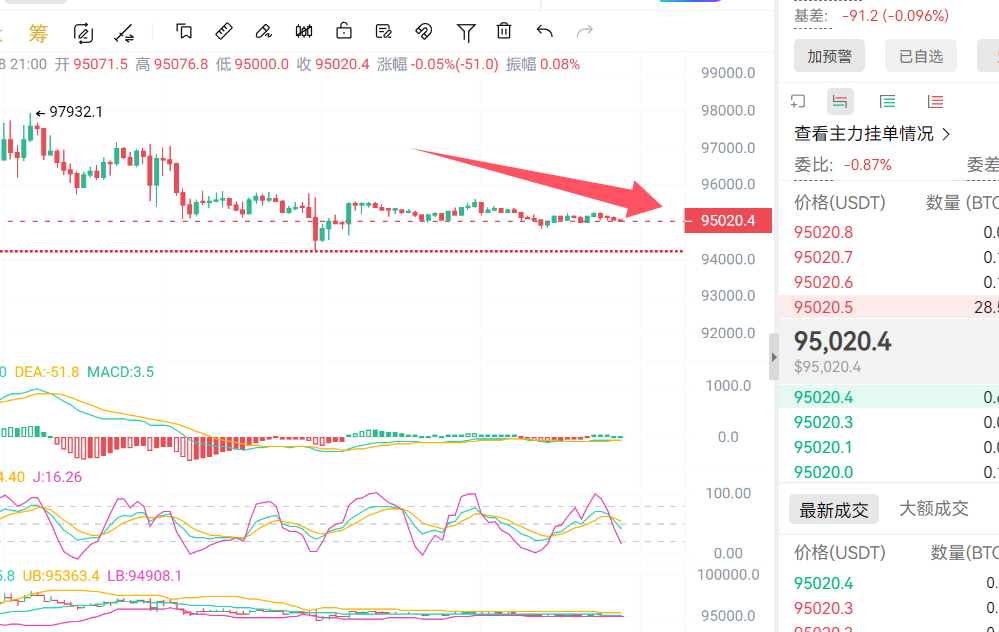
BTC is currently consolidating around $95,000. Daily trading volume is shrinking, RSI is around 50 (neutral), and KDJ is starting to converge, indicating a potential change in trend. It is operating close to the upper Bollinger band, facing resistance at $97,500. Short-term downward momentum is weakening, with support at $93,000-$94,000 and resistance at $98,000-$100,000. The market is entering a convergence zone, so be cautious of trend reversal risks. Consider light long positions near $94,000 and light short positions near $96,000.
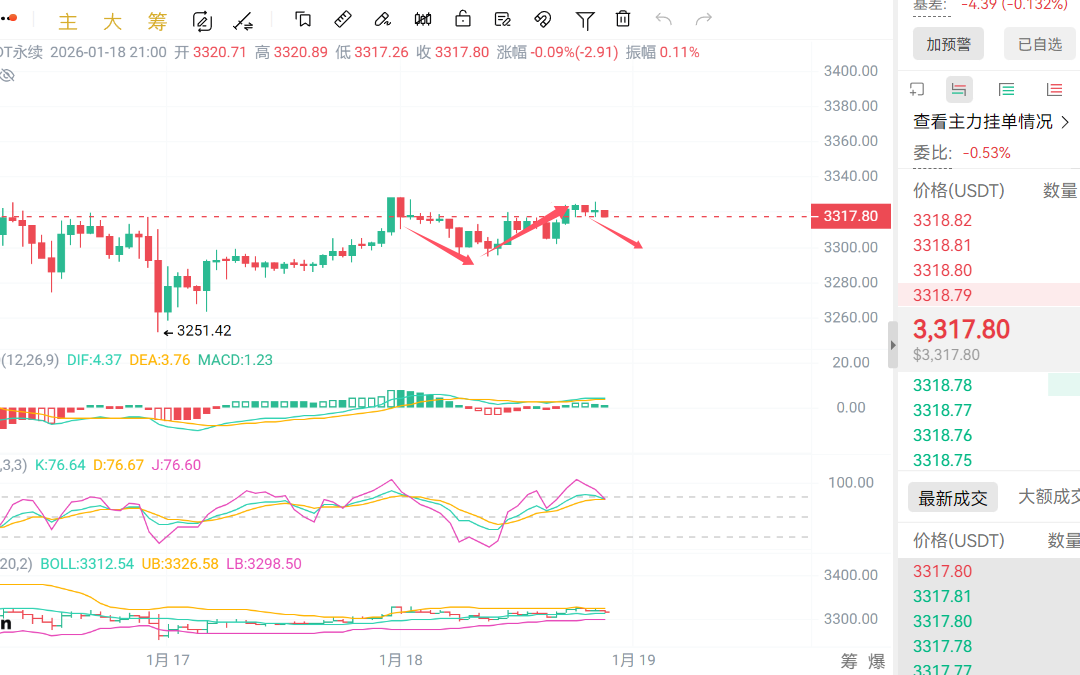
ETH is currently oscillating around $3,300, showing stronger performance than BTC. A head and shoulders pattern is beginning to appear on the 1-hour chart, with short-term support at $3,200-$3,300 and resistance at $3,400-$3,500. In terms of operations, consider light long positions near $3,200 and light short positions near $3,400. (Remember to control contract positions within 10% and set stop-losses.)
Disclaimer: The above content is personal opinion, and the strategies are for reference only and should not be used as investment basis. Any risks taken are at your own discretion.

Friendly reminder: The above content is created by the public account: Floating Bamboo, and the advertisements at the end of the article and in the comments section are unrelated to the author. Please discern carefully. Thank you for reading.
免责声明:本文章仅代表作者个人观点,不代表本平台的立场和观点。本文章仅供信息分享,不构成对任何人的任何投资建议。用户与作者之间的任何争议,与本平台无关。如网页中刊载的文章或图片涉及侵权,请提供相关的权利证明和身份证明发送邮件到support@aicoin.com,本平台相关工作人员将会进行核查。