Qinglan Crypto Class is starting! BTC's four cycles + dual perspectives on news, guiding you to step in sync with the rhythm of the crypto world.
- Technical Analysis: Multi-Cycle Perspective and Indicator Interpretation
Let's start with the big picture and gradually focus on the details.
Daily Cycle (1D) — Long-Term Trend: Steadily Improving, but Facing Short-Term Tests From the daily chart, BTC's long-term trend has been relatively healthy in recent times. K-line data shows that after a period of decline, starting around early January, the price rebounded strongly from around 85000, reaching a high of over 97000.
MA Indicators: The most exciting news is that the daily MA5 has crossed above the MA10 and MA20, and the MA5, MA10, and MA20 are in a bullish arrangement, with the price firmly above all short-term moving averages. This is a very clear long-term bullish signal! The moving average system indicates that there is strong long-term upward momentum.
MACD Indicator: The DIF line has crossed above the DEA line, forming a golden cross, and the MACD bars remain positive, indicating that bullish forces are still in control, confirming the upward trend.
RSI Indicator: Although the RSI has retreated from a high position and is currently around 63, it is in a strong area but not overly overbought, indicating that while market sentiment is active, it has not reached a frenzied level, leaving room for further upward movement.
Support and Resistance: The key support at the daily level is near the MA20, around the 91400-91500 area, which is the bottom of the previous consolidation and an important defense line for bulls. Recent resistance is at our previous high of 97000-97900, and even the psychological level of 100000.
4-Hour Cycle (4H) — Mid-Term Trend: Pullback Correction, Beware of Reversal The mid-term 4-hour chart has not been as strong recently, as it is undergoing a significant pullback process.
MA Indicators: The short-term MA5 and MA10 have started to turn downwards and are about to or have already crossed below the MA20. The price has also fallen below the MA5 and MA10, currently struggling just above the MA20. This indicates that the mid-term upward momentum is weakening, with a risk of turning downward.
MACD Indicator: The MACD DIF line has crossed below the DEA line, forming a death cross, and the MACD bars have turned negative, with the negative values expanding. This shows an increase in mid-term downward momentum, with bears starting to gain strength.
RSI Indicator: The RSI has quickly dropped from above 70 to around 57, although it is still above 50, this rapid decline indicates that bullish strength is quickly waning, and it is not far from a weak area.
Support and Resistance: In the mid-term, 95100-95200 is a recent small support level. If this position cannot hold, we will need to seek support from the daily MA20 below. The upper resistance is the recent high of 97000-97200.
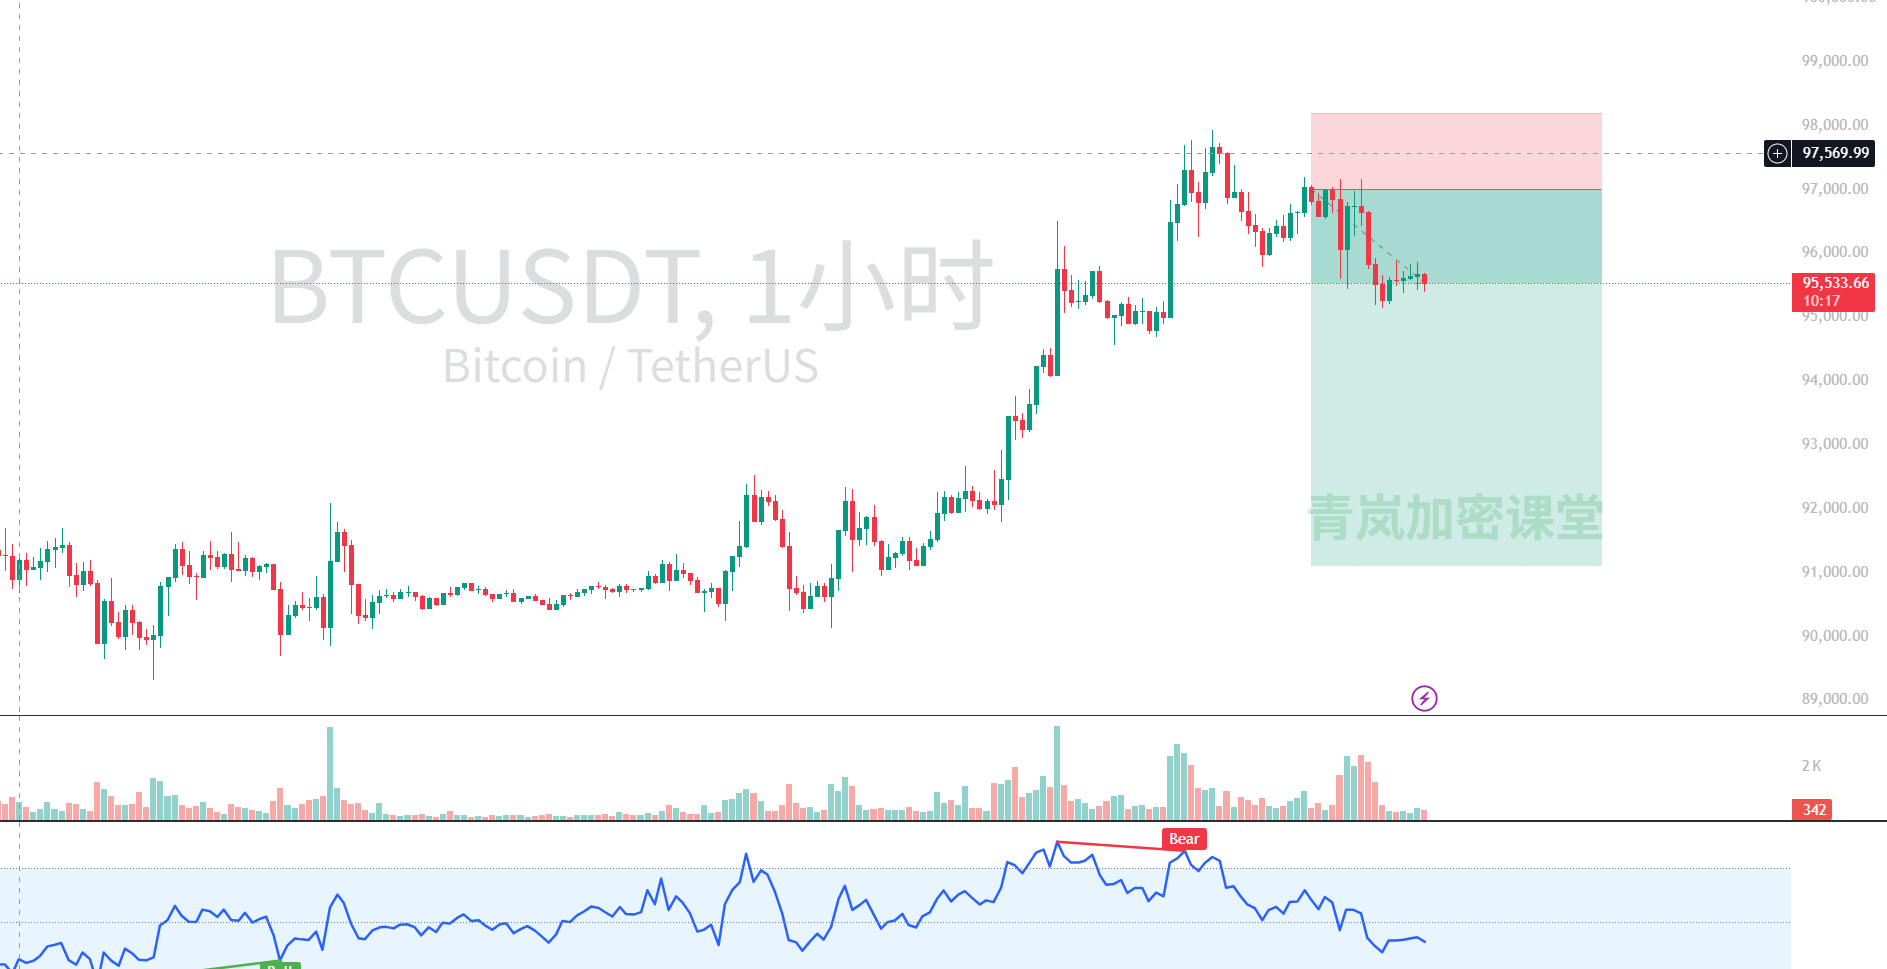
1-Hour Cycle (1H) — Short-Term Trend: Clear Downtrend, Weak Rebound The trend on the 1-hour chart is even less optimistic, as the short-term trend has clearly turned downward.
MA Indicators: The MA5, MA10, and MA20 have completely formed a bearish arrangement, with the price being suppressed below all moving averages, and each rebound touches the moving averages before falling back. This is a typical short-term downtrend pattern.
MACD Indicator: The MACD DIF line is deeply entrenched below the DEA line, with the bars consistently and significantly negative. Although there are fluctuations in the negative values, the overall trend is expanding downward, indicating very strong short-term bearish momentum.
RSI Indicator: The RSI hovers around 40, in a weak area, and has attempted to rebound multiple times but failed to break above 50, indicating a lack of buying momentum in the market.
Support and Resistance: Short-term support is near 95100, which is the recent low of the K-line. The resistance level is at 96000-96200, which is also near the MA10 and MA20.
15-Minute Cycle (15M) — Ultra-Short-Term Trend: Weak Fluctuations, Bottoming Out The ultra-short-term 15-minute chart, after experiencing a sharp drop last night, currently shows a weak fluctuation pattern.
MA Indicators: The short-term moving average system (MA5, MA10, MA20) has been in a bearish arrangement for most of the time, with the price running below the moving averages, indicating ultra-short-term weakness.
MACD Indicator: The MACD bars fluctuate repeatedly below the 0 axis, and the DIF and DEA lines are entangled below the 0 axis, indicating that both bulls and bears are in a tug-of-war within a very small range, but bears have a slight advantage.
RSI Indicator: The RSI oscillates mostly between 40-50, lacking a clear directional trend, and has failed to effectively break above 50, reflecting insufficient market confidence.
Support and Resistance: Ultra-short-term support is at 95400-95500, with resistance at 95700-95800.
- News Analysis: Bulls and Bears Intertwined, Institutions vs. Retail Investors
Now let's take a look at what today's news is saying.
Positive News: Strong Institutional Interest, Long-Term Optimism
Institutional Accumulation and Derivative Expansion: As mentioned in [18] and [42], "institutional accumulation" and "huge capital inflow" into Bitcoin, along with [37] mentioning large-scale short squeezes potentially pushing BTC to challenge 100,000, are all very strong long-term bullish signals. This indicates that large funds still have confidence in Bitcoin's future.
Policy Benefits: [17] West Virginia is considering allowing reserve funds to invest in Bitcoin to hedge against inflation, which is a direct benefit at the state government level in the U.S., further reinforcing Bitcoin's value storage attributes.
Infrastructure Development: [40] and [44] mention that the Chicago Mercantile Exchange (CME) will add futures for ADA, LINK, and XLM, representing the integration of the crypto market with traditional finance and the increasing demand for risk management of crypto assets by institutions. Although this is not directly aimed at BTC, it is positive for the long-term development of the entire market.
Real-World Application: [21] The payment volume of cryptocurrency cards has surpassed P2P stablecoin transfers, indicating that cryptocurrencies are increasingly accepted and used in real life, which is an important sign of industry maturity.
Negative News: Short-Term Pullback Pressure, Policy Uncertainty
"Qinglan Sister's" Pessimistic Forecast: [2] and [5] mention "weak rebound, bear market pause," and "the mid-term downward trend has not changed at all, the long-term bear market pattern is very stable!" Even mainstream coins are generally declining, which resonates with our short-term technical analysis of the downward trend, exacerbating market concerns.
Regulatory Uncertainty: [23] Democratic lawmakers criticize the SEC for retreating on cryptocurrency enforcement, and [33] and [41] Coinbase's opposition has led to delays in the review of cryptocurrency legislation, casting a shadow over the regulatory outlook for cryptocurrencies in the U.S. and negatively impacting market sentiment in the short term.
Individual Project Risks: [4] NIGHT token plummeting, [26] PEPE early investors cashing out, and [28] and [35] SHIB showing sell warnings reflect an increased market vigilance towards risk assets, with intensified capital outflows.
Others: [15] The Central Bank of Russia tracking cross-border cryptocurrency transactions, and [49] the X platform banning the InfoFi reward model, these tightening policy messages may restrict the free flow and application scenarios of cryptocurrencies, bringing certain bearish pressure.
- Comprehensive Judgment and Trading Suggestions
Overall, we are currently in a very interesting phase of intense bull-bear competition.
In the long term, BTC is still in a healthy upward channel. The bullish arrangement at the daily level and the MACD golden cross, combined with the continuous inflow of institutional funds and positive explorations from regulatory bodies (such as West Virginia), provide a strong boost for long-term investors, suggesting that the current pullback may be a healthy correction rather than a trend reversal. The psychological target of 100,000 is not out of reach.
However, in the mid-term and short-term, the market faces considerable pullback pressure. The 4-hour and 1-hour charts have clearly turned into a downward trend, with MACD death cross and bearish moving averages indicating strong short-term downward momentum. This aligns with the short-term pessimistic sentiment of some analysts (like "Qinglan Sister"). Retail FUD sentiment is high, while institutions are accumulating, which is a common phenomenon during market bottoming or basing processes.
Predictions and Trading Ideas:
- Short-Term (15-Minute/1-Hour) Trend: Weak Fluctuations, Cautious Operations.
Support Level: Our ultra-short-term strong support is in the 95100-95200 range, which is the recent low of several declines. If this position is effectively broken, we may test lower support, such as the daily MA20 around 91400-91500.
Resistance Level: The short-term resistance above is at 96000-96200, which is the moving average suppression area on the 1-hour chart, and 97000-97200, which is the recent high on the 4-hour chart.
Trading Suggestions: For ultra-short-term traders, if you see signs of stabilization or reversal with increased volume around 95100-95200, consider taking a small long position, targeting 96000-96200. However, set strict stop-losses, as the short-term trend is weak. If the price fails to effectively stabilize at resistance, consider looking for short opportunities above 96000, targeting previous lows.
- Mid-Term (4-Hour) Trend: Pullback Correction, Waiting for Stabilization Signals.
- Trading Suggestions: For mid-term traders, it is currently not advisable to blindly chase highs; wait for the market to fully pull back. Pay attention to the effectiveness of the 91400-91500 daily MA20 support. If the price receives strong support in this area and shows a reversal pattern (such as a W bottom or head and shoulders bottom), with MACD re-crossing and RSI rebounding, it will be a good opportunity for mid-line positioning. Conversely, if it effectively breaks down, a deeper pullback may be needed.
- Long-Term (Daily) Trend: Structural Bull Market Continues, Accumulate on Dips.
- Trading Suggestions: For long-term investors, the current pullback is a good opportunity to accumulate positions. You can gradually position in important support areas (such as the daily MA20, i.e., the 91400-91500 area, or even lower at the psychological level of 90000), hold long-term, and enjoy the benefits of future increases.
Possible Reversal Patterns:
Short-Term: If a double bottom or head and shoulders bottom pattern forms near 95100-95200, accompanied by increased trading volume, it may signal a short-term rebound.
Mid-Term: If the price stops falling near the 91400-91500 area, showing long lower shadows or bullish engulfing candlestick patterns, along with a MACD bottom golden cross, that will signal stabilization of the mid-term trend.
Overall, our market is like an athlete accumulating strength; although it is currently adjusting its breath and may seem a bit fatigued in the short term, the long-term goal and direction remain clear.
For more quantitative breakdowns of how real-time news affects market sentiment, check out my Qinglan Crypto Class at qinglan.org. Finally, here's a trading quote for everyone: "Amidst the myriad of market noises, the path is simple; hold onto the daily direction and capture the cycle's fluctuations, and you will be the most composed helmsman."
免责声明:本文章仅代表作者个人观点,不代表本平台的立场和观点。本文章仅供信息分享,不构成对任何人的任何投资建议。用户与作者之间的任何争议,与本平台无关。如网页中刊载的文章或图片涉及侵权,请提供相关的权利证明和身份证明发送邮件到support@aicoin.com,本平台相关工作人员将会进行核查。


