Ethereum #Bitcoin #EthereumRealTimeAnalysis #BitcoinRealTimeAnalysis
Hello everyone, I am Lao Lü. I update every few days, and this frequency is just right. It aligns with our internal trading frequency. The market movements are quite slow; without a few days for the price to run, it basically cannot break out. In the last analysis, we provided technical points for opening long positions. Whether you believe it or not, the price has indeed risen. Ethereum peaked at 3170, and Bitcoin reached a high of 92495 USD. The increase is not too significant, but we can say that our long position was perfectly timed. The long position around 3050 for Ethereum can be considered flawless, as it caught the lowest point. I won't repeat the technical analysis; one is the ratio line, and the other is the conversion of the previous resistance line. That's all I will say. Technically, Bitcoin still has some overlap, with severe spikes, but it has firmly held the 90100 position. You can see this clearly by looking at the four-hour candlestick chart, where the closing of the real body is evident. In the current market, as long as you don't overly bullish or bearish, you won't suffer. If you are overly focused on it, this trend will definitely cause you great pain. As I said, as long as the price goes above 3000, we look uniformly at 4000; if it drops below 3000, we uniformly look at 2100. The market seems to have formed a consensus. Lao Lü's view remains: watch the range, which will last for a long time. After the last pullback, our dual-currency long positions have been completed and executed, and the results are visible. Today's topic is: when to open short positions?
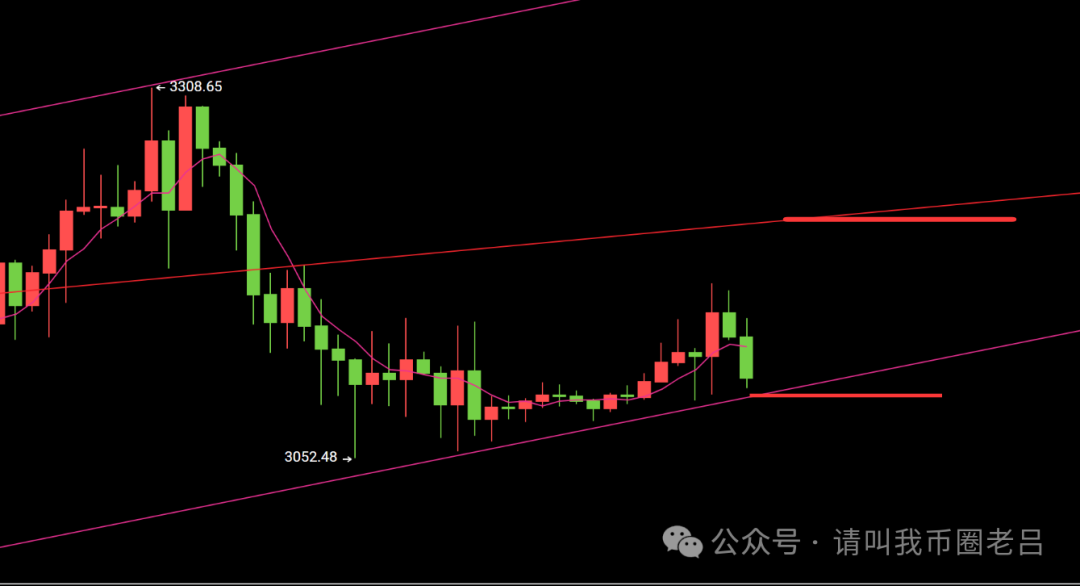
Ethereum has been moving up along the major support level of 3050 that we mentioned, but from the overall trend, the bulls are still strong. First, let's talk about the support level below: 3090 USD, which has already moved up and is no longer the previously mentioned 3050. The upward movement of the high level means that the bears only need to exert a little force to regain control. This means that we can only switch our long strategy to short if the entire body of the four-hour large bearish candlestick breaks below the 3090 line. The price trend and candlestick patterns determine our future direction, which is a prerequisite. Another point to pay attention to is the further resistance levels above: 3210 and 3450. We mentioned the 3450 daily resistance level in the previous article, but since it is too far away, I won't elaborate here. The key is whether the pressure at 3210 can withstand the strength of the bulls. I will put a question mark here. Now looking at 3090, if the price continues to drop to 3050, the probability of a short position will be greater rather than long, as we mentioned earlier because the support level has changed. If the price first drops to around 3090, we will continue to look bullish along the support and then see if the small resistance at 3210 can hold. Regardless of whether the price goes up or down first, this is the overall thought process. Just high sell and low buy; without effective breakthroughs, we won't make definitive conclusions on long or short.
Ethereum short at 3210 USD
Bitcoin, to keep it short, the support level continues to move up to 89888. If the body does not effectively break, we won't short. We will maintain a high sell and low buy strategy in the fluctuations. The root of suffering comes from being overly bullish and bearish. Therefore, avoiding greed is key. We will continue to refer to Bitcoin based on Ethereum's pattern. The resistance level above is: 92666 USD. If touched, we will short directly. This is the range we are looking at. Overall, refer to the second coin; the price movements are not large, so that's all for now! If there are significant fluctuations, we will see you in the next article.
Ethereum short at 92666 USD
免责声明:本文章仅代表作者个人观点,不代表本平台的立场和观点。本文章仅供信息分享,不构成对任何人的任何投资建议。用户与作者之间的任何争议,与本平台无关。如网页中刊载的文章或图片涉及侵权,请提供相关的权利证明和身份证明发送邮件到support@aicoin.com,本平台相关工作人员将会进行核查。