Regarding the structural performance of different cycles, this has been discussed repeatedly in previous analyses. Today, I will mainly summarize and judge the general direction of the market for next week based on the current situation.
I. Bitcoin Daily: Adjustment Continues, Bulls Not Weak
From the daily perspective, we are still in a period of central adjustment, and it is uncertain when this adjustment will end. However, according to previous expectations, this round of adjustment is likely to produce a higher high.
It is important to note that the price briefly broke above 94,000 before quickly retreating and testing 90,000 again, which seems more like a test of the previous high rather than an effective breakout, and there has not been a concentrated liquidation of the bears.
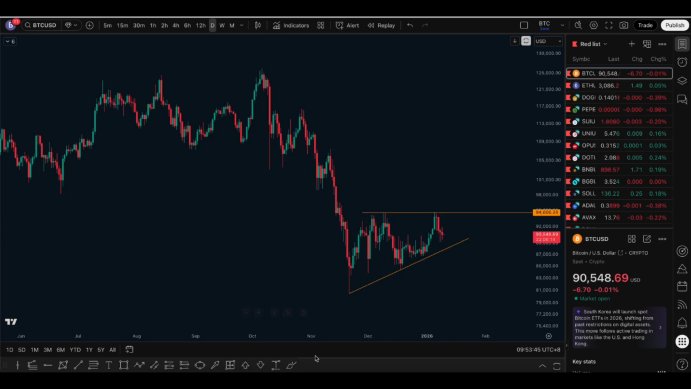
Structurally, the lows are continuously rising while the highs remain at relatively fixed positions. This pattern can be understood as an ascending triangle structure, essentially indicating an overall upward shift in the center of gravity, with the bulls gradually strengthening.
Therefore, based on the daily structure, the possibility of breaking through the resistance level at 94,000 still exists.
II. Short Cycle Structure: Testing Support, Entering Bottom-Building Phase
From the 4-hour level, the price has retraced to the support range of 0.5–0.68 of the upward segment, which is located below 90,000. Yesterday, there was also a clear double test process on the 1-hour level, corresponding to trading opportunities around 91,200.
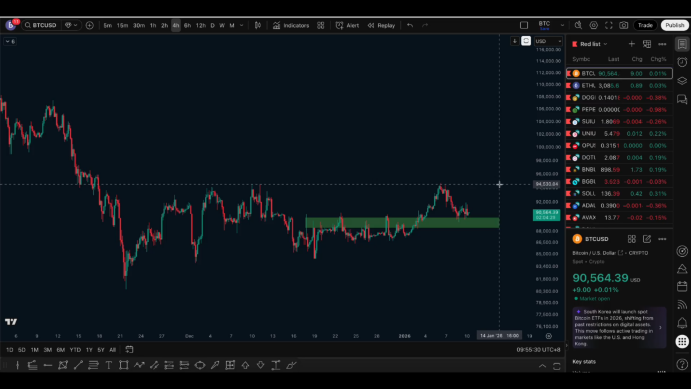
It is important to emphasize that support needs to be confirmed as effective, which usually involves multiple retests. Therefore, at this stage, if attempting to go long, the stop-loss point can only be placed below the previous low, and participation should be in small positions with low leverage.
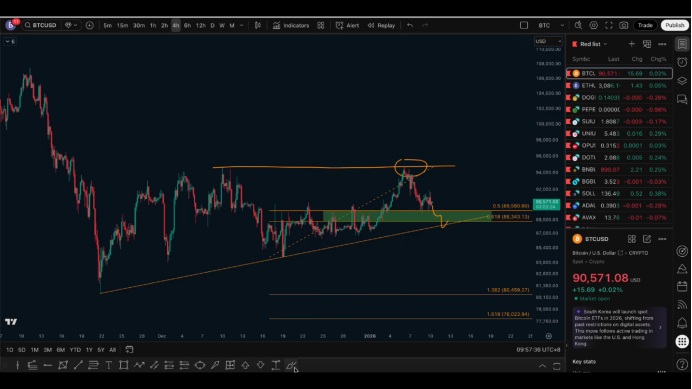
If the price subsequently falls below the 0.618 level, which is around 88,400, I would consider that this round of adjustment is likely over, confirming that 94,000 is an effective resistance level, and no higher highs are expected.
III. Ethereum: Structure Consistent with Bitcoin
For Ethereum, the previously focused resistance level is at 3050. Although it has not received much attention recently, its overall structure is highly consistent with Bitcoin and has not developed an independent trend.
Currently, the area around 3050 is an important support zone for Ethereum. If this level is effectively broken, the structure may become more complex, potentially indicating the end of the adjustment phase.
It is important to remind that it should not be simply understood as "if it breaks, it will definitely crash; if it holds, it will definitely surge." It is possible that the price forms a converging oscillation below the high and above the low, entering a prolonged consolidation phase.
From a personal perspective, if the support below can withstand the retest, a price breakout above the previous high, completing the liquidation of the bears, and then choosing a new direction would be a relatively more reasonable path. The area for concentrated liquidation of bears in Ethereum is roughly around 3,450, but the premise remains that support must hold.
IV. Conclusion
In summary, whether for Bitcoin or Ethereum, both are currently leaning towards a bottom-building phase after a correction. In the short term, the outlook remains biased towards a rebound and bullish sentiment, but the key lies in whether the support below can be effectively maintained.
Follow me, join the community, and let's progress together.

免责声明:本文章仅代表作者个人观点,不代表本平台的立场和观点。本文章仅供信息分享,不构成对任何人的任何投资建议。用户与作者之间的任何争议,与本平台无关。如网页中刊载的文章或图片涉及侵权,请提供相关的权利证明和身份证明发送邮件到support@aicoin.com,本平台相关工作人员将会进行核查。