The Qinglan Crypto Class is starting! BTC's four cycles + dual perspectives on news, guiding you to step in sync with the crypto market rhythm:
Daily Chart (Long-term Trend - Bottoming Rebound, Challenging Key Resistance) Trend: A clear bullish reversal pattern. After experiencing a deep correction from November to December, the price formed a double bottom in the 85000-87000 range, then broke through the downward trend line and the 20-day moving average with increased volume. Currently, the price is firmly above all short-term moving averages (MA5, MA10, MA20), which is an early bullish arrangement. Key Levels: Resistance: The most important resistance ahead is in the 95000-96000 range, which is the starting point of the previous decline and a dense trading area. Support: Strong short-term support is at 90000-91000 (the pullback level after the breakout), with stronger support below at 88000 (20-day moving average and previous platform). Indicators: MACD forms a strong golden cross below the zero line, with red bars turning green and continuously expanding, indicating strong momentum. RSI has pulled back from the oversold area to around 65, in a healthy bullish zone. The daily trend is bullish.
4-Hour Chart (Medium-term Trend - High-level Consolidation After Main Uptrend) Trend: Standard high-level consolidation after a one-sided rise. The price surged from around 87000 to a high of 94789, an increase of nearly 9%. It then oscillated in the 93500-94500 range, which is a normal digestion after a sharp rise. Key Levels: Resistance: The recent key resistance is the previous high of 94790; a breakout would target 96000. Support: The lower edge of the oscillation range at 93500, and further down at 92500 (MA20 moving average and previous breakout platform). Indicators: Moving averages show a perfect bullish arrangement, but the price has slightly deviated from MA5. MACD's dual lines are at a very high position, with red bars starting to shorten, indicating a slight decrease in upward momentum, but no death cross has occurred. RSI shows signs of a top divergence above 70, suggesting a need for short-term adjustment. The medium-term trend is bullish, but in a period of overbought correction.
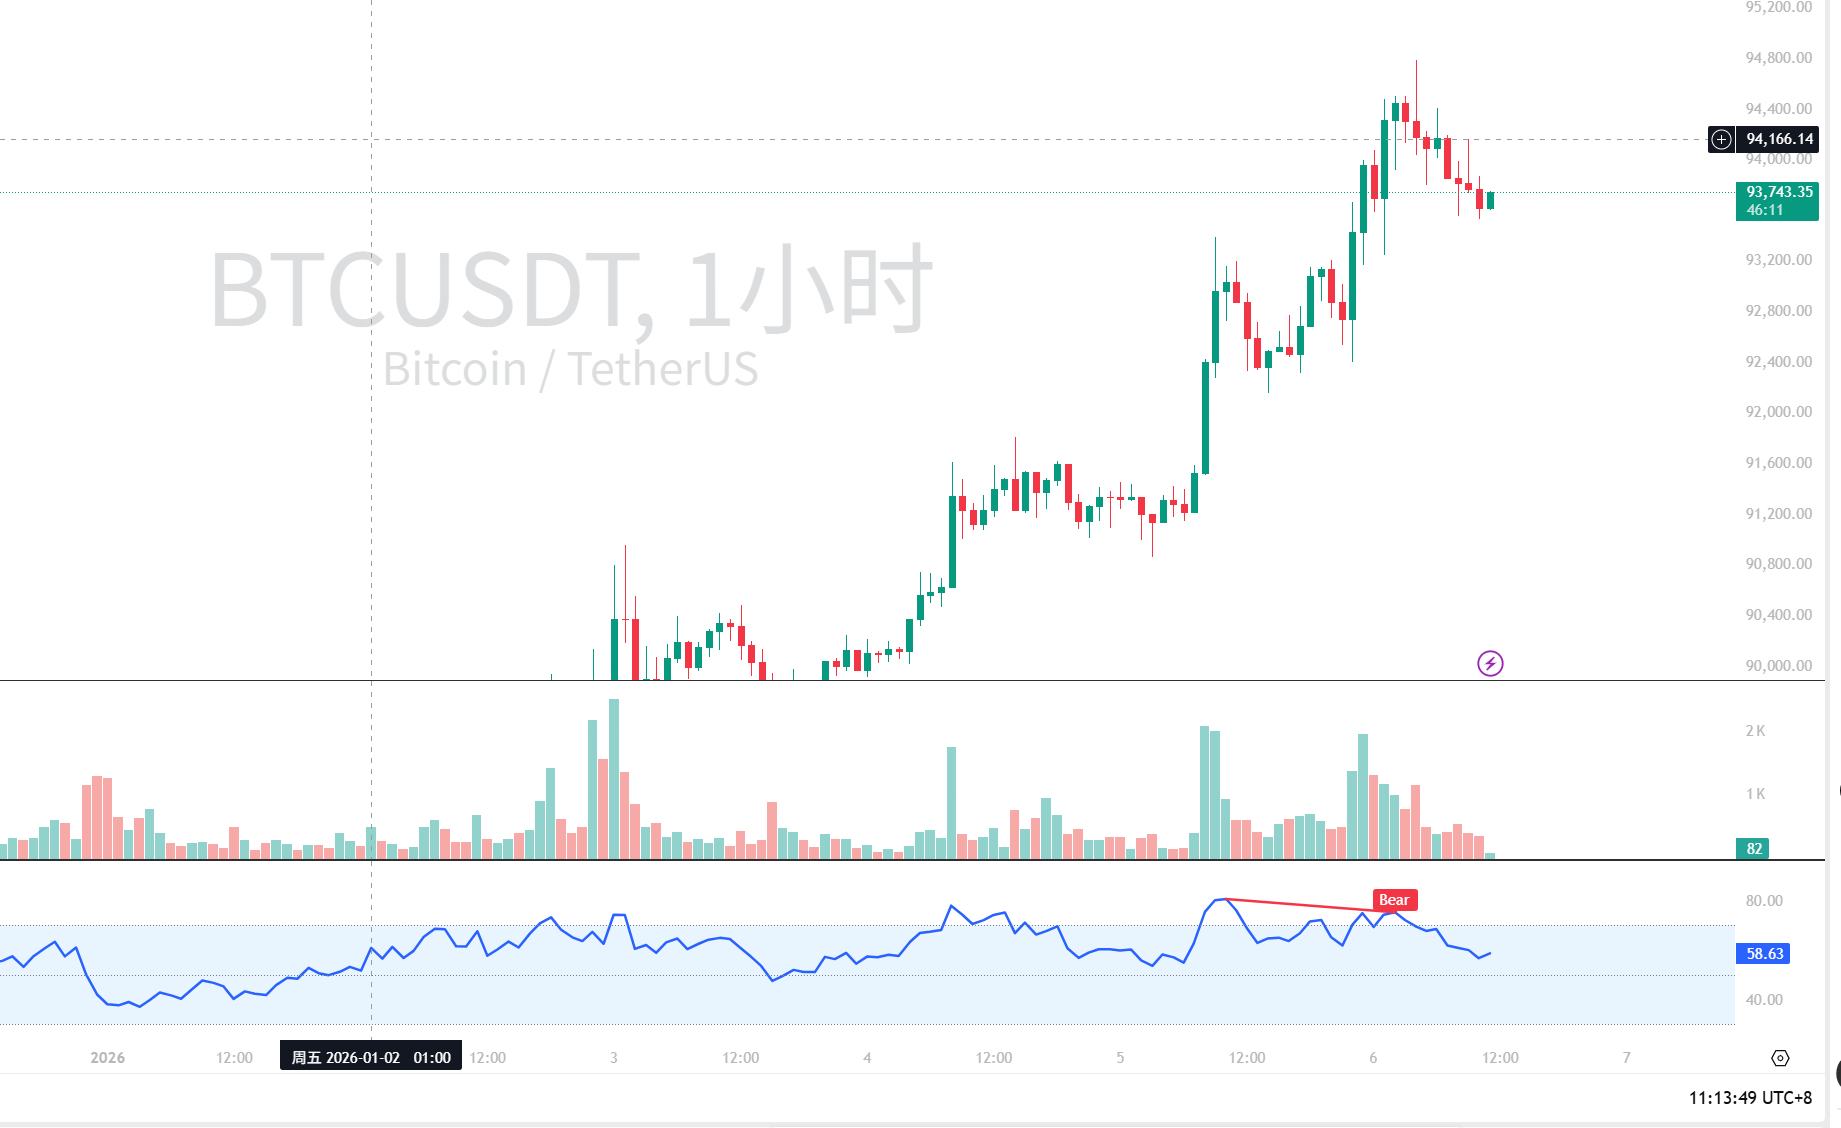
1-Hour Chart (Short-term Trend - Oscillation Pullback, Seeking Support) Trend: A clear high-level pullback consolidation. After reaching a high, the price has formed a small descending channel and is currently testing the support of the channel's lower edge and the MA60 moving average (around 93600). Key Levels: Resistance: The short-term descending trend line resistance is at 94200-94400. Support: 93600 (1-hour MA60 and channel lower edge); if lost, it may test 92800-93000 (previous starting platform). Indicators: MA5 and MA10 have crossed below MA20, indicating weakness in short-term moving averages. MACD has formed a death cross above the zero line, with green bars continuously expanding, signaling a clear adjustment. RSI has fallen from the overbought area to around 50, with bearish momentum being released. The short-term trend looks to be in a consolidation pullback.
15-Minute Chart (Ultra-short-term Rhythm - Weak Consolidation, Direction Pending) Trend: A typical directionless narrow oscillation. The price fluctuates back and forth in the 93600-94200 range, which is less than 1%, with intense long-short battles, but trading volume is shrinking, lacking breakthrough momentum. Key Levels: The upper and lower edges of the range serve as resistance and support. Indicators: Moving averages are highly intertwined. MACD is repeatedly entangled near the zero line, with both red and green bars being very short. RSI hovers in the neutral zone of 40-60. This indicates that the market is waiting for larger signals to break the balance.
Technical Summary: The market presents a typical stepped structure of "bullish on the daily, high-level consolidation on the 4-hour, pullback on the 1-hour, and chaos on the 15-minute." The large cycle upward pattern is intact, but the medium and short cycles need a healthy pullback to digest the overbought conditions and accumulate new upward energy.
II. News Resonance Interpretation
The overall news sentiment is warm, resonating with the upward trend in the technical analysis:
Macroeconomic and Regulatory Tailwinds: The crypto sector of the US stock market is experiencing a broad rise, and the fear index has risen to neutral, indicating a repair in market sentiment. US senators have questioned the government's sale of BTC and called for the establishment of a strategic reserve, which is a huge potential buying story in the long term, weakening the market's fear of "official selling pressure."
Continuous Capital Inflow: XRP and SOL spot ETFs are continuously attracting capital; although this does not directly affect BTC, it indicates that institutional interest in allocating to crypto assets remains strong, providing liquidity support for the entire market.
Positive On-chain Signals: Large whales are facing unrealized losses, long positions are turning profitable, and the market is experiencing "surrender-style selling" (losses > profits), which are often seen as signals of a phase bottom clearing, beneficial for the market to move forward lightly.
Risk Warning: Events such as Coinbase data leaks and NFT activity cancellations remind us that the industry is still in its early development stage, but this has not affected the core narrative. The impact of geopolitical events in Venezuela on mining costs is a long-term variable, with limited short-term disturbances.
III. Comprehensive Forecast and Trading Ideas
Our forecast: BTC is currently undergoing a medium-short term technical pullback within a long-term upward trend. The daily bullish structure remains intact, with the target still challenging the strong resistance zone of 95000-96000. However, short-term testing and confirmation of the support below need to be completed first.
Trading Ideas (for reference):
Bullish Strategy (Main Strategy): Do not chase highs; wait for a pullback to go long. Ideal entry zone: 92800-93500. This area is a confluence of the previous platform on the 1-hour chart, the 4-hour MA10 moving average, and the daily breakout pullback support. Signal Confirmation: Look for a 15-minute or 1-hour chart bullish candlestick pattern (such as a bullish engulfing or inside bar) in this area, while MACD's green bars shorten or form a bottom divergence. Risk Control: Stop loss for long positions can be set below 92000. Target: The first target is the previous high of 94790; after a breakout, look towards 96000.
Bearish Strategy (Secondary Strategy, for short-term experts only): Given that the 1-hour level adjustment has not ended, one can take a small position to bet on a short-term pullback. Entry Point: When the price rebounds to 94200-94400 (1-hour descending trend line and 15-minute upper edge of the range) and meets resistance. Target: Only look to exit at the 93600-93800 support zone. Discipline: This is a counter-trend short-term operation, requiring quick entry and exit, with strict stop loss above 94700.
Wait-and-see Strategy: If the price directly breaks through 94790 with increased volume, do not chase; wait for confirmation signals of a pullback that does not break 94500 before considering following up.
For more quantitative breakdowns of how real-time news affects market sentiment, updates are available on my Qinglan Crypto Class, qinglan.org. Finally, Sister Qinglan shares a trading quote with everyone, which also reflects my current mindset: "The trend is your friend, but friends also need to catch their breath. It's better to patiently wait for their invitation to rest than to exhaustively chase them while they run."
Alright, that's it for today's market analysis. The market changes rapidly; the above analysis is based on current data, so please ensure you manage your own risks. See you next time!
免责声明:本文章仅代表作者个人观点,不代表本平台的立场和观点。本文章仅供信息分享,不构成对任何人的任何投资建议。用户与作者之间的任何争议,与本平台无关。如网页中刊载的文章或图片涉及侵权,请提供相关的权利证明和身份证明发送邮件到support@aicoin.com,本平台相关工作人员将会进行核查。