Odaily specially invites market analyst Cody Feng, a master's degree holder in financial statistics from Columbia University, who has focused on quantitative trading in the U.S. stock market since college and has gradually expanded to Bitcoin and other digital assets. He has built a systematic quantitative trading model and risk control system through practical experience; he possesses keen data insights into market fluctuations and is committed to continuous deepening in the professional trading field, pursuing stable returns. He will delve into changes in BTC technology, macroeconomics, and capital flow weekly, reviewing and demonstrating practical strategies, and previewing significant recent events worth attention for reference.

Core Summary of the Weekly Trading Report:
• Strategy Execution (Short-term) Effectiveness Verification: Last week's trading strictly followed the established strategy, successfully completing two short-term operations (1x leverage), achieving a cumulative return of 0.62%.
• Core Viewpoint (Short-term) Verification: The short-term viewpoint we proposed last week has been validated by the market: If Bitcoin can effectively stabilize in the $86,000 to $86,500 range, it will maintain a fluctuation between $86,500 and $91,000. The price movement over the past week accurately confirmed this judgment. Last week, the price reached a high of $91,764 and a low of $86,675, which closely aligns with the key points we provided, confirming the fluctuation pattern.
In the previous analysis, we explored the possibility of a bearish trend; however, from the perspective of bullish forces in the current market, it may continue the current slight fluctuations and slow upward trend. When it touches the dual resistance of the descending trend line since last October and the long-term ascending trend line since the end of 2022, it could break out with a strong bullish candle, breaking through key resistance levels and forming a "short squeeze" market, clearing out short positions. Subsequently, it may conduct a second bottom test to clean up recent low-positioned bullish retail investors, thus completing the bottom formation. After that, the price is expected to rise rapidly, breaking away from the main cost area, initiating a strong technical rebound. It is important to clarify that the above trend is merely a favorable projection for bullish forces and is not guaranteed to occur. Regardless of how the market chooses, it is essential to remember the principle that "the market is always right," and choosing the correct response strategy is the hard truth.
I. Last Week's Trading Results: (12.29~01.04)
1. Short-term Trading Review (No Leverage):
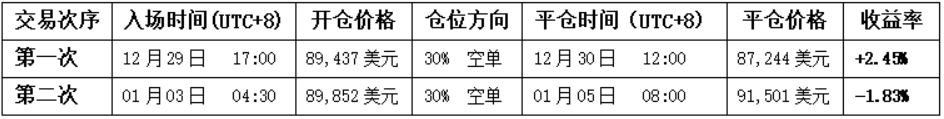
• First Trade (Profit 2.45%): Based on the "rebound to core resistance area meets resistance and short" model. When the price encountered resistance in the $89,500 to $91,000 area, the spread trading model simultaneously issued a top signal, allowing for the establishment of a 30% short position, which was ultimately closed for profit when the price fell back to the support area.
• Second Trade (Profit -1.83%): This time, the same position-building logic was used, but the price movement diverged from expectations. The price completed technical indicator repairs through sideways fluctuations, then slowly climbed, effectively breaking through the $91,000 key resistance level. Ultimately, when observing that both trading models resonated and issued a bottom signal, I decided to close all positions to stop losses.
2. Review of Last Week's Price Movement Predictions and Operational Strategies:
Last week's core viewpoint: Focus on the gains and losses in the $86,000 to $86,500 area. If it effectively breaks below, the price will fluctuate and test the bottom; if it effectively stabilizes, it will maintain a fluctuation pattern between $86,500 and $91,000.
① Core Point Review:
• Core Resistance Level: First resistance at the $89,500 to $91,000 area; second resistance at the $93,000 to $94,500 area.
• Core Support Level: First support at the $86,000 to $86,500 area; second support at the $83,500 to $84,500 area.
② Operational Strategy Review:
• Mid-term Strategy: Maintain around 65% mid-term position (short).
• Short-term Strategy: Based on the actual market movement, we ultimately executed Plan A (effectively stabilizing in the $86,000 to $86,500 area) as the core strategy.
• Opening Position: When the price rebounds to the $89,500 to $91,000 area and shows resistance signals, a 30% short position can be established.
• Risk Control: Short stop-loss set above $92,500.
• Closing Position: When the price drops to the $86,000 to $86,500 area and shows stabilization signals, close all short positions for profit.
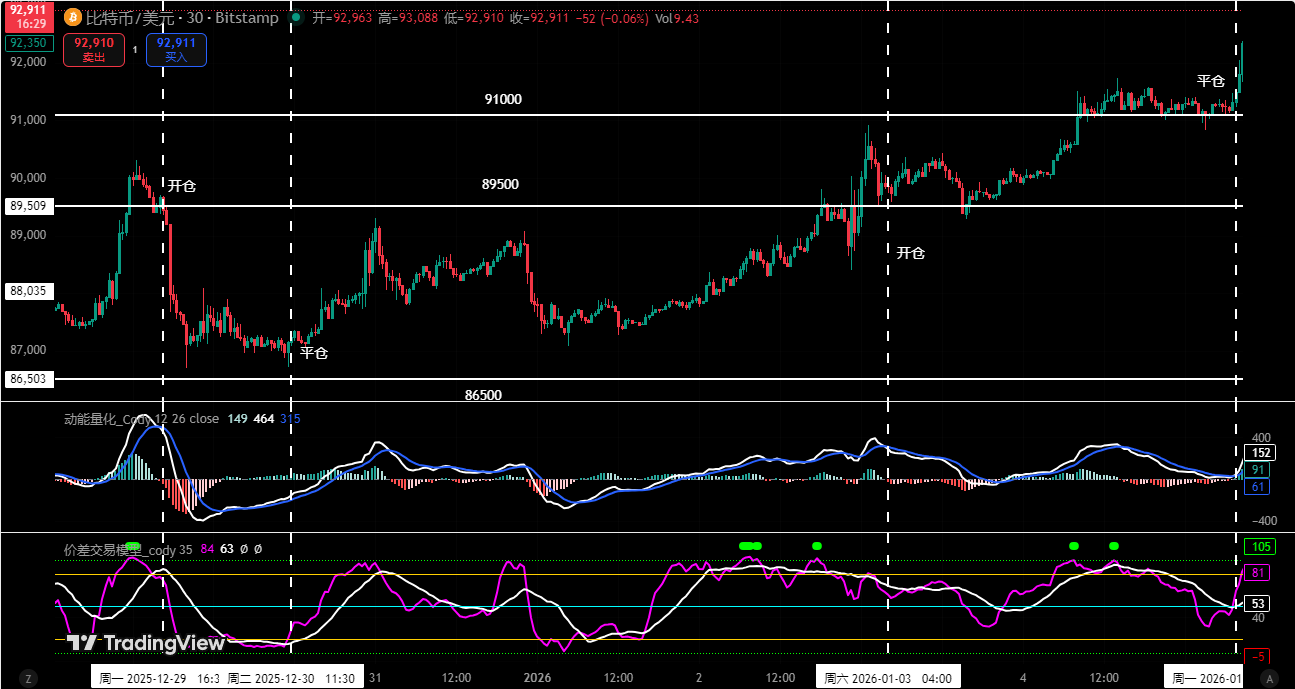
Figure 1
II. Quantitative Technical Analysis: How to Enter the Market
Combining last week's market operation, I will comprehensively use multi-dimensional analysis models to deeply analyze the evolution of Bitcoin's internal structure.
Bitcoin Weekly K-line Chart: (Momentum Quantitative Model + Sentiment Quantitative Model)
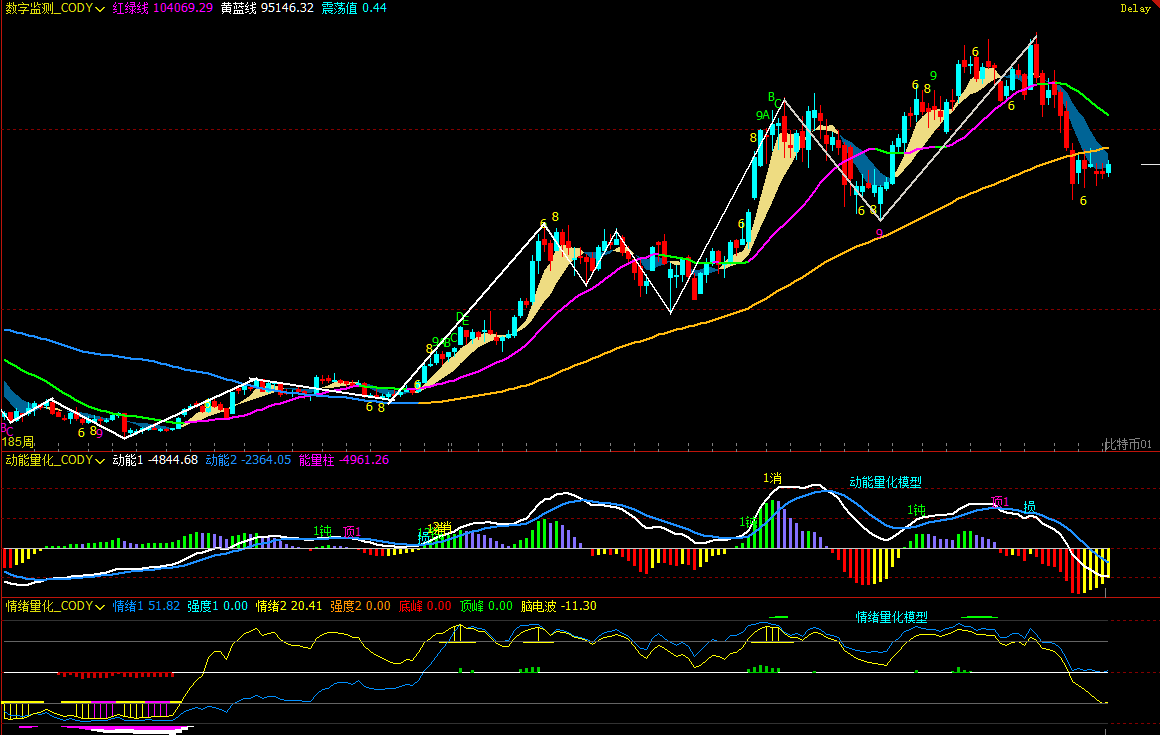
Figure 2
- As shown in (Figure 2), from the weekly chart analysis:
• Momentum Quantitative Model: Technical indicators show that the two momentum lines continue to decline below the zero axis, while the negative energy bars are showing signs of shrinkage. This reflects that although the bears dominate, their downward momentum has not fully exerted.
Momentum Quantitative Model indicates: Price decline index: High
• Sentiment Quantitative Model: The blue sentiment line value is 51.82, with an intensity of zero; the yellow sentiment line value is 20.41, with an intensity of zero, and the peak value is 0.
Sentiment Quantitative Model indicates: Price pressure and support index: Neutral
• Digital Monitoring Model: The price has been below the bullish-bearish (yellow-blue line) boundary for 7 weeks; short-term bottoming signals have not appeared.
The above data indicates: Bitcoin's weekly chart has entered a bearish trend, and we need to be wary of the risk of fluctuating adjustments.
Bitcoin Daily K-line Chart:
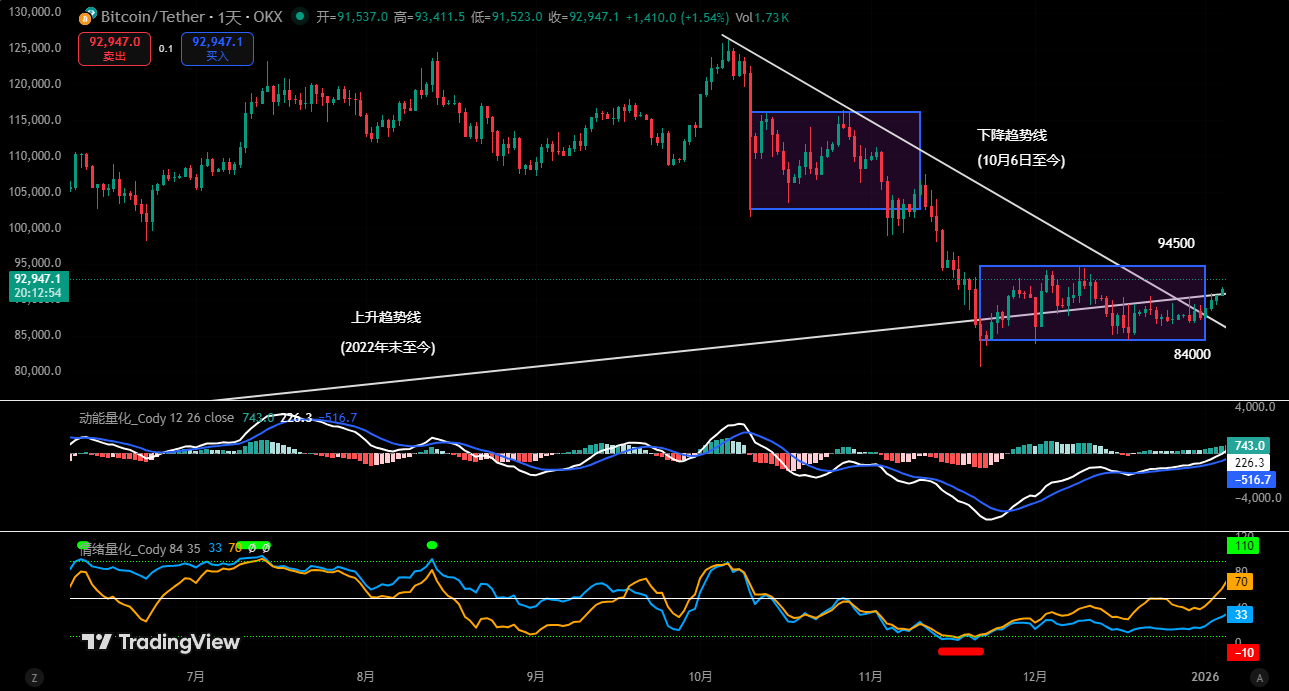
Figure 3
- As shown in (Figure 3), from the daily chart analysis:
• Momentum Quantitative Model: In the latter half of last week, the price rose for 4 consecutive days, and the two momentum lines gradually widened, with the white momentum line approaching the zero axis, showing signs of gradually increasing positive momentum.
Momentum Quantitative Model indicates: The area near the zero axis is a battleground for both bulls and bears; pay attention to the gains and losses around the zero axis.
• Sentiment Quantitative Model: After last week's Sunday close, the blue sentiment line value is 29, with an intensity of zero; the yellow sentiment line value is 61, with an intensity of zero.
Sentiment Quantitative Model indicates: Pressure and support index: Neutral
The above data suggests: The daily level is still in a bearish market, but the market is beginning to choose a direction.
III. This Week's Market Prediction: (01.05~01.11)
- Before the market makes a directional choice this week, the expected main fluctuation range is $84,000 to $94,500, and the operation should focus on the bullish and bearish performance near the boundaries of this range.
• If it effectively breaks below $84,000 key support, the price may initiate a bottom-testing trend, at which point the $80,000 level will be tested.
• If it effectively stabilizes above $94,500 key resistance, a stronger technical rebound trend may begin.
- Core Resistance Levels:
• First resistance area: $93,000 to $94,500
• Second resistance area: Near $97,500 to $99,500
• Important resistance level: Near $104,000.
- Core Support Levels:
• First support level: $89,500 to $91,000
• Second support level: $86,000 to $86,500
• Third support level: $83,500 to $84,500
• Important support level: Near $80,000.
IV. This Week's Operational Strategy (Excluding Sudden News Impact): (01.05~01.11)
- Mid-term Strategy:
• Before the price effectively breaks above $94,500, continue to maintain around 65% mid-term position (short).
• If the price successfully breaks through and stabilizes above $94,500, close all mid-term positions (short) and hold cash for observation.
Short-term Strategy: Use 30% of the position, set stop-loss points, and look for "spread" opportunities based on support and resistance levels. (Using 30 minutes as the operational cycle).
To respond to market developments, we have formulated three short-term operational plans: A/B/C:
• Plan A: If the price maintains a fluctuation in the $84,000 to $94,500 range:
• Opening Position: When the price rebounds to the $93,000 to $94,500 area and shows resistance signals, a 30% short position can be established.
• Risk Control: Short stop-loss set above $95,500.
• Reducing Position: When the price drops to the $86,000 to $86,500 area and shows stabilization signals, close part of the short positions.
• Closing Position: When the price drops to around $84,000 and shows stabilization signals, close all positions for profit.
• Plan B: If it effectively breaks below $84,000 support:
• Opening Position: If the price effectively breaks below, a 30% short position can be established.
• Risk Control: Stop-loss set above $85,000.
• Closing Position: When the price drops to around $80,000 and shows stabilization signals, gradually close positions for profit.
• Plan C: If it successfully breaks through and stabilizes above $94,500 resistance:
• Opening Position: If the price successfully breaks through, a 30% long position can be established.
• Risk Control: Stop-loss set below $93,000.
• Closing Position: When the price rebounds to around $97,500 and shows resistance signals, gradually close positions for profit.
V. Special Reminders:
When opening a position: Immediately set the initial stop-loss level.
When profit reaches 1%: Move the stop-loss to the opening cost price (break-even point) to ensure capital safety.
When profit reaches 2%: Move the stop-loss to the position of 1% profit.
Continuous Tracking: After that, for every additional 1% profit, the stop-loss level will move up by 1%, dynamically protecting and locking in existing profits.
(Note: The 1% profit trigger threshold mentioned above can be flexibly adjusted by investors based on their own risk preferences and the volatility of the underlying asset.)
VI. Key Events to Watch This Week: (01.05~01.11)
I. FOMC Officials Speak Intensively: A Forward Window for Policy Path Expectations
This week, several voting members of the Federal Reserve will speak intensively about the economic outlook and policy stance, forming an important source of information for the market regarding the future path of monetary policy.
On Monday at 01:30, 2026 FOMC voter and Minneapolis Fed President Kashkari will speak at the American Economic Association meeting;
On Tuesday at 21:00, 2027 FOMC voter and Richmond Fed President Barkin will speak;
On Friday at 23:00, Kashkari will deliver a welcome address and participate in informal discussions at an online meeting hosted by the bank;
On Saturday at 02:35, Barkin will speak again about the economic outlook.
The current core focus of the market is: Will officials maintain a "cautiously accommodative" tone, or will they begin to provide clearer signals for the next phase of policy shift? It is important to note that officials' speeches typically influence expectation structures rather than short-term directions, making them more suitable as a reference for mid-term capital pricing anchors.
II. ADP Employment Data: An Important Indicator Before Non-Farm Payrolls
On Wednesday at 21:15, the U.S. will release the December ADP employment figures, with a previous value of -32,000 and a market forecast of 45,000.
Before the non-farm payrolls are released, ADP plays more of a role in trend verification rather than pricing determination. The market's focus is not on single-month fluctuations but on whether employment is gradually shifting from "high resilience" to "moderate cooling."
If ADP shows a significant rebound, it will strengthen the short-term judgment that "employment still provides support," potentially raising U.S. Treasury yields and exerting some pressure on risk asset sentiment; if the data continues to be weak or falls below expectations, it will further validate the logic of a cooling labor market, providing a prelude for easing expectations, which is relatively friendly for Bitcoin's mid-term valuation.
III. Initial Jobless Claims: A High-Frequency Indicator to Observe Employment Turning Points
On Thursday at 21:30, the U.S. will release the initial jobless claims for the week ending January 3, with a previous value of 199,000 and a forecast of 216,000.
Compared to ADP and non-farm payrolls, initial jobless claims are more like a liquidity and economic thermometer. Persistently high levels above trend often indicate that the employment market is beginning to show structural loosening.
If initial claims continue to rise and remain above 210,000, it will strengthen expectations of economic cooling and policy easing, benefiting the valuation recovery of non-yielding assets like Bitcoin; if the data falls back again, it may reinforce the narrative that "the economy still has resilience," which would be unfavorable for risk appetite in the short term.
IV. Non-Farm Employment Report: The Most Critical Macroeconomic Pricing Node This Week
On Friday at 21:30, the U.S. will release the unemployment rate and seasonally adjusted non-farm employment figures for December.
The previous unemployment rate was 4.60%, with a forecast of 4.50%;
The previous non-farm employment figure was -105,000, with a forecast of 55,000.
If non-farm employment shows a moderate rebound and the unemployment rate remains high but does not worsen further, it will be interpreted by the market as "cooling but not stalling," and risk assets may maintain a range-bound movement; if employment data weakens significantly again and the unemployment rate rises, it may temporarily impact risk appetite, but in the medium term, it could reinforce easing expectations, providing potential support for BTC.
Financial markets are ever-changing, and all market analyses and trading strategies must be dynamically adjusted. All viewpoints, analytical models, and operational strategies mentioned in this article stem from personal technical analysis and are for personal trading logs only, not constituting any investment advice or operational basis. The market carries risks, and investments should be made cautiously; DYOR.
免责声明:本文章仅代表作者个人观点,不代表本平台的立场和观点。本文章仅供信息分享,不构成对任何人的任何投资建议。用户与作者之间的任何争议,与本平台无关。如网页中刊载的文章或图片涉及侵权,请提供相关的权利证明和身份证明发送邮件到support@aicoin.com,本平台相关工作人员将会进行核查。


