This morning, Bitcoin experienced a significant surge in volume. Taking this opportunity, let's focus on the structural changes in Bitcoin's 4-hour timeframe and how the market may evolve next.
Before diving into the analysis, let's briefly review our core viewpoints from recent times.
I. Why did we maintain a bearish outlook previously?
For a period, Bitcoin's price consistently operated below the first resistance level, primarily consolidating in a range.
During this phase, we maintained a bearish judgment, with the core idea being:
Wait for a new decline to occur
A new decline needs to be confirmed by effectively breaking below the previous low
The reason for maintaining this viewpoint is quite clear—multi-timeframe bearish structure. We have emphasized this logic multiple times before.
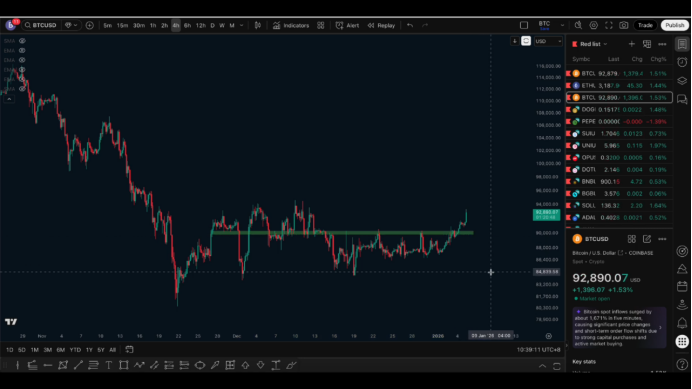
Before the structure changes, we chose to position short below the resistance, with the stop-loss set above 91,000, which is above the key level. As a result, this phase of short positions taken at high levels was able to cover risks and generate profits overall.
II. The key to changing our viewpoint: whether the resistance is effectively broken
Last Friday, we specifically mentioned one thing:
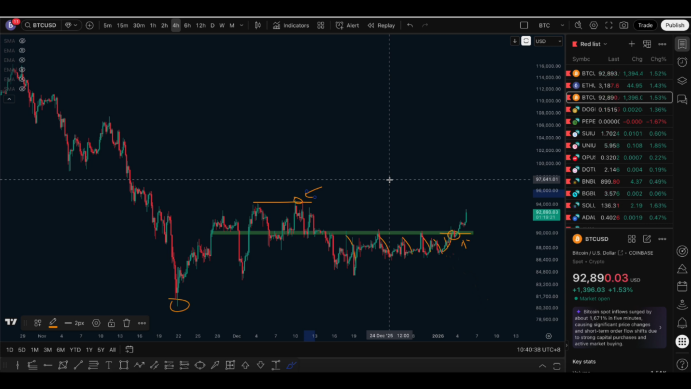
This upward price movement is testing the key resistance area again.
If the price can break above 90,000 and stabilize above it for adjustment, then the first resistance level may be effectively broken. Once the first resistance is breached, the nature of the market will change:
The probability of a continued upward rebound will significantly increase
The market needs to prioritize clearing out short positions
The price will likely test and break the previous high
In this case, the 94,000 level will be hard to view as an effective resistance.
It is against this backdrop that we clearly stated on Friday:
If the first set of levels is broken, the probability of breaking the second set of levels will also increase.
III. Why did we previously hold a bearish view, but now start to focus on bullish positions?
Many friends find this hard to understand:
Why maintain a bearish view within the range, but shift to focusing on bullish positions after a real breakout?
The reason is not complicated—we always follow the structure, rather than stubbornly sticking to a direction.
One of the biggest taboos in trading is to insist on a bearish position just because "we were bearish before." The market does not operate to prove anyone's viewpoint; once the structure changes, our trading plan must adjust accordingly.
Analyzing the market is merely an expectation of various possibilities; what we truly need to do is respect the price action that has already occurred.
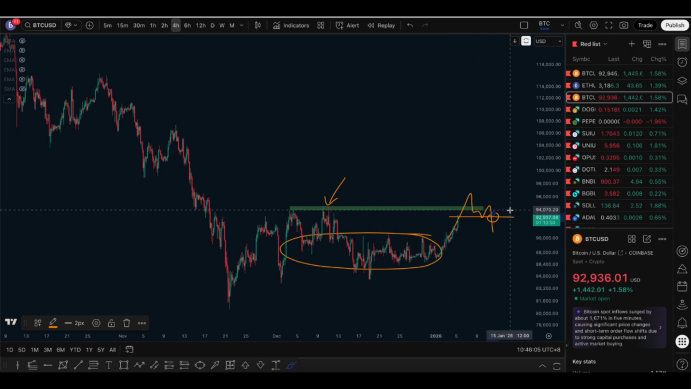
Before the first resistance level was broken, there were no clear signs of structural reversal from either the hourly or 4-hour timeframe:
Higher lows
But no higher highs
Key resistance was never effectively broken
The real breakout occurred at the 90,800–90,900 range. It was this breakout that confirmed the key resistance was effectively opened, providing a basis for the continuation of the rebound.
IV. The logic and target positions of the current rebound
Since the breakout of resistance, the price has moved up approximately 3,000 points. This again confirms one point:
It is not about being bullish in advance, but rather confirming at key levels before becoming bullish; in the long run, this approach has a higher win rate.
Currently, our viewpoint remains unchanged:
94,000 is a very important short-term target
Since the first resistance has been broken, the probability of breaking the second resistance will significantly increase
Once 94,000 is broken, it means a concentrated liquidation of short positions
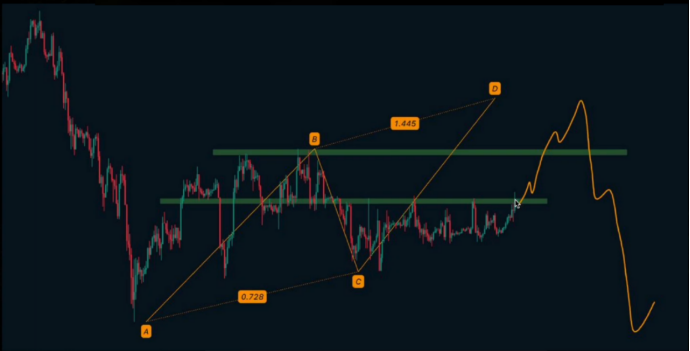
Next, we will focus on two possible paths:
First scenario
If 94,000 is broken and then quickly retraces, forming a clear reversal structure on the 4-hour level, then the long-term bearish trend will regain dominance.
Second scenario
If 94,000 is broken and the price continues to rebound, then it is possible to see a segment of equidistant upward movement, with the theoretical upper limit of the rebound likely around 98,000–99,000.
It is important to note that this rebound is more akin to a daily-level rebound correction rather than a trend reversal.
V. The outlook for larger timeframes remains bearish
From the weekly and daily perspectives, the 50-week moving average remains an important boundary between bullish and bearish. Historically, there have been multiple instances of:
Breaking below the moving average
Rebounding back to test it
Then weakening again
The current rebound also resembles completing such a retest structure.
From a larger timeframe perspective, I personally still believe that in the next decline, 70,000 is a very critical level; once it breaks, it will become an important target for the next bearish phase.
But before that, we first need to see—
The complete execution of this rebound structure.
Therefore, there is no need to rush into a medium to long-term bearish position; the current phase should still focus on observing the rebound.
Follow me, join the community, and let's progress together.

免责声明:本文章仅代表作者个人观点,不代表本平台的立场和观点。本文章仅供信息分享,不构成对任何人的任何投资建议。用户与作者之间的任何争议,与本平台无关。如网页中刊载的文章或图片涉及侵权,请提供相关的权利证明和身份证明发送邮件到support@aicoin.com,本平台相关工作人员将会进行核查。


