Cryptocurrency News
January 5 Hot Topics:
1. Michael Saylor releases Bitcoin Tracker information again, possibly hinting at another BTC purchase.
2. Ether.fi CEO: Ethereum's growth in 2026 will be driven by new crypto banks, with institutional investment continuing to flow in.
3. PwC is increasing its efforts in the cryptocurrency sector.
4. California proposes a 5% asset tax on billionaires, cryptocurrency tycoons threaten to leave.
5. Infinex launches token sale on Sonar, currently raising only $491,000.
Trading Insights
Key components of a trading system:
- Trading targets: Clearly define the types of cryptocurrencies to trade; different coins have varying characteristics and potential. Choosing the right target is the foundation of trading.
- Position management: Determine the proportion of invested funds relative to total capital, allocate funds reasonably, and avoid excessive concentration or diversification of investments.
- Trading direction: Assess whether to go long (buy) or short (sell); accurate direction assessment directly impacts profits and losses.
- Entry point selection: Identify the right timing to enter the market; poor timing may lead to high costs or missed profit opportunities.
- Stop-loss setting: Establish a bearable loss threshold; once reached, immediately stop loss to prevent further losses.
- Take-profit strategy: Plan profit targets; once targets are reached, take profits promptly to lock in gains.
LIFE IS LIKE
A JOURNEY ▲
Below are the real trading signals from the Big White Community this week. Congratulations to those who followed along; if your trades are not going well, you can come and test the waters.
Data is real, and each trade has a screenshot from the time it was sent.
**Search public account: *Big White Talks About Coins*
Bilibili and YouTube account: Daquan777
BTC
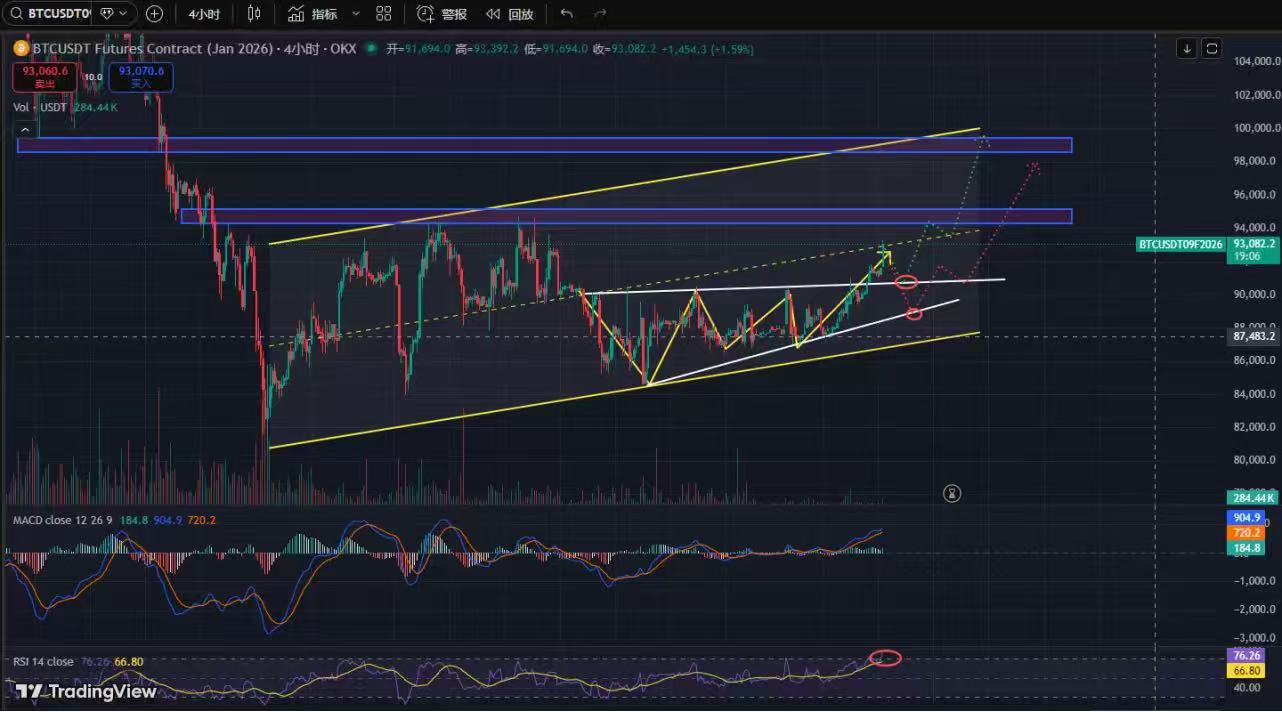
Analysis
Bitcoin broke through the descending trend line with a strong weekly bullish candle last week, continuing the rebound this week. The price is currently in the pullback confirmation phase after the breakout, situated near the upper edge of the rectangle oscillation around 94,000. A breakout will open up upward space; the daily line has completed the long-term descending trend line breakout and has shown five consecutive bullish candles. Key resistance levels: 94,500 (W bottom neck line), 99,500 (upper boundary + FVG gap); if there is a pullback but it does not break below the lower boundary of the channel, the overall bullish structure remains intact; both MACD and RSI have formed golden crosses, and the Bollinger Bands are opening upwards; for short-term levels, focus on the 4-hour chart, looking for short-term opportunities.
- In the short term, the 4-hour chart has formed a triple bottom, with the overall direction in a fluctuating upward channel, currently operating in the mid-channel area. Continue to rebound and pay attention to resistance around 94,500 (previous high consolidation platform), with the second resistance at around 98,500 (upper boundary of the channel).
For pullbacks, the first low to catch is around the neck line at 90,700, the second is around the upward trend at 88,700. Pay attention to the support at the lower edge of the main direction channel at 87,500, which should not be effectively broken.
In terms of indicators, the MACD and RSI golden crosses upwards may continue the rebound trend, but there is a bit of overbought risk.
ETH
Analysis
Ethereum broke through the descending trend line with volume last week, and the current weekly line continues to show bullish candles, indicating a potential trend reversal. If it pulls back to 3,050 and does not break, the upward target looks towards 3,490 (M top neck line); the daily line shows five consecutive bullish candles, continuing to oscillate upward after breaking the descending channel. Current resistance level: 3,395 (previous high); if effectively broken, it may form a W bottom structure. For pullbacks, pay attention to: 3,100 (mid-channel), 3,050 (lower boundary + neck line); the 4-hour chart has formed a clear upward channel, with indicators bullish but with overbought risks.
Disclaimer: The above content is personal opinion and for reference only! It does not constitute specific operational advice and does not bear legal responsibility. Market conditions change rapidly, and the article has a certain lag; if you have any questions, feel free to consult.
免责声明:本文章仅代表作者个人观点,不代表本平台的立场和观点。本文章仅供信息分享,不构成对任何人的任何投资建议。用户与作者之间的任何争议,与本平台无关。如网页中刊载的文章或图片涉及侵权,请提供相关的权利证明和身份证明发送邮件到support@aicoin.com,本平台相关工作人员将会进行核查。