The information, opinions, and judgments regarding the market, projects, currencies, etc., mentioned in this report are for reference only and do not constitute any investment advice.
The tightening of macro liquidity in the United States, combined with the cyclical sell-off, has led to a BTC adjustment that has lasted for over two months. As liquidity gradually recovers, U.S. stocks are returning to historical highs, while BTC, which is a leading indicator of liquidity, has seen a slight rebound but continues to fluctuate at adjusted low levels, with over 30% downside potential remaining from previous highs.
Although the Federal Reserve cut interest rates again in December, marking a turning point for short-term liquidity, market funds remain tight. Additionally, the real yield on 10-year U.S. Treasuries is still around 4.12%, putting significant pressure on long-duration assets. This can be attributed as one reason for BTC's weak rebound.
There is also a lack of progress in industrial policy and consensus diffusion, with the "Structure Act" still under discussion. In contrast, DAT Company is under pressure, and the prominent Strategy Company has increased its "winter" cash reserves through a stock issuance this month. This has further weakened market confidence in BTC's rebound.
On-chain data shows that the entire market is experiencing losses exceeding 30%, remaining under significant pressure. Long positions are still locking in profits, while short positions selling at a loss are weakening, but unrealized losses remain high. This indicates that the market is still mired in difficulties and needs more time to clear losses and build up bullish momentum before it can perform.
The "BTC Cycle Multi-Factor Assessment Model" from EMC Labs shows that most indicators indicate BTC is still in a bear market, making it difficult to turn around. In the context of macro liquidity not improving further and continued market clearing, it remains unclear whether this decline is a strong "mid-term adjustment" or if it is entering a "deep bear market" after the four-year halving.
In this monthly report, in addition to analyzing the latest market developments, we will introduce a new concept called "Cold Bear," attempting to observe the BTC market in the transition between old and new cycles.
Macro Liquidity: The Turning Point Has Passed, But No Flooding Again
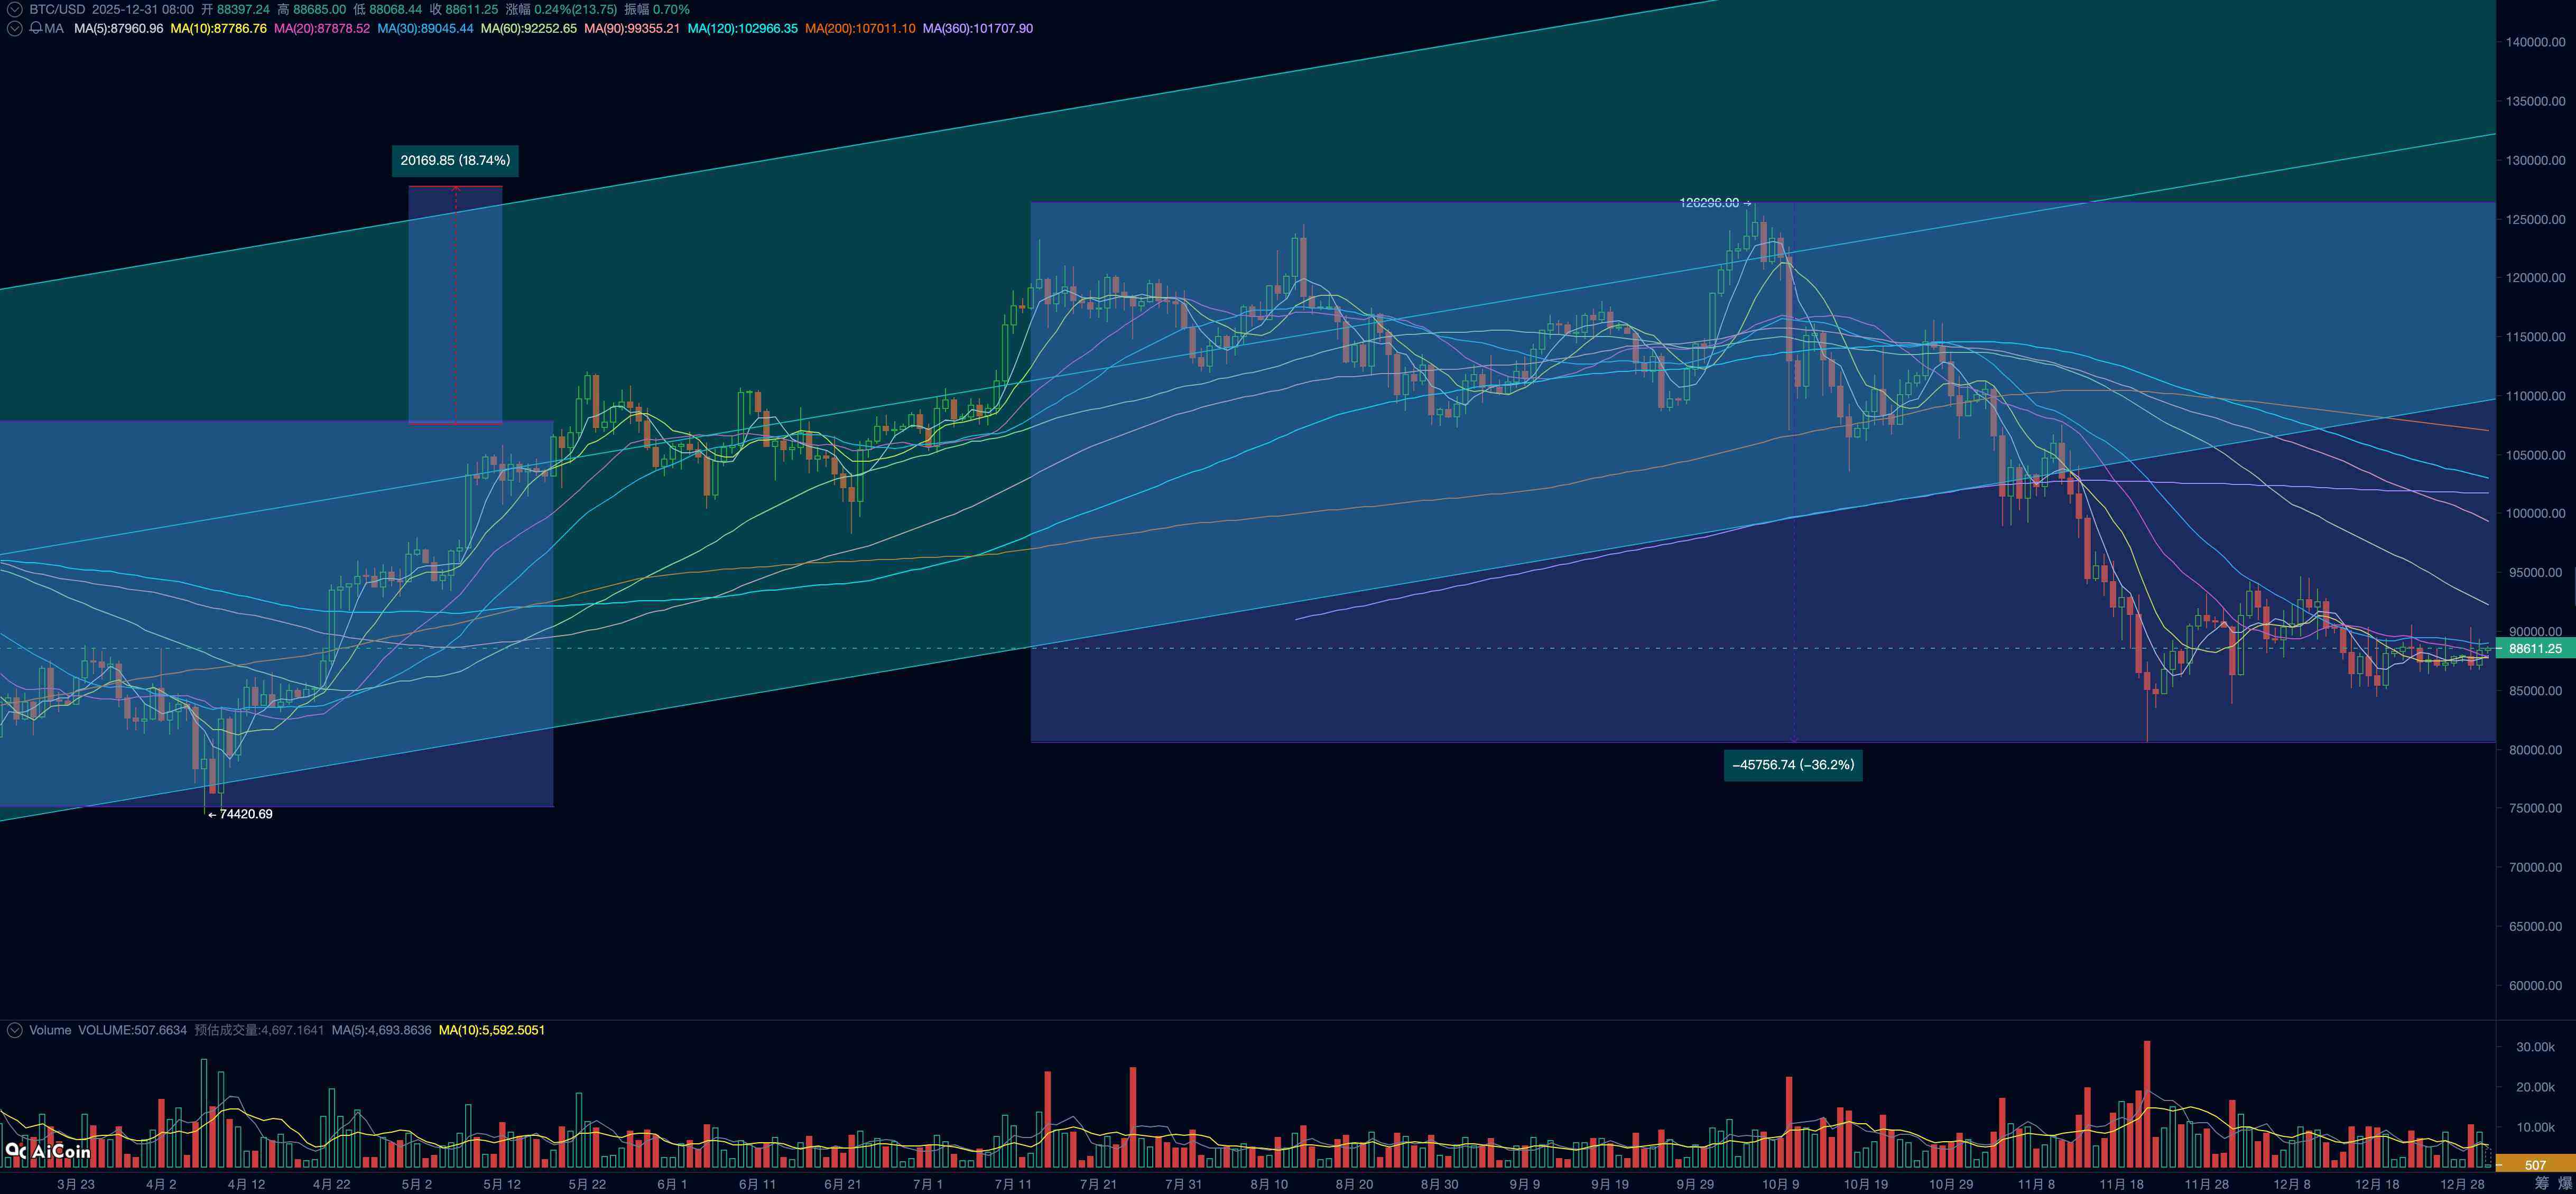
BTC Price Daily Chart
The market's expectations for the December interest rate cut have experienced a rollercoaster since November, severely impacting BTC's upward momentum. Ultimately, the interest rate meeting on December 10 resulted in a 25 basis point cut to 3.50%~3.75%. The Federal Reserve's statement emphasized that in the "dual target risk assessment," the downside risk on the employment side has increased, while inflation "remains slightly high"; future adjustments will depend on data, outlook, and risk balance. This indicates that the Federal Reserve is currently slightly leaning towards the employment side in its dual mandate. The dot plot shows one rate cut of 25 basis points in 2026, but the market is pricing in two cuts totaling 50 basis points.
On December 16, the U.S. Department of Labor released non-farm employment data for October and November. The October non-farm employment fell by 105,000, while November saw a rebound of 64,000 from the low, but it remains weak, with the unemployment rate rising to 4.6%, the highest point since 2022. This data supports the market's expectations for a rate cut by the Federal Reserve in 2026.
Additionally, on December 18, the U.S. Bureau of Labor Statistics released the November CPI data, showing a year-on-year increase of 2.7%, significantly below the expected value of 3.1%, and core CPI increased by 2.6%, also well below the expected value of 3%. Due to government shutdowns and insufficient data collection, this data may have statistical distortions, and its repeatability needs to be verified by subsequent data. The Federal Reserve's "third-in-command," John Williams, also emphasized this point in public remarks. This means that a rate cut in January remains a low-probability event.
The market has basically completed pricing for a halt in rate cuts in January. This makes it difficult to say that mid-term liquidity in the market is in an optimistic state.
Entering December, the Federal Reserve stopped "quantitative tightening," completing a soft landing from "active reduction" to "moderate balance." To address the tax period and seasonal funding needs in mid to late December, the Federal Reserve began purchasing short-term U.S. Treasuries through "Reserve Management Purchases" (RMP). This is equivalent to releasing hundreds of billions of dollars in liquidity into the market. However, the Federal Reserve cautiously stated that this is merely a technical operation and not a shift in monetary policy.
In summary, we believe that the market has preliminarily completed pricing for a "soft landing" or "no landing" of the U.S. economy in the post-pandemic era. Inflation is likely to decline slowly, but it is difficult to return to the 2% target in the short term. The economic growth driven by AI investment and introduction has achieved a high pricing level (with the S&P 500 price-to-earnings ratio at historical highs) and is being scrutinized for profit returns, while the unemployment rate may remain high due to changes in the labor market.
Further observation shows that as bond purchases and the Treasury General Account (TGA) decrease, the short-term net liquidity injected by the Federal Reserve has crossed a turning point, which is also the fundamental reason why U.S. stock indices can return to historical highs. 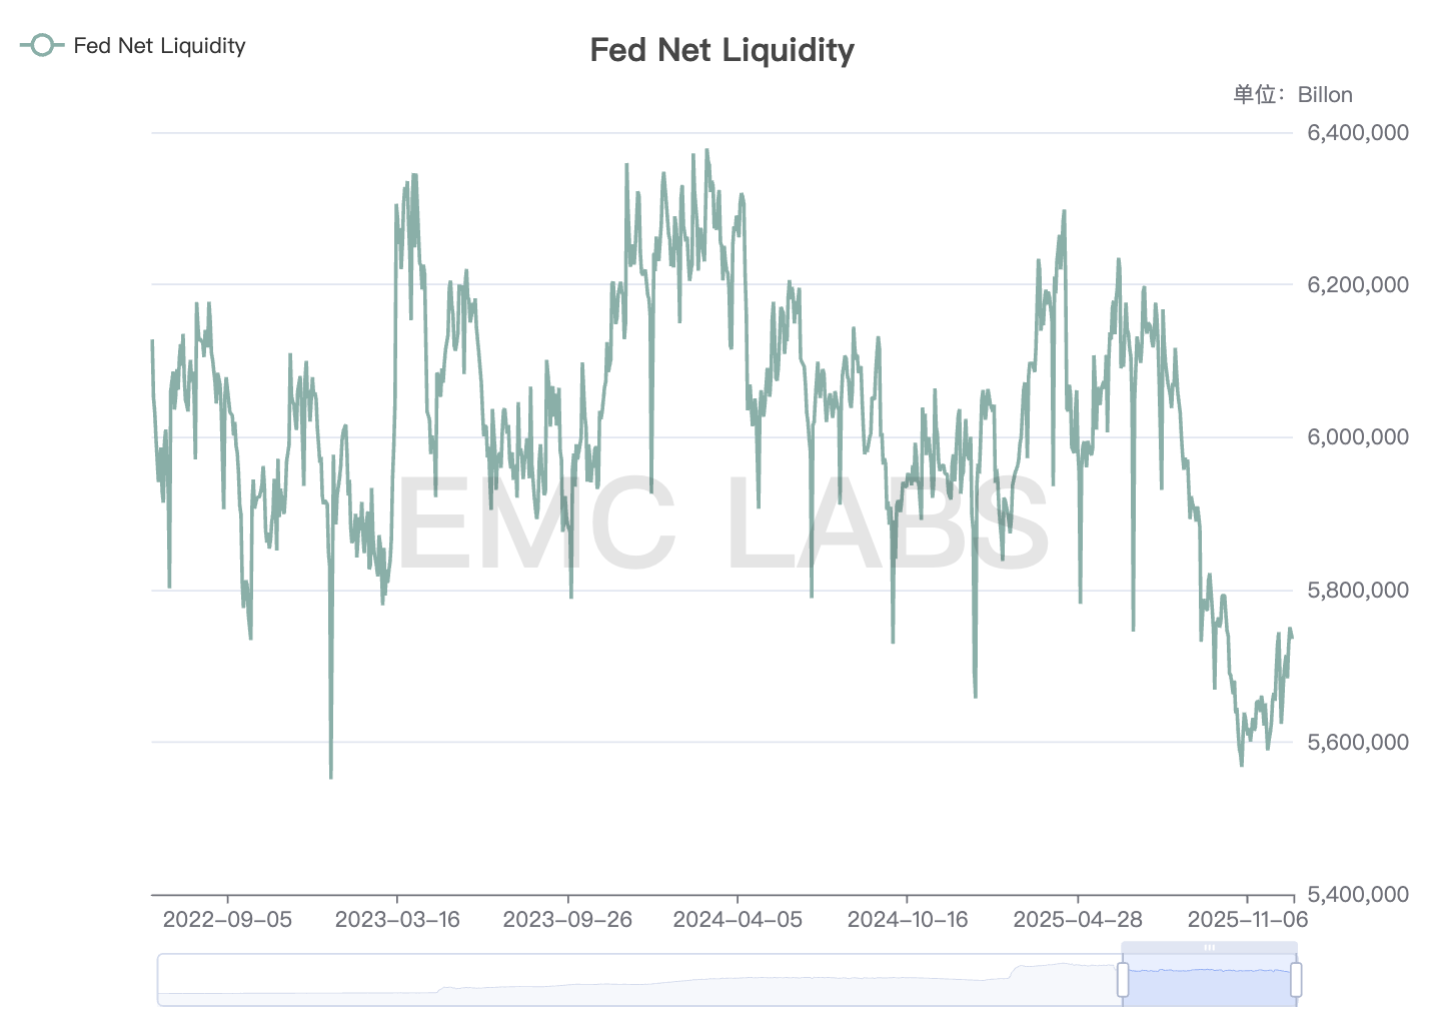
Federal Reserve Net Liquidity Supply
However, overall liquidity remains at low levels since 2022 and has not truly returned to a relatively abundant phase. Additionally, the Federal Reserve has stated that its dual mission of preventing inflation and maintaining employment makes it difficult to return to a state of liquidity flooding.
By the end of the month, the global asset anchor, the 10-year U.S. Treasury yield, remains at a high level of 4.12%, with real rates also at high levels. This puts continued pressure on the valuations of long-duration and high-beta assets, including BTC, making mid-term optimism difficult.
Cryptocurrency Market Liquidity: A Brief and Fragile Balance
Further observation of cryptocurrency market liquidity shows that capital inflows occurred in the first half of the month, while outflows occurred in the second half. The main decisive factors were the Federal Reserve's interest rate cut in the first half of the month and Japan's interest rate hike in the second half. Stablecoins and BTC ETF channel funds generally moved in sync. 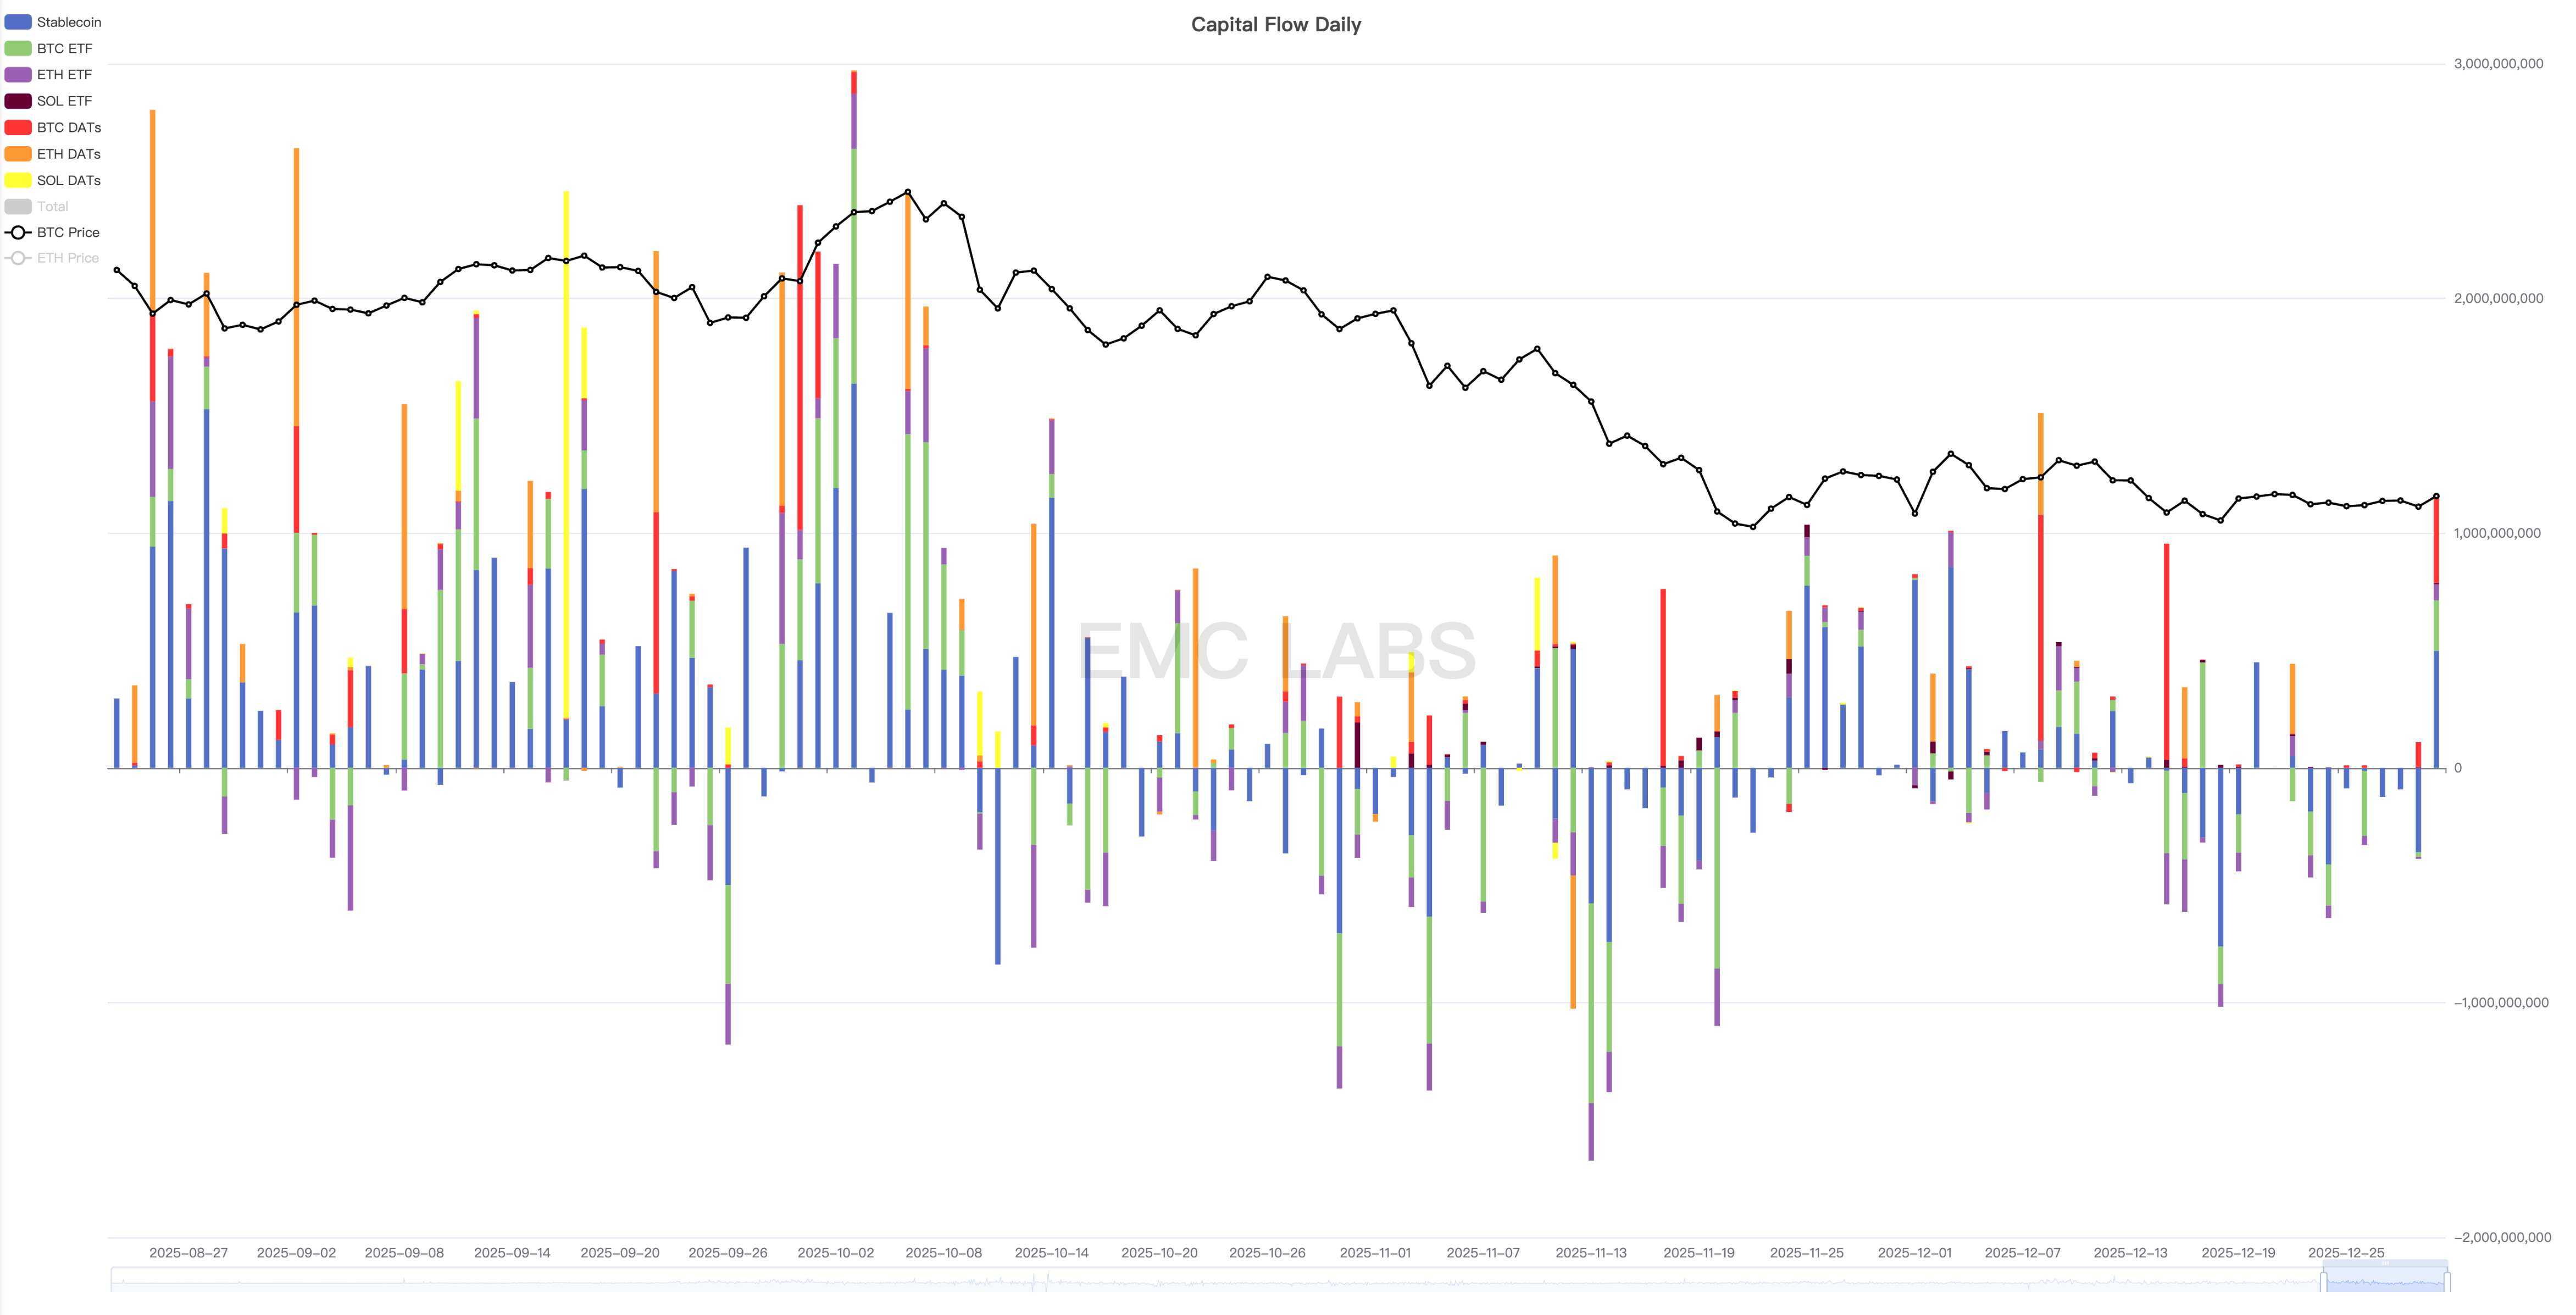
Cryptocurrency Market Capital Inflow and Outflow Statistics (Daily)
According to the 7-day average of sell-offs we track, the peak of sell-offs this month occurred on December 15, between the Federal Reserve's interest rate cut (December 10) and Japan's interest rate cut (December 19). The highest price this month, 94,640, occurred on October 9, the night before the Federal Reserve's interest rate cut.
The market crash in November was caused by liquidity tightening, but the amplitude was exacerbated by historical cyclical sell-offs. Currently, the BTC price has broken through technical support, leading to strong sell-offs on any rebound. This indicates that the market is still in a clearing process.
This month's total sell-off volume reached 718,000 coins, lower than the previous two months but still at a high level. On the optimistic side, the selling pressure has generally been absorbed by the market, with an overall outflow of about 30,000 coins from exchanges this month, marking four consecutive months of outflows from exchanges. 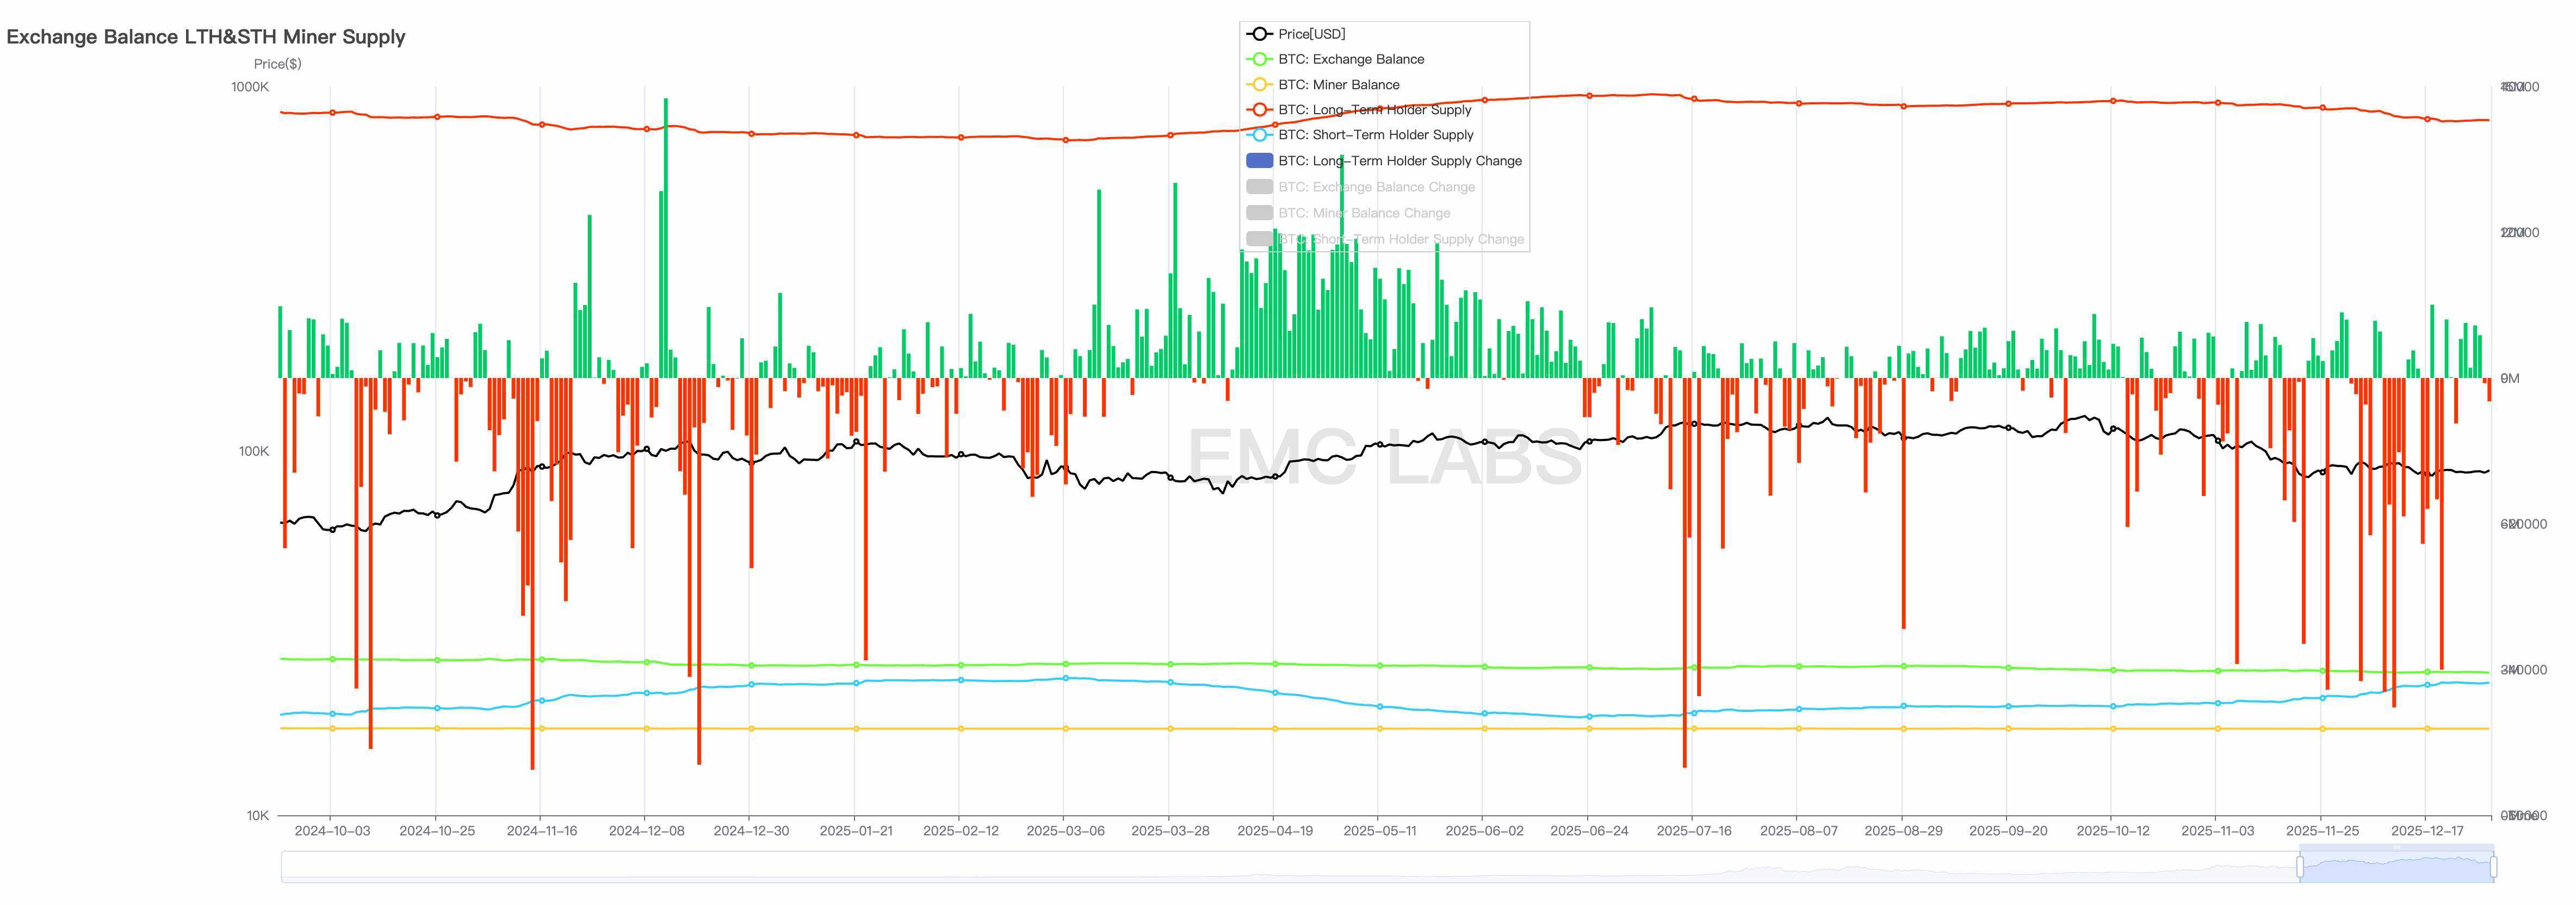
BTC Long Position Holdings and Changes Statistics (Daily)
Long positions, BTC ETFs, and retail users in the U.S. market remain the main selling groups. Coinbase's quotes continue to be lower than Binance's.
Specifically regarding the internal sell-off, the sharp decline over the past two months has led to a reversal between profit-taking and loss-selling. On October 10, the profit-loss sell-off ratio was 21.82, but by the 29th, this value had dropped to 0.81, indicating that the sell-off has shifted from overall profit-taking to overall loss-selling. 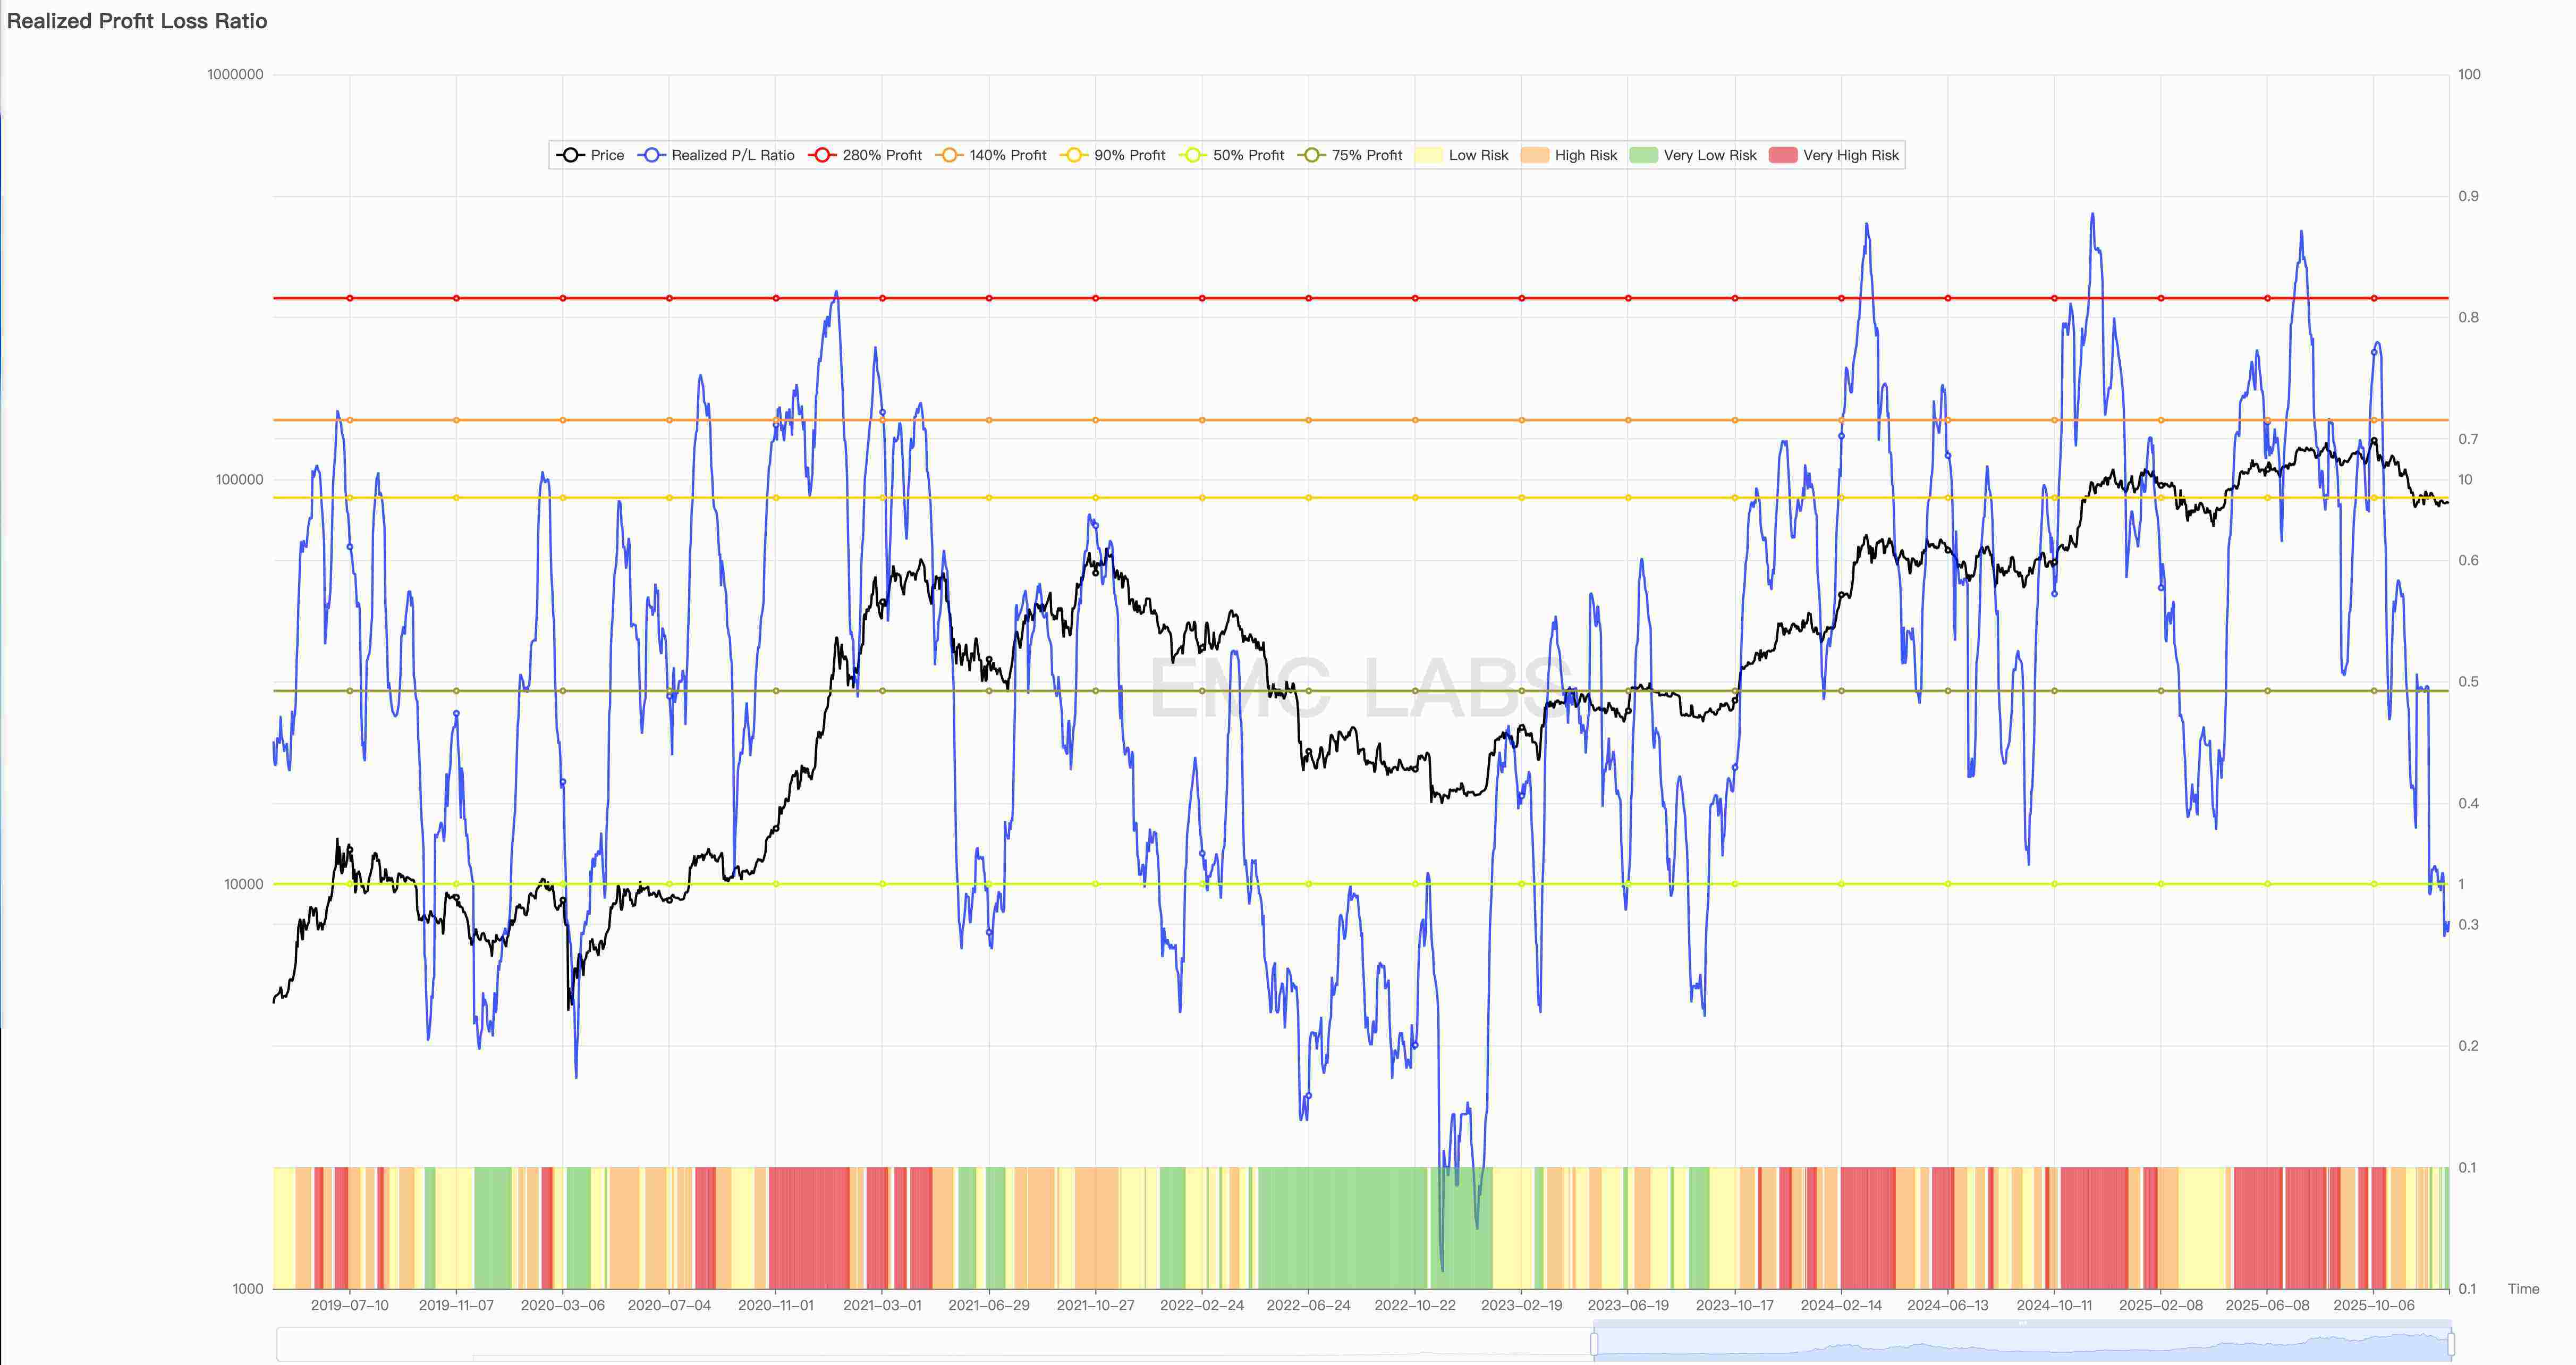
Realized Profit and Loss Ratio
By the end of the month, long position selling began to decrease or even turn into accumulation, with more sell-offs driven by short positions corresponding to significant losses.
The overall chain loss situation has also broken through thresholds, with the on-chain market value experiencing its first outflow since 2023. The 30-day realized market value change on-chain has turned into an outflow, and the cumulative realized market value has shown signs of turning, indicating that the net loss accumulated on-chain since December corresponds to the stop-loss selling on exchanges. Notably, this is the first time since this bull market that a decline in realized market value on-chain has occurred. 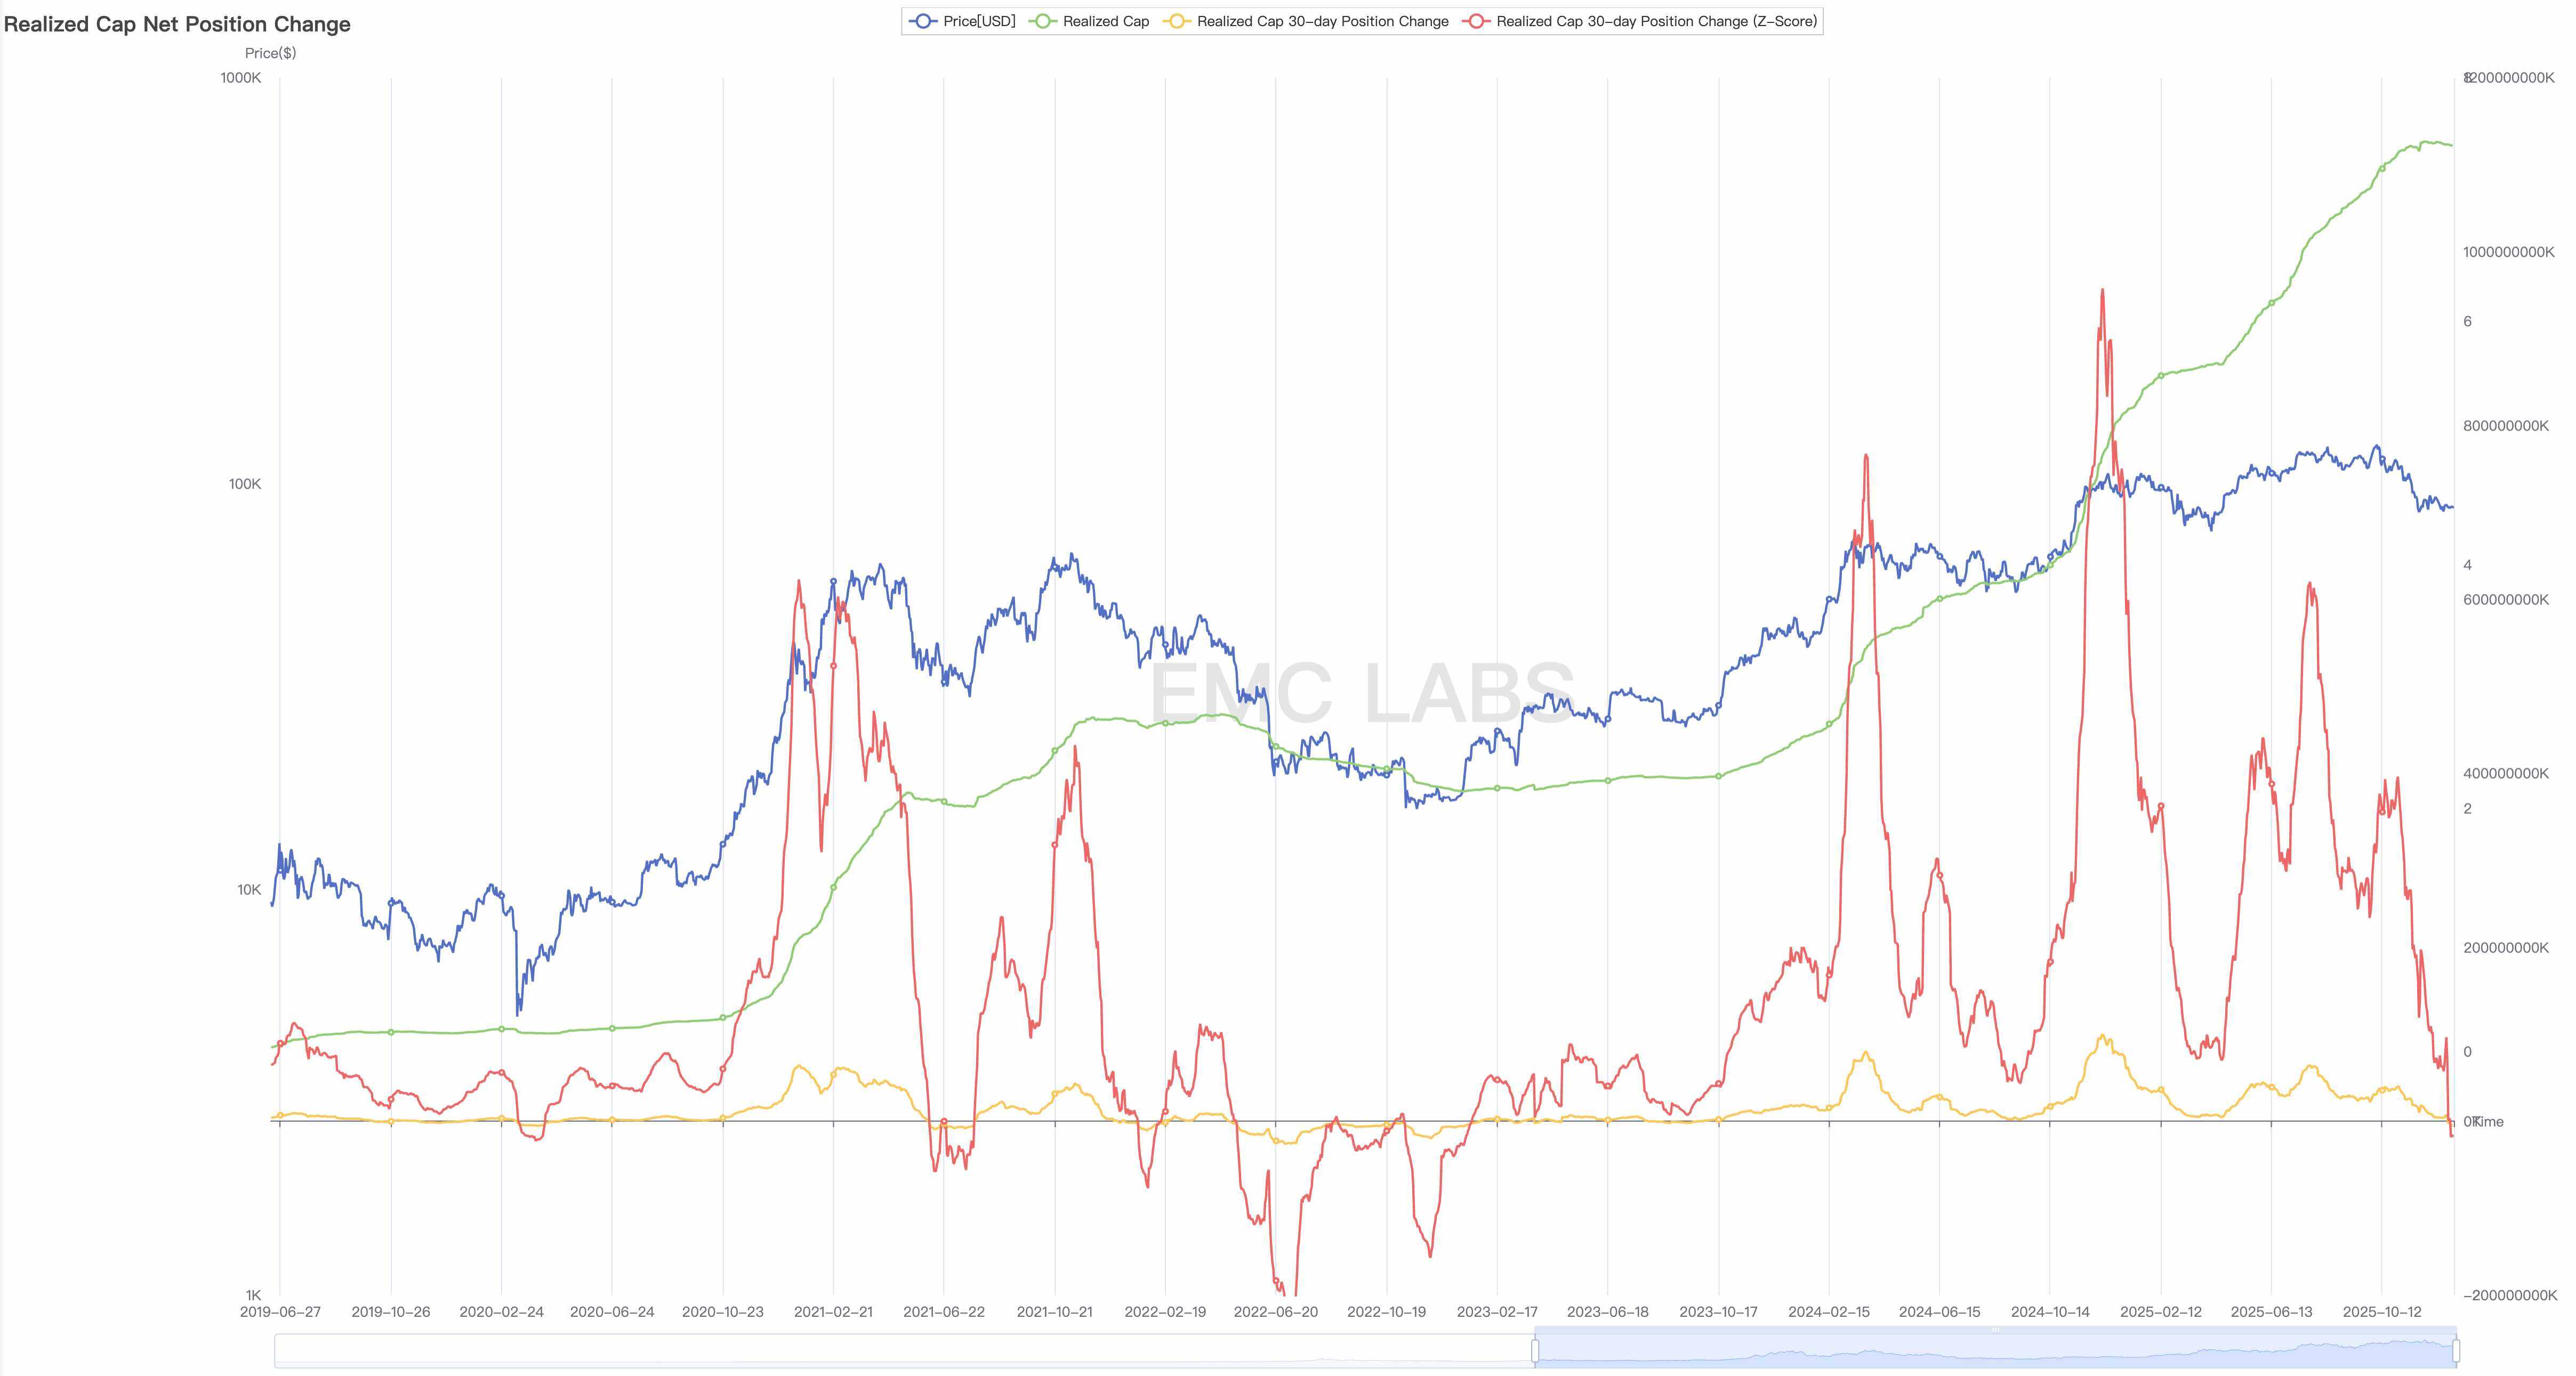
Net Change in Realized Market Value (30 Days)
In past cycles, a continuous decline in realized market value on-chain often indicates a prolonged price drop in a cycle-level "deep bear market." Such a drop will not only further undermine investor confidence but, if it triggers a collapse of market fragility leading to a chain reaction, it could result in a deep bear market, as seen in the previous two cycle-level deep bear markets.
"Cold Bear": Could It Become a New Form of the "New Cycle"?
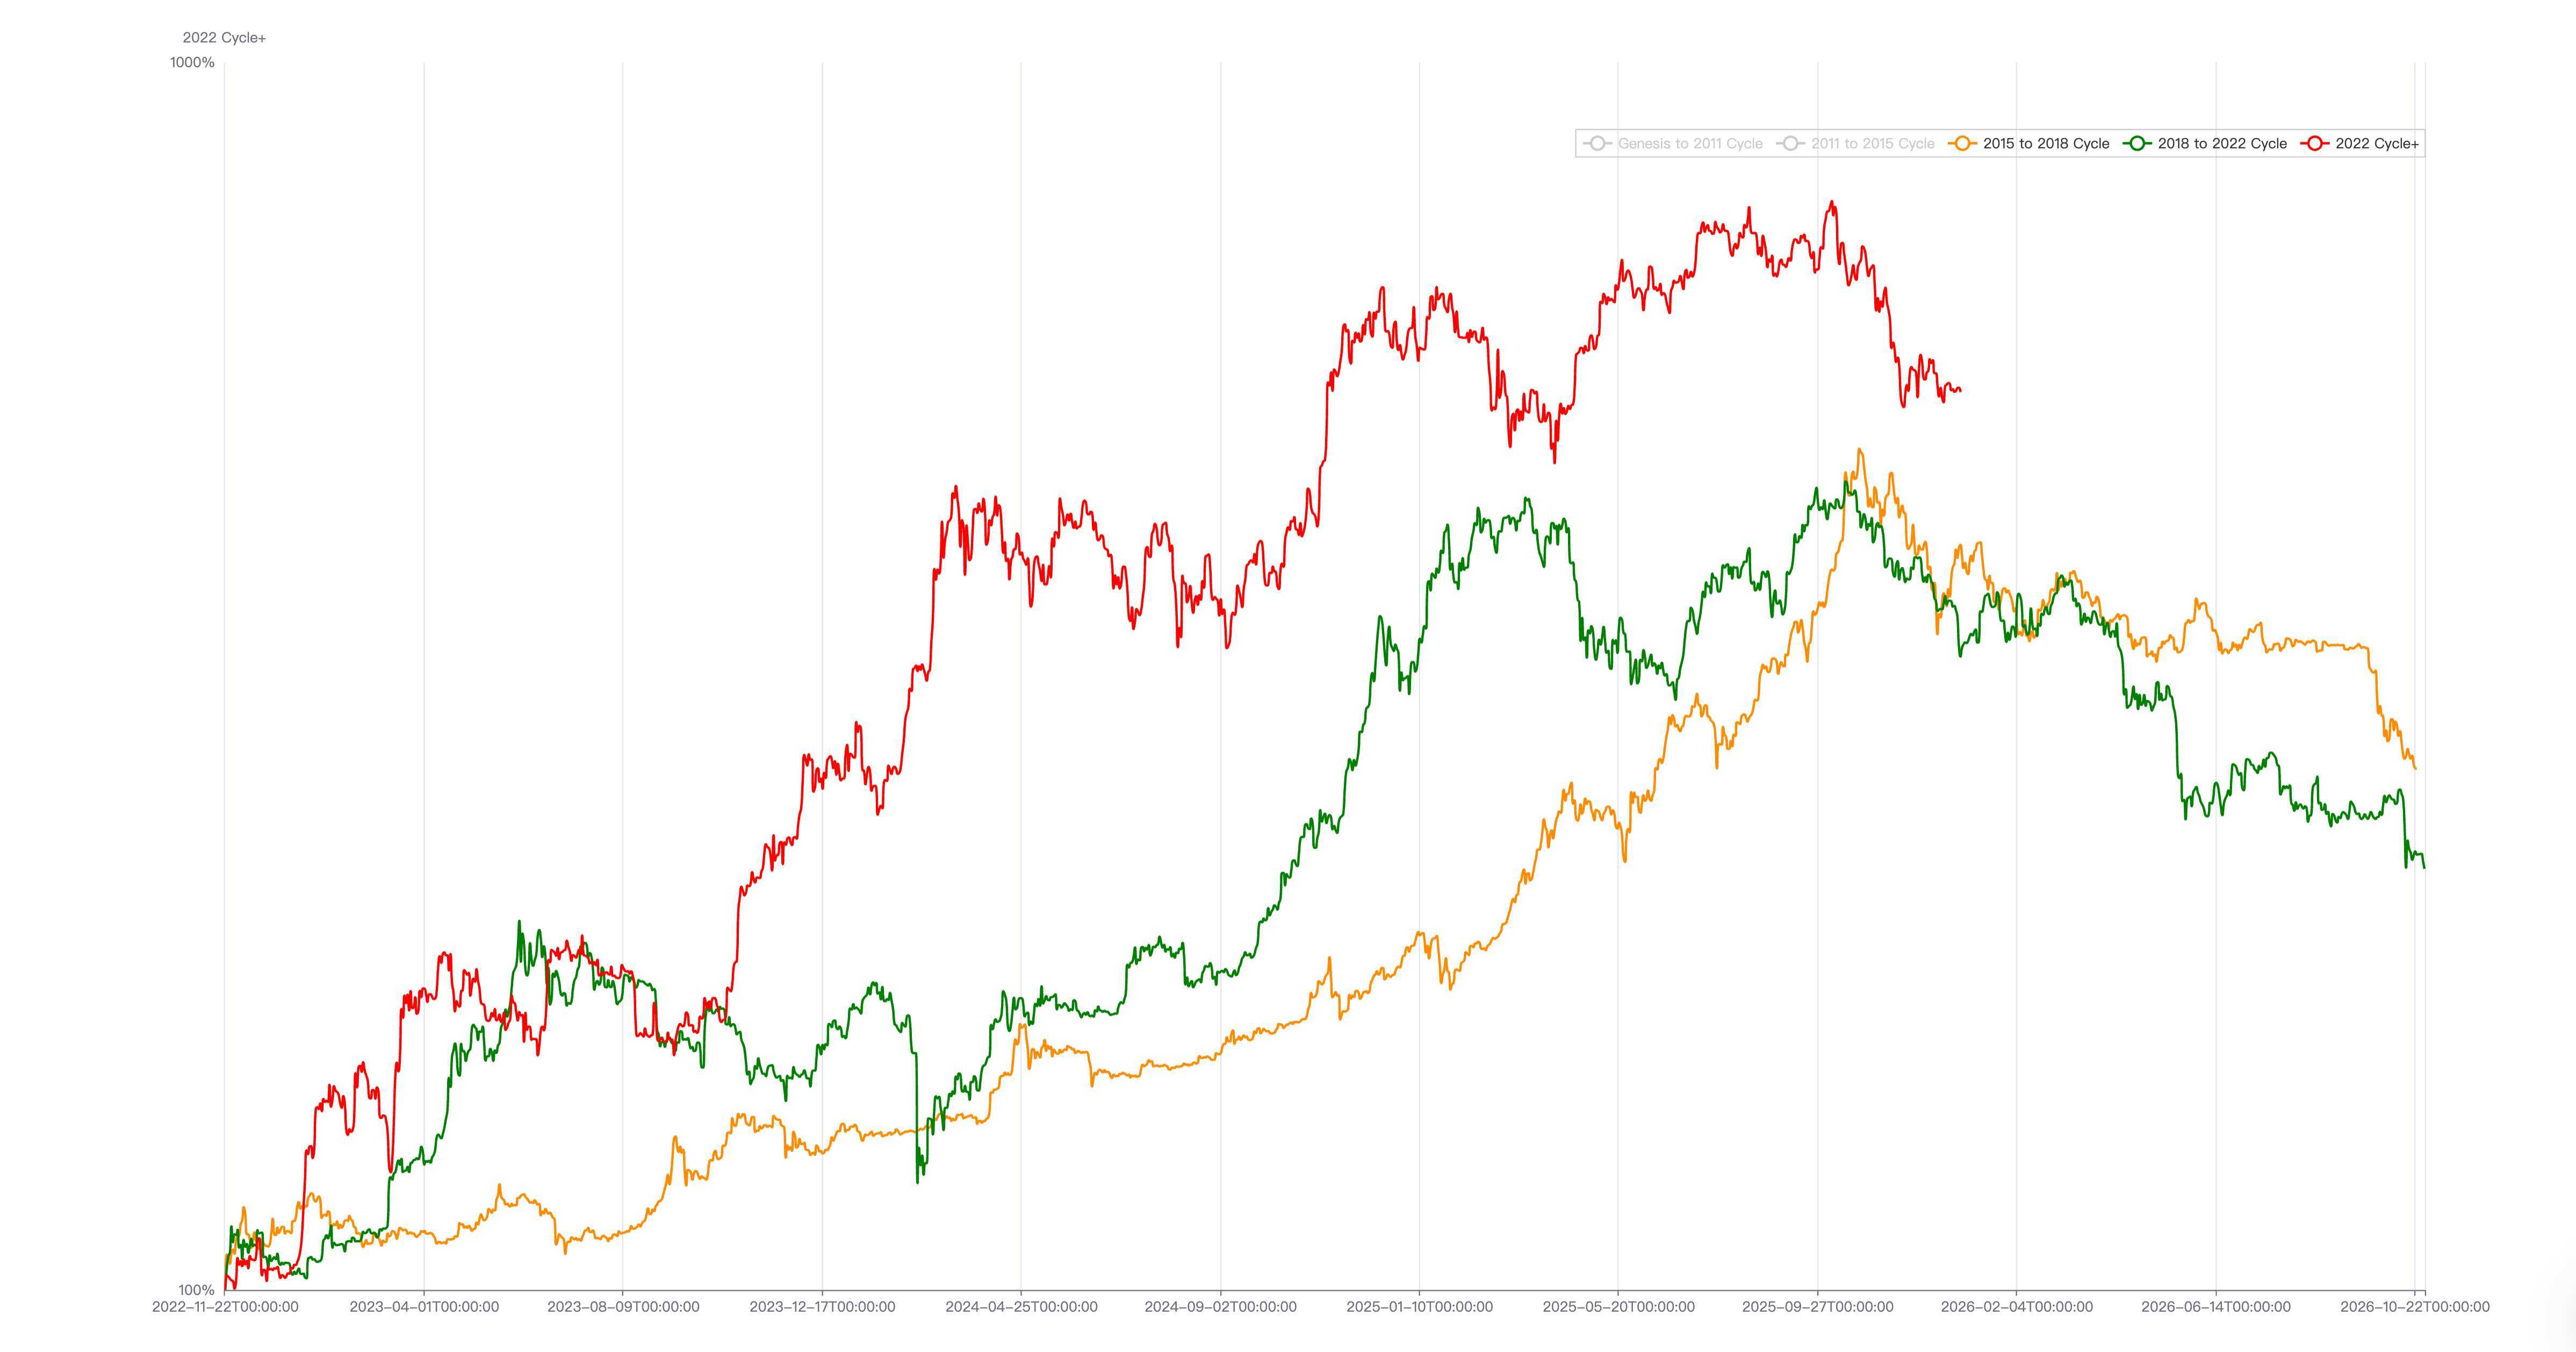
2015~2018 Cycle vs 2018~2022 Cycle vs 2022~ Cycle
The deep bear markets following the "halving bull markets" in 2018 and 2022 (lasting 12 months with declines exceeding 70%) were essentially driven by a dual push of "macro financial tightening" and "industrial bubble clearing."
During the 2018 bear market, macro financial tightening included the Federal Reserve's balance sheet reduction starting in October 2017, totaling $700.48 billion, and five interest rate hikes totaling 100 basis points in 2018; the macro financial tightening in 2022 included a total balance sheet reduction of $363.9 billion by the Federal Reserve (ending in 2025, totaling $2.2 trillion) and seven interest rate hikes totaling 425 basis points.
In the "EMC Labs BTC Cycle Multi-Factor Assessment Model," macro finance and internal market movements are the underlying logic. From the historical process of new asset formation and diffusion, BTC is currently undergoing a significant turnover triggered by consensus diffusion (from early holders to mature holders). Once this process is completed, BTC will become a mainstream asset, with pricing power taken over by Wall Street capital.
Based on this definition and framework, we make a judgment on the current market situation—
Macro Liquidity. BTC is primarily an early expression of global macro liquidity. The essence of the past two cycles of deep bear markets is that high-beta assets undergo price rebalancing through turnover caused by the Federal Reserve's balance sheet reduction and interest rate hikes. Currently, the Federal Reserve has just stopped its balance sheet reduction in December 2025 and is still in a rate-cutting cycle, which does not yet constitute conditions for long-term macro financial tightening.
Internal market movements include the turnover between long and short positions, excessive supply of tokens, consensus crises (such as the BCH hard fork), and the clearing of leverage and vulnerabilities. Among these, the most important aspect of the exchange of long and short positions is that long positions utilize consensus diffusion, ETF, and DAT funds to distribute during the entry phase. Since 2023, there have been three waves of this, corresponding to the approval of BTC ETFs, the "crypto-friendly" speculative frenzy driven by Trump's campaign, and the top-selling driven by historical cyclical laws. 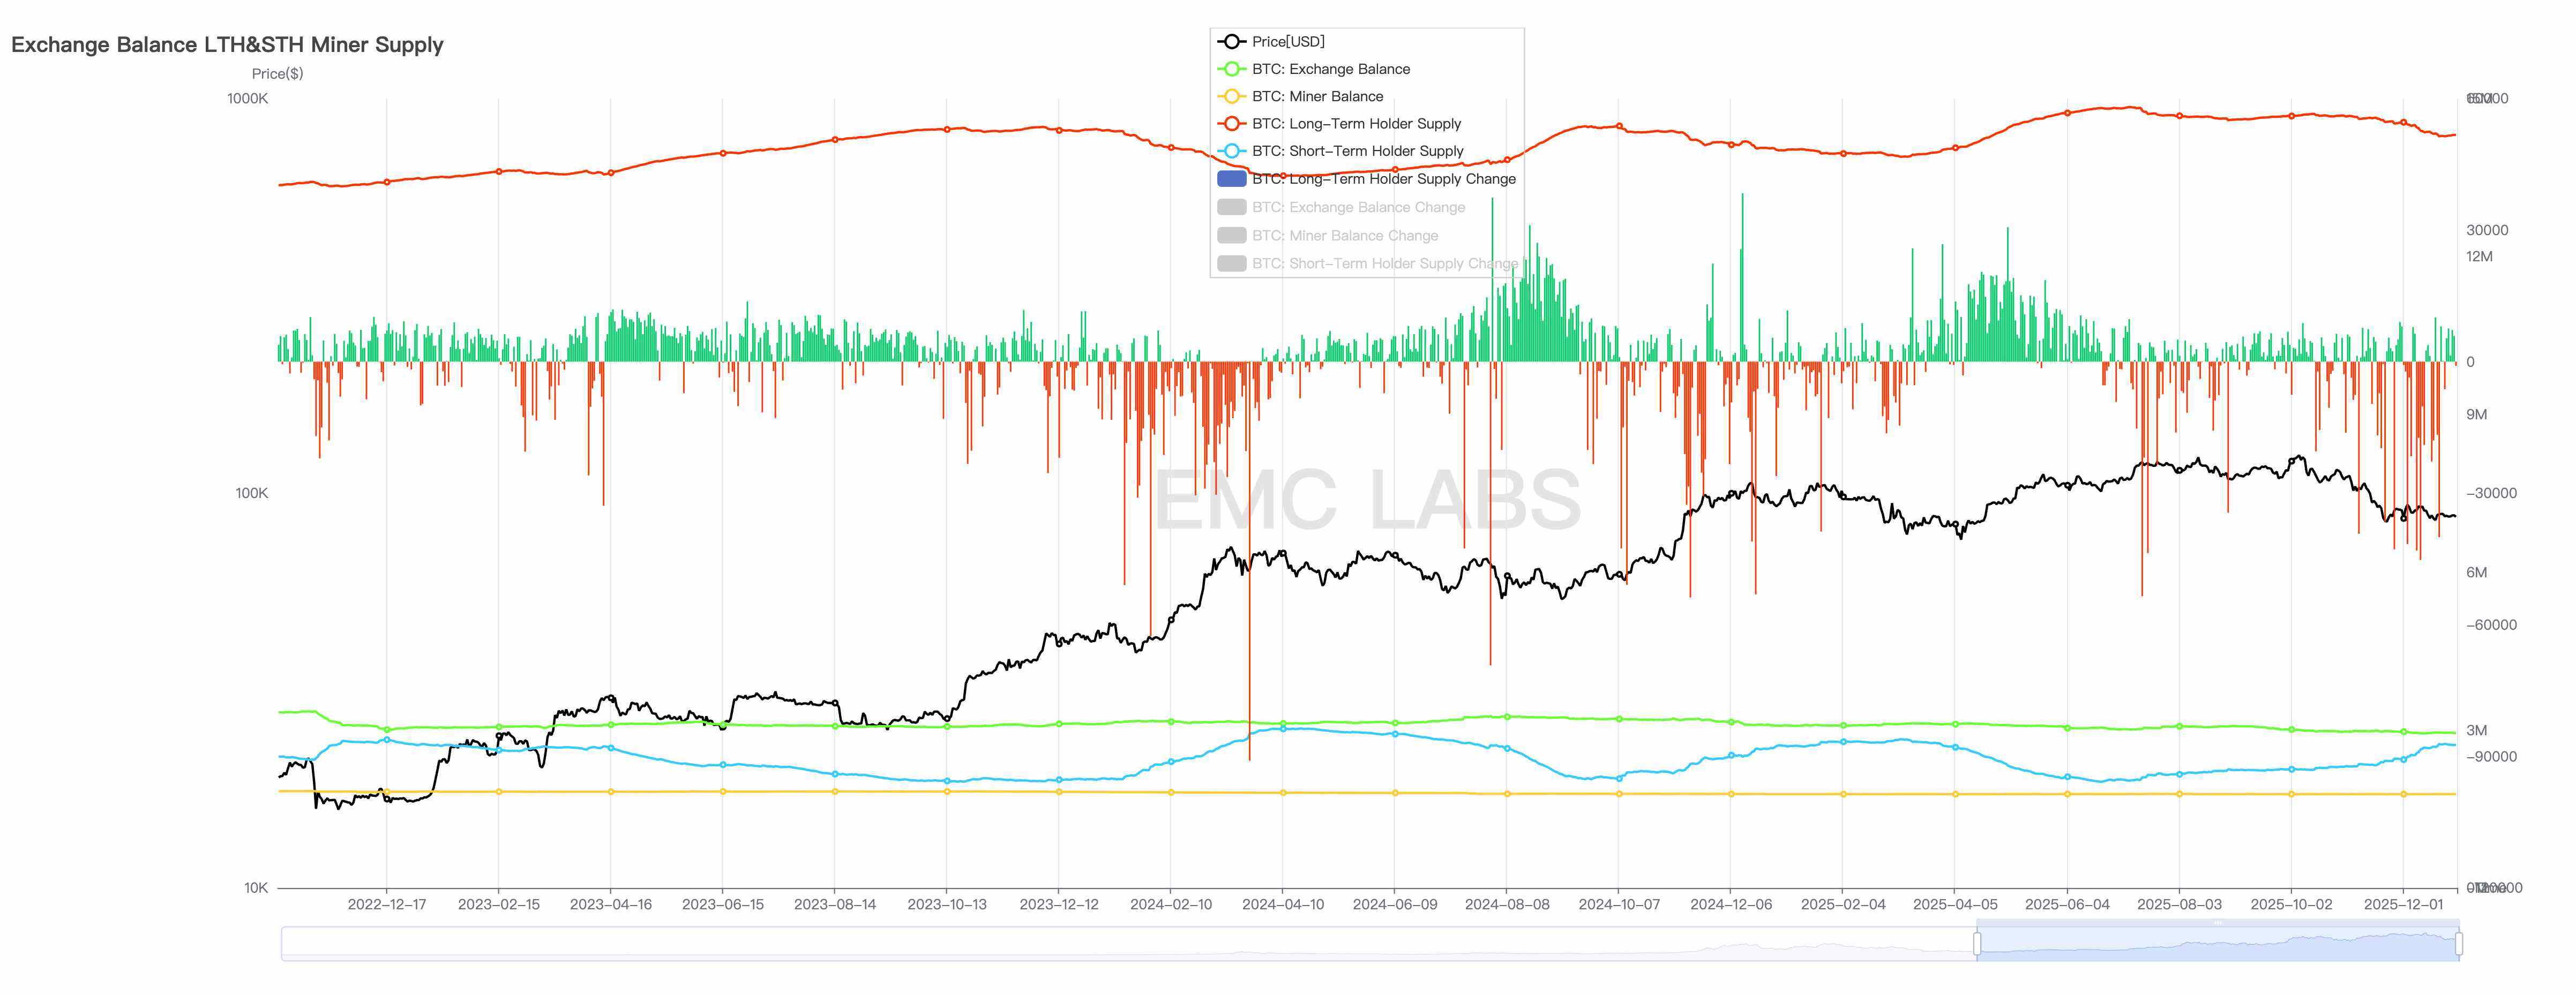
BTC Long Position Accumulation and Distribution Statistics
Each wave of long position distribution, due to its massive scale (hundreds of thousands of coins), will quickly drain the newly incoming liquidity, causing temporary weakness in BTC prices. The first two distributions in this cycle caused declines of 33% and 30%, with consolidation periods lasting 6 to 10 months. The third distribution, which is currently ongoing, has not only seen long positions exiting at the top of the cycle but has also been compounded by the tightening of short-term liquidity due to the end of the Federal Reserve's balance sheet reduction and government shutdown, leading to a maximum decline of 36%, greater than the previous two. 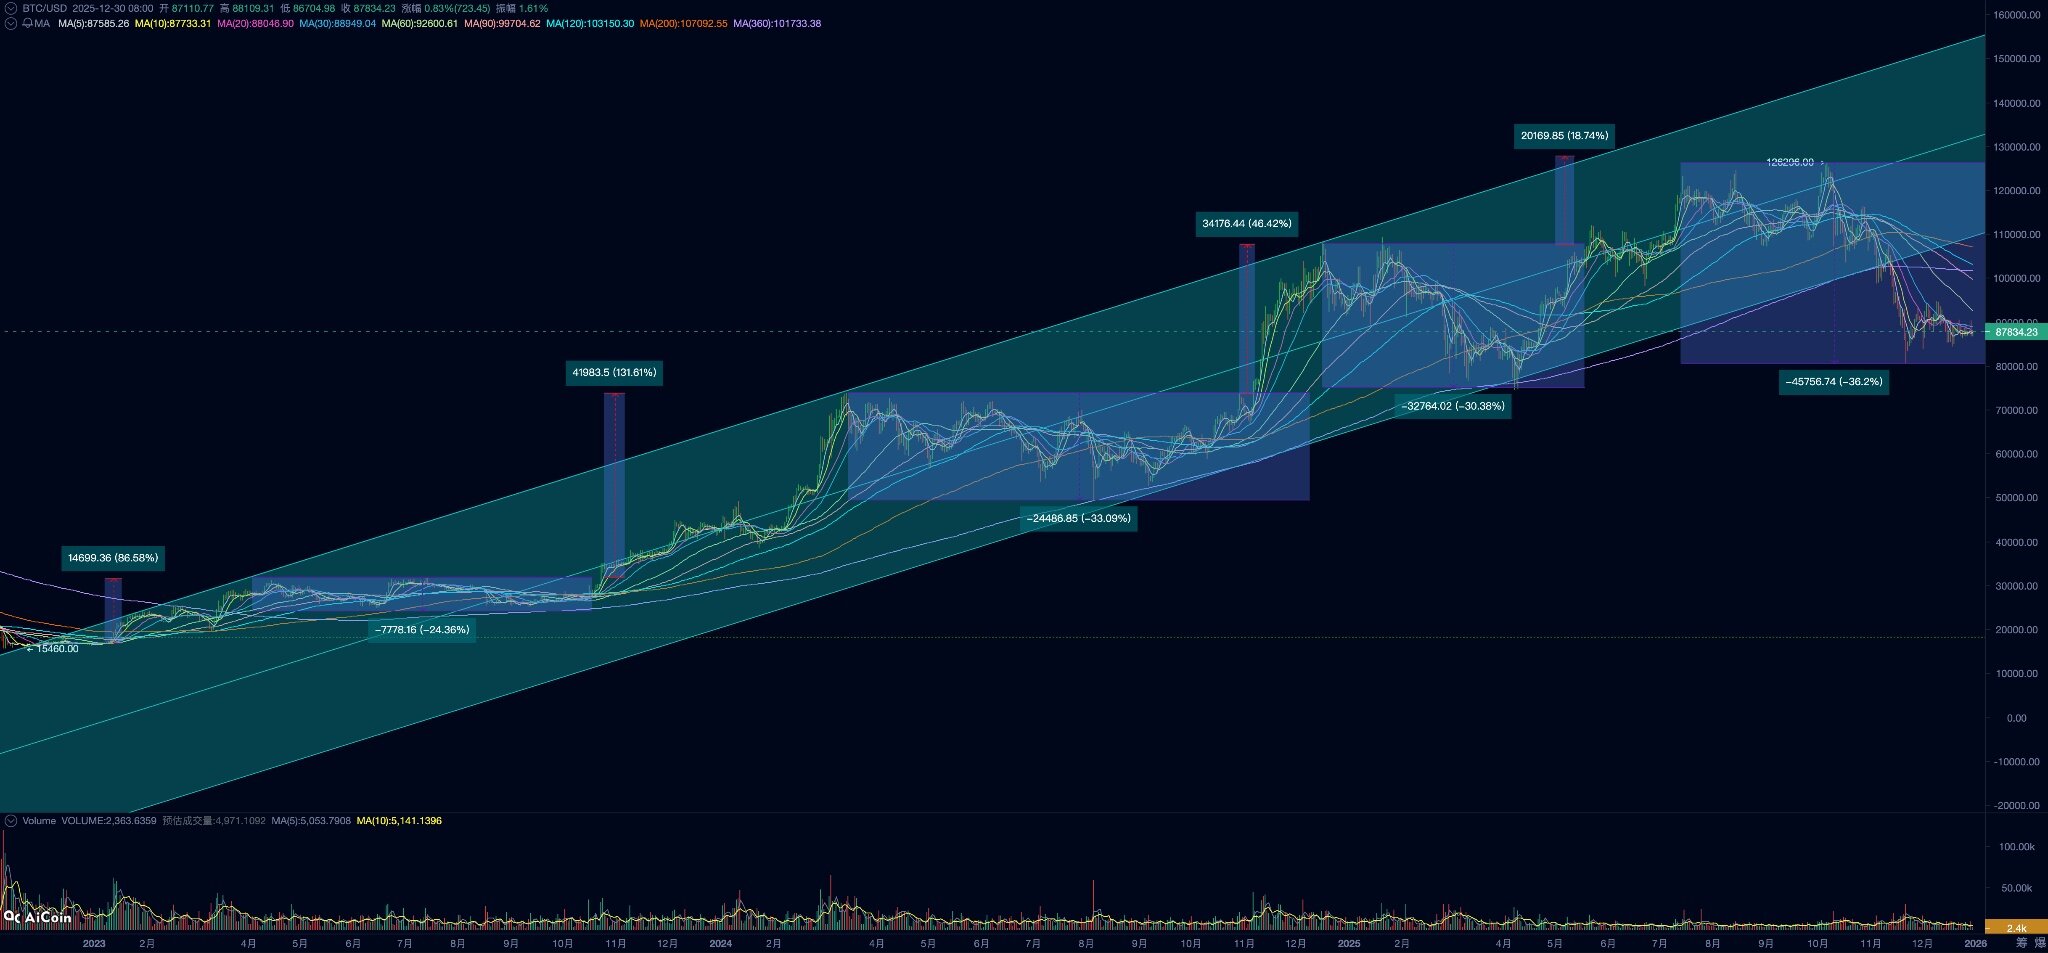
BTC Long Position Sell-offs and Corresponding Three Declines in This Bull Market
How should we view this decline of over 30% lasting more than 6 months?
Within the framework of the four-year halving bull market cycle, we regard this as a "mid-term adjustment" in the bull market process, while the phase following the halving bull market, which lasts 12 months with a decline exceeding 70%, is referred to as a "deep bear market."
This is the previous definition and the connotation of the cyclical "thought stamp."
If we consider the mainstreaming of BTC, the significant turnover of tokens, and the gradual acquisition of pricing power by Wall Street as a "new cycle," we can analyze the market using a new concept called "Cold Bear" (a bear market triggered by a cooling of phase emotions) beyond the perspective of a "deep bear market."
In the process of mainstream asset allocation, BTC will gradually follow U.S. stocks into a long-term bull market. The traditional capital allocation (DATs, ETFs, and family office OTCs) triggered by consensus diffusion will lead to impulse-driven increases, while the continuous selling by traditional long positions will create a 6 to 10-month decline, which can be seen as a "new cycle" form during the historical turnover phase driven by consensus diffusion. The "new cycle" includes the influx of consensus diffusion allocation funds leading to buying power greater than selling power, forming an "upward phase," and the temporary cooling of funds leading to selling power greater than buying power, forcing price corrections, forming a "downward phase."
Using this new hypothetical framework, since the BTC ETF market began in the second half of 2023, BTC has already experienced three "new cycles," consisting of three complete combinations of rises and falls.
To determine whether the market is in a "new cycle" or an "old cycle," we use long position behavior as a leading indicator.
If it is an "old cycle," then long positions will continue to distribute tokens over monthly timeframes, leading to the accumulation of tokens on exchanges, pushing prices down continuously, triggering internal market vulnerabilities to collapse, and repeatedly compressing the bottom platform. Multiple significant declines will complete the large turnover of tokens, reaching the bear market bottom, lasting up to 12 months, with declines exceeding 70%. This is the movement process of a "deep bear market."
Currently, the continuous reduction of long positions aligns with this process characteristic, including the ongoing outflow of BTC ETFs, but the selling pressure has been fully absorbed, and the stock of BTC on exchanges continues to decline, which contradicts the "old cycle." Furthermore, if it is a "deep bear market," in addition to continuous selling by long positions, internal vulnerabilities must also trigger a collapse.
If it is a "new cycle," then after a phase of reduction in long positions and ETF channel funds, accumulation will return, slowing down selling pressure or even absorbing it, establishing a phase of rebalancing. If long positions accumulate again, combined with the inflow of ETF channel funds, buying power will exceed selling power, and prices can rise again or even reach new highs. 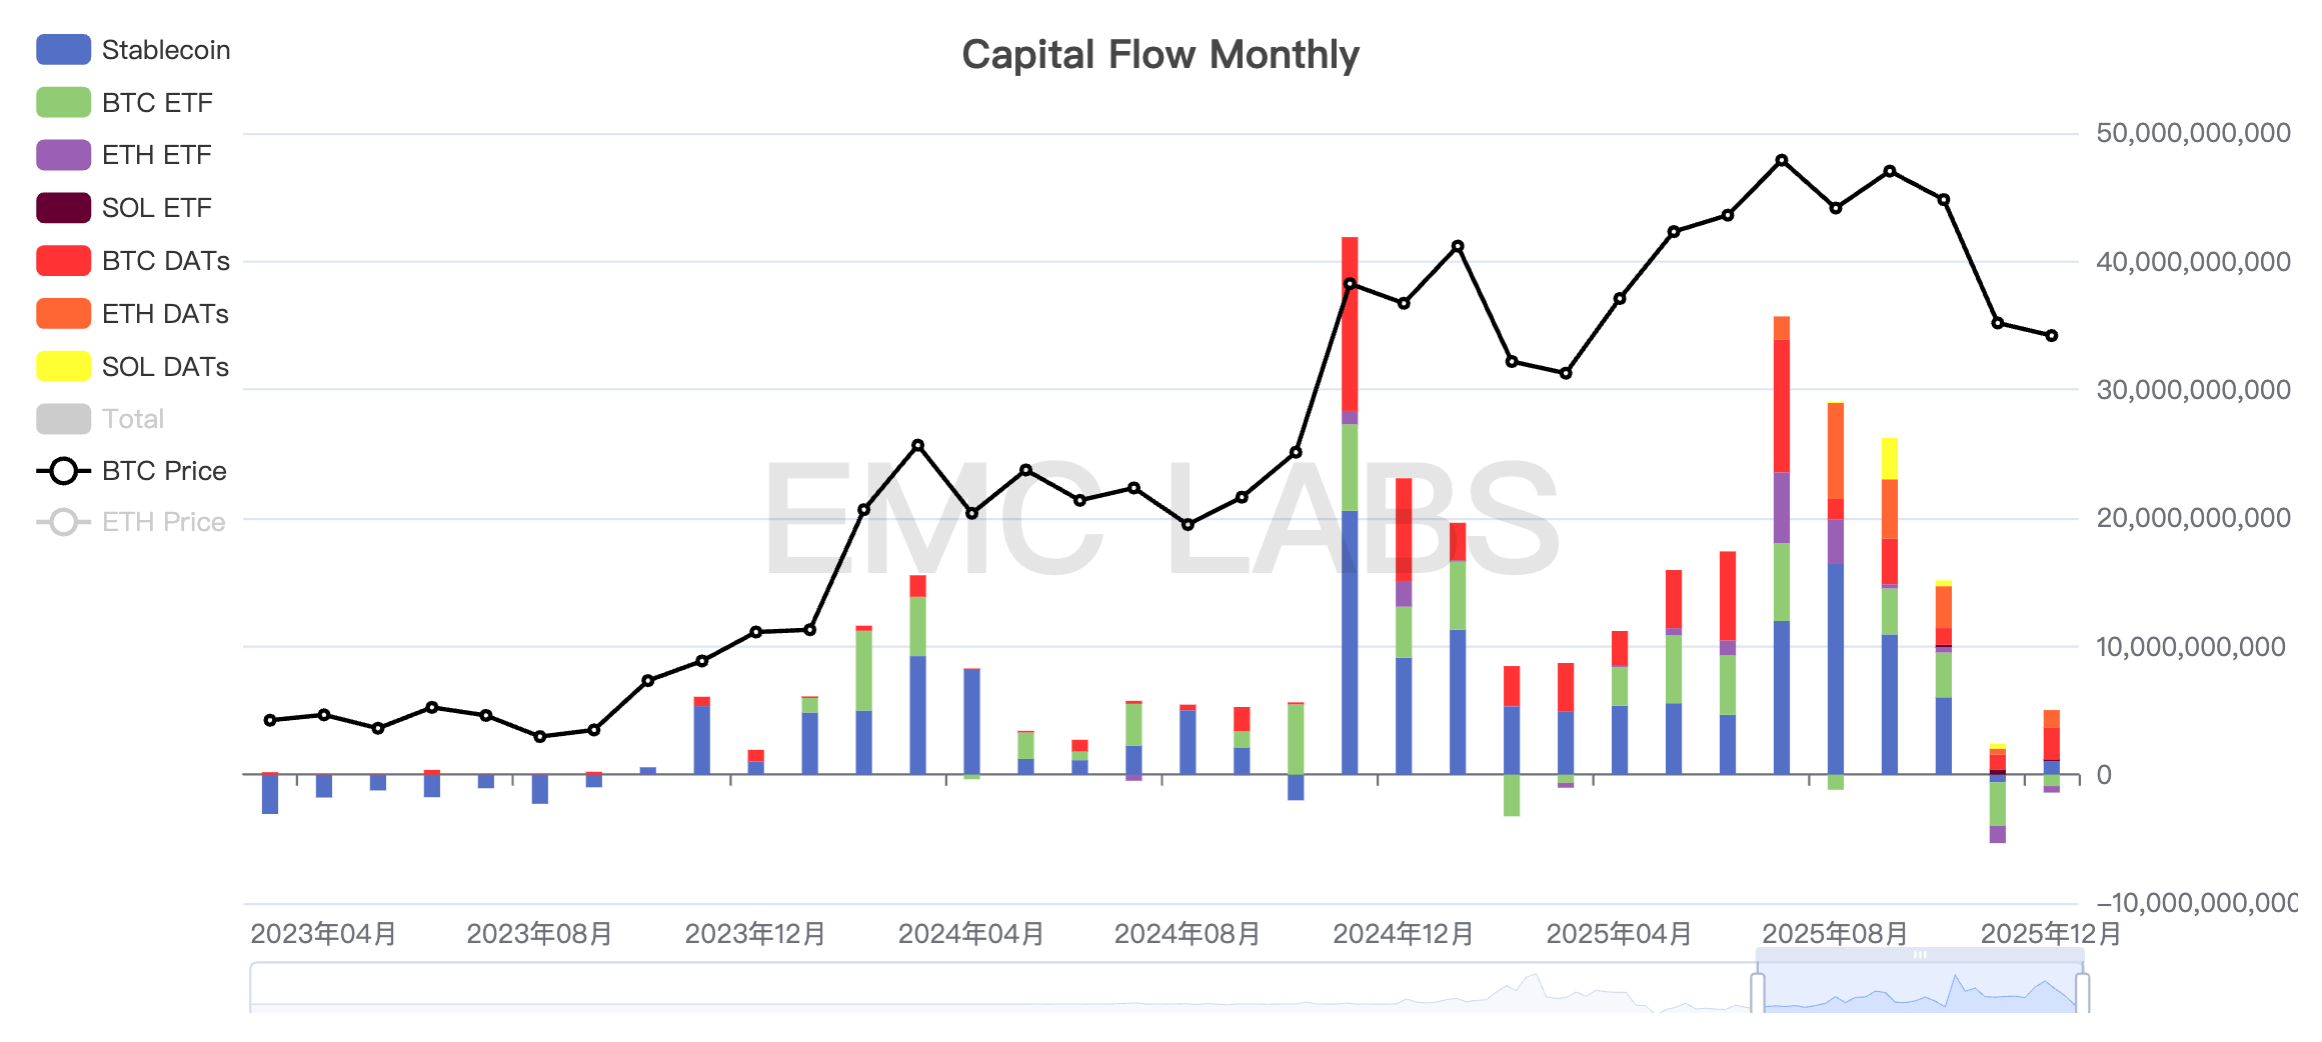
Monthly Statistics of Capital Inflows and Outflows in the Cryptocurrency Market
Following significant outflows in November, December's cryptocurrency market capital statistics have recorded net inflows across all channels, which is the fundamental reason for price stabilization in the $80,000 to $94,000 range. Of course, even in a traditional "deep bear market," capital inflows and outflows will also fluctuate, requiring continuous monthly observation.
Additionally, the establishment of a "deep bear market" requires a thorough clearing of internal market vulnerabilities. For example, the bankruptcies of ICO projects during the 2018 "deep bear market," the BCH fork, the bankruptcies of DeFi projects (UST/Luna) during the 2021 deep bear market, the bankruptcies of investment firms (Three Arrows), centralized lending (Celsius Network, Voyager Digital, BlockFi), and the moral crisis of exchanges (FTX).
The potential vulnerabilities in this market are mainly concentrated among BTC ETF investors, contract traders, DAT companies, RWA stablecoins, and centralized exchanges. Currently, the nominal value of hundreds of billions in contract leverage has been cleared, and the de-pegging of Binance USDe has caused significant losses for market makers. A small number of DAT companies have shown signs of selling coins, but leading firms like Strategy and Bitmine have performed relatively steadily.
Vulnerabilities may not necessarily be cleared, but as the market continues to decline, the probability of vulnerabilities being cleared will increase. If effective barriers cannot be established in between, it could lead to a clearing at the industry level, resulting in a deep bear market.
Conclusion
In 2025, the consensus on crypto assets continues to spread, with Bitcoin included in the strategic reserves of the U.S. and multiple states, and BTC ETFs recording net inflows of hundreds of billions of dollars. However, due to the turbulence of macro liquidity and the cyclical reduction of long positions, this tumultuous year ultimately ends with a decline in annual prices.
The historical process from new asset to mature asset has already begun, and BTC is in the process of significant turnover.
If the market trend that began in 2023 continues to follow the "old cycle," then 2026 will be a year of major clearing. If the "new cycle" has already begun, then 2026 may again exhibit the "upward-adjustment-upward" pattern seen in the markets of 2024 and 2025.
Let us wait and see.
About Us
EMC Labs was founded in April 2023 by cryptocurrency asset investors and data scientists. We focus on blockchain industry research and secondary market investment in crypto, with industry foresight, insights, and data mining as our core competencies. We are committed to participating in the thriving blockchain industry through research and investment, promoting the benefits of blockchain and crypto assets for humanity.
For more information, please visit: https://www.emc.fund
免责声明:本文章仅代表作者个人观点,不代表本平台的立场和观点。本文章仅供信息分享,不构成对任何人的任何投资建议。用户与作者之间的任何争议,与本平台无关。如网页中刊载的文章或图片涉及侵权,请提供相关的权利证明和身份证明发送邮件到support@aicoin.com,本平台相关工作人员将会进行核查。


