Qinglan Crypto Class is now in session! BTC's four cycles + dual perspectives on news, guiding you to step in sync with the crypto market rhythm
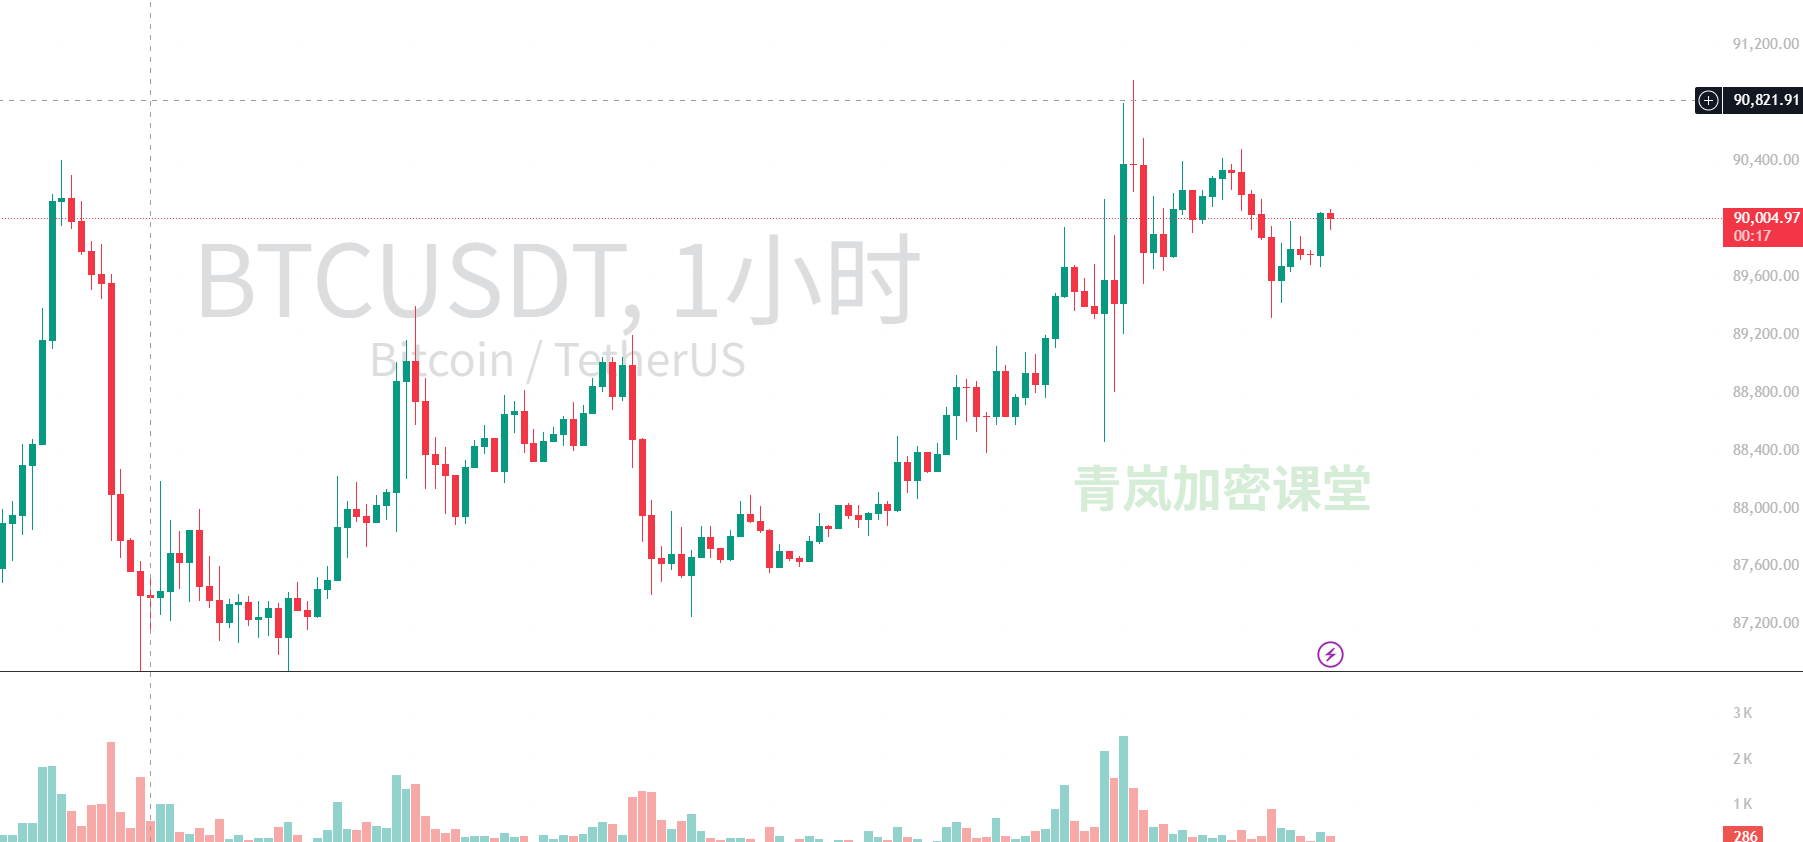
K-line pattern analysis (hourly chart):
Overall trend: From around 87960 at 10:00 on January 1 to the high of 90961 in the early morning of January 3, BTC has experienced a significant upward trend, establishing a medium to short-term bullish trend.
Recent performance: After reaching the high of 90961 (01:00 on January 3), the price began to slightly retrace and entered a consolidation phase. The subsequent K-lines mostly have small bodies and relatively long shadows, indicating a tug-of-war between bulls and bears in this area, with the market in a wait-and-see mode, digesting the previous gains.
Current K-line (2026/1/3 21:00): The closing price is 90037.92, nearly equal to the opening price of 90039.12, forming a very small body K-line, with balanced upper and lower shadows, showing high market hesitation and lack of clear direction.
Technical indicator analysis:
Moving Average System (MA):
The latest MA5 (89875.25) and MA10 (89869.6) are nearly fused, and the current price of 90037.92 is above them, but very close to MA20 (89973.14).
The MA5, MA10, and MA20 moving averages are overall in a bullish arrangement, but the fusion of MA5 and MA10 in the short term and their proximity to MA20 suggest a weakening of short-term upward momentum, entering a sideways consolidation.
Nevertheless, all short-term moving averages are still well above the levels of January 1, supporting the medium to short-term bullish structure.
MACD:
DIF (139.3585) has crossed below DEA (200.4268), forming a death cross, and the MACD histogram (BAR: -122.1366) is negative and expanding. This indicates that short-term retracement momentum is strengthening, possibly signaling further adjustments or deeper consolidation.
However, the absolute values of DIF and DEA are still positive, indicating that from a medium to long-term perspective, the bullish trend's foundation has not been completely shaken, and the current death cross may just be a short-term adjustment signal.
RSI (14):
- The RSI14 value is 57.18, in the neutral zone. It reached an overbought area of 74.18 at 00:00 on January 3, then retreated, indicating that the market has cooled from an overheated state, leaving room for subsequent movements. Currently, RSI does not provide clear overbought or oversold signals, consistent with the characteristics of a sideways consolidation.
Volume:
- When reaching peaks at 00:00 and 01:00 on January 3, the volume significantly increased (2486.21 and 1336.49). It then entered a retracement and consolidation phase, with volume noticeably shrinking (latest 256.59). In terms of volume-price coordination, a decrease in volume during the retracement process is generally considered healthy, indicating that selling pressure is not heavy, and bulls are expected to regain strength after consolidation.
【Sentiment and Capital Analysis】
Fear and Greed Index (FGI):
The current FGI is 29 (Fear), a recovery from 20 (Extreme Fear) on January 1, but still in the fear range.
Impact: The rise of FGI from extreme fear to fear indicates that market sentiment is gradually improving, but has not yet reached the greed stage, meaning the overall market remains cautious. This is somewhat healthy, as excessive greed often signals a top, while the current cautious sentiment provides "emotional space" for potential further increases.
Is there a divergence: BTC's price has seen a significant increase over the past two days, while FGI remains in the "fear" range and has not synchronized into "neutral" or "greed." This is a potential "optimistic divergence"—prices are rising, but market sentiment has not fully caught up. From a quantitative trading perspective, this divergence can be interpreted as the market having doubts about the current upward trend, or that funds have not fully flowed in, leaving room for subsequent increases.
BTC Dominance:
The current BTC Dominance is 56.94%.
Impact: A relatively high BTC dominance usually means that market funds are leaning towards Bitcoin, viewing it as a safe-haven or dominant asset. When the overall crypto market is warming up, high BTC dominance may indicate a "Bitcoin siphoning" trend, where funds flow into Bitcoin, putting pressure on altcoins.
Combined with reference information: Although James Wynn's heavy investment in PEPE shows a profit of 210,000, indicating some investors are aggressively operating in altcoins, the BTC dominance data still shows Bitcoin's dominance. This may mean that after mainstream coins stabilize, funds may start looking for high-risk, high-reward altcoin opportunities as risk appetite increases.
Total Market Cap and BTC Market Cap:
Both BTC market cap and total market cap have seen slight increases within 24 hours (BTC +0.56%, Total +1.32%), indicating an overall growth trend in the crypto market.
Combined with reference information: The viewpoint proposed by Yi Lihua that "the 2024 bull market has been set" combined with the record high ETF scale (despite IBIT's negative return last year) and Bitcoin's core position in the crypto market together form a macro narrative supporting long-term market improvement. The information about IBIT's negative return last year reminds us that while focusing on short-term technical highs, we must also be wary of institutional funds' long-term investment performance in BTC, which may affect subsequent large-scale capital inflows and lead to deeper adjustments after short-term highs.
【Comprehensive Conclusion】
Short-term trend direction: Currently, BTCUSDT is in a sideways consolidation phase. After experiencing a strong upward trend, bullish momentum has temporarily weakened, but the overall medium to short-term bullish structure has not been broken. The price is consolidating below key resistance levels, accompanied by reduced trading volume, indicating that selling pressure is not strong, possibly preparing for the next round of increases.
Key support and resistance levels:
Immediate resistance level (R1): 90200 - 90300 USDT (short-term high and psychological level).
Key resistance level (R2): 90500 - 90600 USDT (the second high point before recent retracement).
Major resistance level (R3): 90961 USDT (the short-term high of this round of increase). Breaking this level will open up further upward space.
Immediate support level (S1): 89700 - 89800 USDT (latest K-line low and near MA5/MA10, strong short-term support).
Key support level (S2): 89400 USDT (low point at 23:00 on January 2, effective rebound level).
Major support level (S3): 88800 - 89000 USDT (previous resistance turned support, also an important reference after MA20 moves up).
Possible reversal patterns: Currently, there is no clear reversal pattern. The current sideways consolidation resembles a healthy pullback during an upward trend. If the price breaks below the major support level S3 (88800-89000 USDT) and is accompanied by increased volume, caution is needed for the formation of a "double top" or deeper retracement. Conversely, if effective support is gained at S1 or S2 and breaks through immediate resistance R1 with increased volume, the sideways consolidation will end, and it will continue to test R2 and R3 upwards.
Trading strategy: Based on the current analysis, a buy-on-dips strategy can be adopted in the short term, but risk management should be exercised cautiously.
Trading direction: Bullish (Long Bias), but primarily focusing on buying low within the consolidation range.
Entry points:
Aggressive: Look for stabilization signals in the 89700 - 89800 USDT range to enter, waiting for price rebounds.
Conservative: Wait for the price to pull back to the 89400 - 89500 USDT area and enter when a stop-loss signal appears (such as long lower shadows, hammer patterns, etc.).
Take profit points:
TP1: 90500 - 90600 USDT (testing recent highs).
TP2: 90900 - 91000 USDT (breaking previous highs, expecting new highs).
Stop loss points:
If entering at 89700 - 89800 USDT, the stop loss can be set at 89200 USDT (slightly below S2).
If entering at 89400 - 89500 USDT, the stop loss can be set at 88700 USDT (slightly below S3).
* * *
For more quantitative breakdowns of how real-time information affects market sentiment, updates are available on my Qinglan Crypto Class, qinglan.org. Finally, Sister Qinglan leaves you with a trading maxim: "Trend is your friend, risk control is your shield, patience is your spear, only then can you walk steadily and far."
免责声明:本文章仅代表作者个人观点,不代表本平台的立场和观点。本文章仅供信息分享,不构成对任何人的任何投资建议。用户与作者之间的任何争议,与本平台无关。如网页中刊载的文章或图片涉及侵权,请提供相关的权利证明和身份证明发送邮件到support@aicoin.com,本平台相关工作人员将会进行核查。


