Master Discusses Hot Topics:
Yesterday, as the first day of the New Year, I should have shared some solid insights on Bitcoin analysis, but due to other reasons, I ended up writing a less substantial piece. I also did not publish any analysis on other platforms yesterday, so today it is necessary to take my time and share some insights.
First, many fans have been asking me about the 87K chip column on the Bitcoin chip distribution chart, but not many truly understand it. What does 933,000 coins mean? This is not retail sentiment; this is money, real cash that has been solidly invested.
More importantly, compared to the phase bottom on November 21, in just 41 days, this position has accumulated an additional 826,000 Bitcoins. I see some people using Coinbase wallets to make a fuss; I can only say that if you don’t understand, don’t force it.
The noise during that time was between 83K and 85K, while the 87K accumulation is basically clean, bought actively by the market, not just backend trading. In the past week, nearly 190,000 more Bitcoins have been added, what does this indicate?
This indicates that while you are scrolling through short videos and shouting bullish sentiments, someone is quietly accumulating below. It doesn’t matter what you say, where the money is placed is the truth.
Historically, the accumulation of over 800,000 coins at a single price level is already a rare species, and now it’s close to 1 million. Such a situation cannot give you a slow-moving opportunity.
My personal bias has always been straightforward; I would rather see Bitcoin drop directly, breaking below 80.5K. Let’s wipe out a bunch of stop losses, then a big bullish candle can pull back and bury both the shorts and the hesitant players. This kind of stop-loss hunting would create a healthy bottoming structure.
Continuing from yesterday's analysis, there’s no need to wash the annual line; it looks bad, and it is what it is. The first bearish close after a new high, and with this kind of closing method, anyone who looks knows what’s going on. The 100K mark is a round number + the reasonable price of the 25-year annual line. If this position cannot be held, there will be pits below.
As long as it remains oscillating below 100K in the long term, a bearish sentiment will be the main theme. The 25-year low of 75K is not meant to scare people; there’s a large area below for potential recovery. As for extreme situations, I wouldn’t rule out a black swan event dropping to 49K, because the market never adheres to rules during extreme times.
On the monthly line, the 25-year structure has formed a rise—fall—rise—new high—oscillation—spike—then fall. 74.5K is the key level on the monthly line; breaking below it would indicate a structural breakdown at the monthly level. I vaguely remember the last time this level occurred, it dropped directly from 29K to 15K.
A spike that gets pulled back is fine, but if it truly breaks down, then any long-term faith is just self-deception. If you insist on me giving a psychological price now, I would say 67K.
Not because I am aggressive, but because that is the support for the high point conversion. It is a dense trading area and also the upper end of the comprehensive cost line for this bull market.
Looking realistically, under the backdrop of a correction in the U.S. stock market, I still prioritize a bearish outlook this month, and testing the November low of 80K is normal. To put it bluntly, after looking at the monthly line, I even feel that after this rebound, we will continue to bear.
Even if we are bottoming, it will take 4 to 6 months. The first two months will be a rebound, followed by three months of decline, and then three months of bottoming. There will be basically no opportunities during the decline phase; surviving is a skill, and the real opportunities are all during the bottoming period.
Currently, the large range is 80 to 95K, and the small range is 84.5 to 80.7K, just waiting for a directional choice. Just focus on the key levels; the core below is 86.3K. If it breaks, first look at 85K, then go for 80K. The liquidity above is at 90.7K, and further up at 93.2K is a bearish order block; entering without volume is just giving it away.
As for altcoins, don’t even mention them; 99% are trash. It took me a year to get people to admit there’s no altcoin season; where were you all this time? It’s a good thing to squeeze out the bubbles; otherwise, this circle will always be about scammers cutting each other…
Master Looks at Trends:
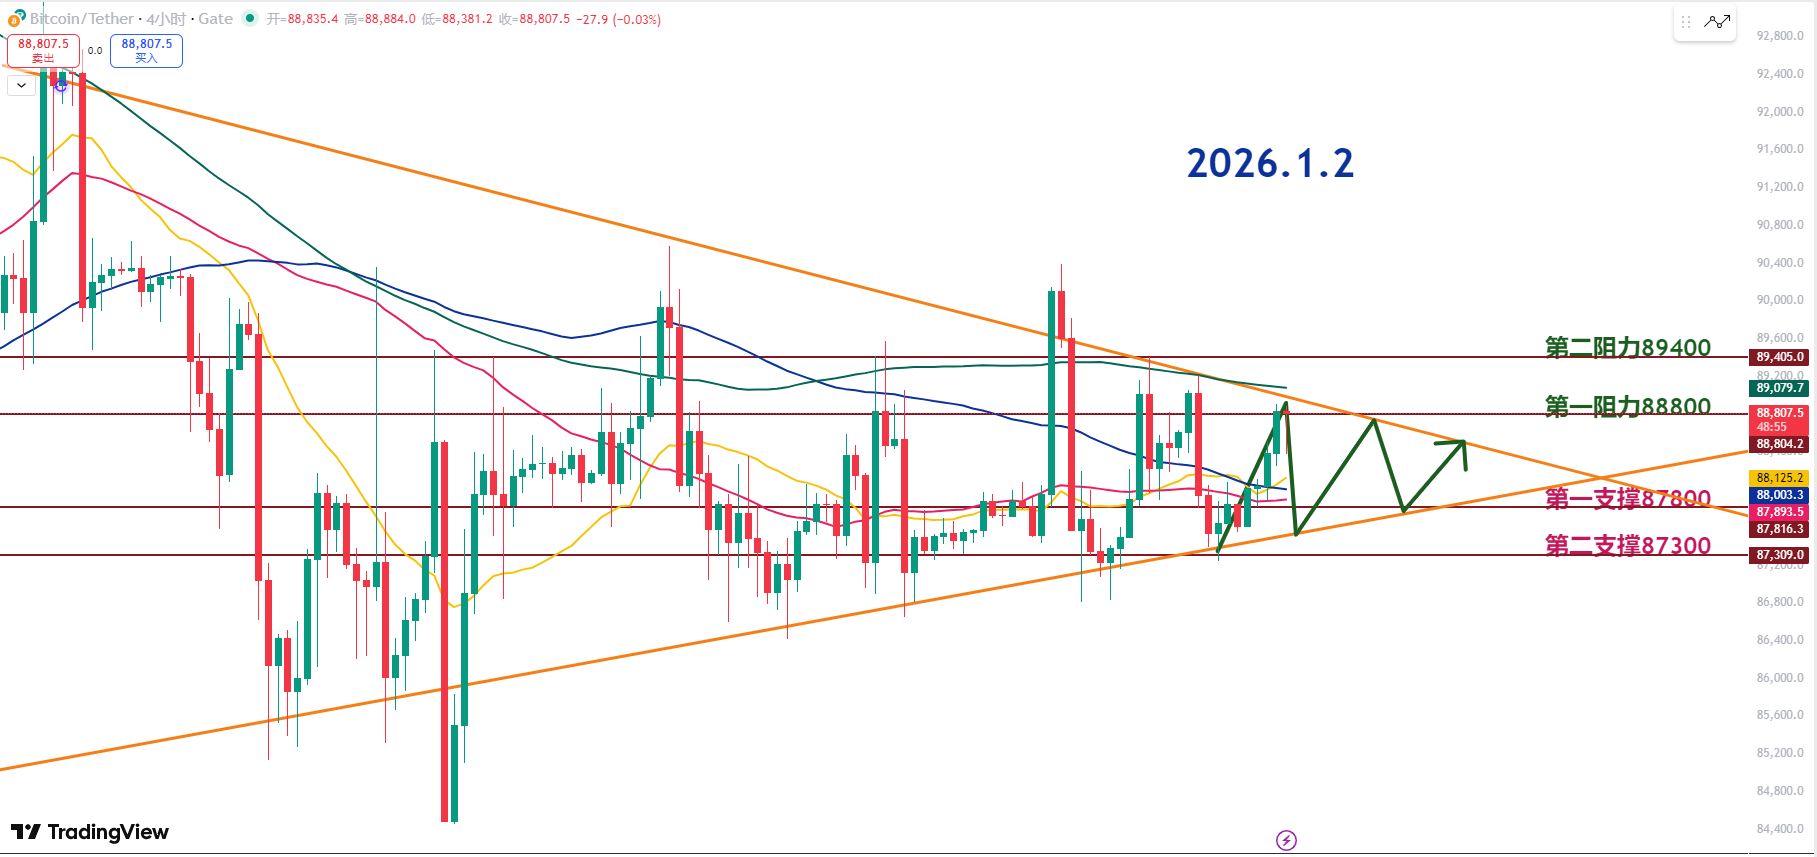
Currently, Bitcoin's price is still operating within a converging triangle structure, repeatedly sweeping up and down, typical of a volatile market. The real significance of the triangle nearing its end is the final breakout direction; aggressive trading is not recommended until the direction is clear.
The 200-day moving average is currently an important resistance level. If the 200MA is effectively broken during its downward movement and the price stabilizes, the probability of it turning into support will significantly increase.
Due to the previous long period of sideways movement, this area is a strong resistance zone. Once a breakout occurs with volume, the probability of a retest being supported will be higher. Focus on the area between 87.3K and 87.8K below.
This serves as a short-term support zone, and it’s important to observe whether the 20MA and 120MA provide effective support. The RSI is at 54, indicating that there is still room for a short-term pullback, so it’s not advisable to chase highs blindly.
The 87.3–87.8K range is an important support zone from the long-term sideways movement before the previous surge. Pay close attention to the price performance within the converging range and whether the support zones of the 20MA and 120MA form effective defenses.
Before the price effectively stabilizes above 89K, the market is likely to maintain an oscillating box structure. In the short term, the 200MA can be viewed as the main resistance level; if it breaks out with volume, one can wait for a retest before considering follow-up actions.
1.2 Master’s Wave Band Pre-Set:
Long Entry Reference: Buy in the 87300-87800 range, Target: 88800-89400
Short Entry Reference: Not applicable for now
If you truly want to learn something from a blogger, you need to keep following them, rather than making hasty conclusions after just a few market observations. This market is filled with performers; today they screenshot long positions, tomorrow they summarize short positions, making it seem like they "always catch the tops and bottoms," but in reality, it’s all hindsight. A truly worthy blogger will have a trading logic that is consistent, coherent, and withstands scrutiny, rather than jumping in only when the market moves. Don’t be blinded by exaggerated data and out-of-context screenshots; long-term observation and deep understanding are necessary to discern who is a thinker and who is a dreamer!
This content is exclusively planned and published by Master Chen (WeChat: Coin Master Chen). For more real-time investment strategies, solutions, spot trading, short, medium, and long-term contract trading techniques, operational skills, and knowledge about candlesticks, you can join Master Chen for learning and communication. A free experience group for fans has been opened, along with community live broadcasts and other quality experience projects!

Warm reminder: This article is only written by Master Chen on the official account (as shown above), and any other advertisements at the end of the article or in the comments section are unrelated to the author!! Please be cautious in distinguishing between true and false, thank you for reading.
免责声明:本文章仅代表作者个人观点,不代表本平台的立场和观点。本文章仅供信息分享,不构成对任何人的任何投资建议。用户与作者之间的任何争议,与本平台无关。如网页中刊载的文章或图片涉及侵权,请提供相关的权利证明和身份证明发送邮件到support@aicoin.com,本平台相关工作人员将会进行核查。