Bitcoin has fallen below $90,000, closing at $90,000. In 2025, the monthly and quarterly candles have closed, and from this month's candle, it is very clear that it closed below $90,000, specifically at $92,985.
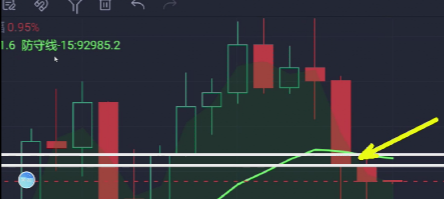
This is an important resistance level on the monthly chart, with the next level of resistance at $91,400. We can summarize that if Bitcoin wants to take a medium or long-term short position, we can open shorts near the highs around $90,000 to $93,000.
Is there a possibility of a bullish push? Could it spike to $94,000 or $95,000? There is that possibility. I just mentioned that we should look to open shorts near the highs around $91,400 to $93,000. This is based on the monthly chart, where we are observing a larger trend. If we want to go long, we should pay attention to these price levels.
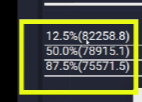
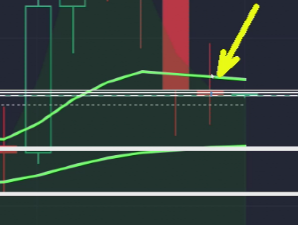
In the range of $81,000 to $82,000, if it suddenly drops below the low of $80,000, we first look at $78,900, and then the stronger support levels are $70,000 to $75,000. I personally believe it won't drop below $70,000 in the short term. In the short term, it will still need to consolidate around $80,000 for a while, so around $80,000 is a good area to open short-term longs. For short-term defense, we can set it around $78,000. Initially, I was also considering going long in the range of $78,000 to $80,000, and ultimately entered around $80,600 at market price, which allowed me to profit from this long position.
Now it's simple: go long above $90,000, and in the range of $80,000 to $78,000, we can make short-term longs. For the high points in the $80,000 to $78,000 range, we can wait for very short-term longs, and for intraday trades, we can wait for $81,000 and $82,000.
If we want to make even shorter trades, we need to combine the 5-minute and 15-minute charts for ultra-short longs. Today is a major cycle change, and we need to reassess the long-term layout. The strong support on the monthly chart is around $70,000 to $75,000. If this level holds, it will rebound. If it drops to around $75,000 or $76,000, it will rebound to the $82,000 to $83,000 range.
Ethereum's monthly chart also looks quite ugly; we can see it forming an inside doji.
The upper shadow is long and has also broken down, closing below $3,000. As long as Ethereum is above $3,100, we should look to open shorts at the highs. Is there a chance it could reach $3,100?
From the monthly chart, there is a chance to rebound to around $3,100, $3,130, or even $3,200. This position has strong monthly resistance at the $3,560 to $3,600 range. Of course, we need to identify this resistance level on the monthly chart and find it in batches. The recent levels we can reach are around $3,079 and $3,080, so we can set up shorts in the $3,080 to $3,130 range.
If you are pursuing a conservative approach and are worried that the larger cycle rebound might reach $3,200, then the $3,236 to $3,400 range is a strong resistance, with $3,500 and $3,560 as key levels.
In the short term, it won't reach those levels quickly; it needs time to consolidate. The larger range for Ethereum is between $2,600 and $2,800.
At this relative low point in the box, if it falls back down, the supports at $2,600, $2,700, and $2,800 can be used as references for short-term longs.
The strong support for the medium to long term is worth noting at $2,300, $2,400, and $2,500. If we are making short-term shorts and longs, we also need to consider the 4-hour chart. Currently, the short-term pressure level on the 4-hour chart is $3,056, which is a short-term short position for the day. In the next couple of days, as long as it can rally to $3,056, the short-term short position should be fine. You can see that every time it reaches this level, it tends to pull back. We can only make judgments based on real-time trends and patterns. Finally, I wish everyone wealth in 2026.
For more market analysis, follow the public account BTC-ETH Crypto.

免责声明:本文章仅代表作者个人观点,不代表本平台的立场和观点。本文章仅供信息分享,不构成对任何人的任何投资建议。用户与作者之间的任何争议,与本平台无关。如网页中刊载的文章或图片涉及侵权,请提供相关的权利证明和身份证明发送邮件到support@aicoin.com,本平台相关工作人员将会进行核查。