Cryptocurrency Market Overview
According to CoinGecko data, from December 2 to December 15, 2025, the global market showed a mixed trend. Despite the Fed's expected interest rate cut, policy divergence and expectations of a pause in rate cuts suppressed risk appetite; gold led traditional assets with an increase of over 60% this year, while the stock market reached new highs, but sentiment in the AI infrastructure sector cooled. Fear sentiment in the cryptocurrency market has risen, with trading volume concentrated in mainstream assets and stablecoins, and overall funds leaning towards defensive strategies and volatility hedging. 【1】
In terms of market structure, BTC surged above $94,000 before significantly retreating, forming a lower high structure on the 4-hour chart, with the $90,000–$91,000 range shifting from support to resistance; ETH retreated from around $3,400 but still maintained a stable oscillation above $3,000, with a relatively robust price structure. Some tokens performed strongly against the trend, with M rising over 46% last week, and MERL and ZEC recording increases of approximately 28% and 19%, respectively, becoming short-term highlights. On the news front, Polygon's network throughput increased by about 33% after completing the Madhugiri hard fork upgrade; Ethereum's daily transaction fees (90-day average) fell below 300 ETH/day, reaching a multi-year low. Meanwhile, institutions continue to promote Bitcoin collateral business, and regulators have signaled a faster pace in rule-making and expanding the range of eligible collateral, indicating a marginal improvement in the long-term institutional environment.
In terms of on-chain capital flow, Hyperliquid led with a net inflow of about $190 million, reflecting the market's concentrated bet on on-chain perpetual contracts, high-frequency trading, and high capital efficiency infrastructure; new trading scenarios have amplified the scale of capital inflows in the short term. In contrast, the actual adoption of the stablecoin public chain Stable after its mainnet launch was lower than earlier narrative expectations, and its subsequent performance still relies on real applications and use cases, given the dominance of existing mature public chain stablecoin networks.
Overall, the current market remains in a phase of "high macro uncertainty, dominated by structural opportunities," with capital behavior centered on defensive allocation and efficiency prioritization. The conditions for a comprehensive rebound in risk appetite have not yet matured in the short term, and the market is more likely to maintain a cautious game and structural rotation.
Overview of Recent Price Fluctuations
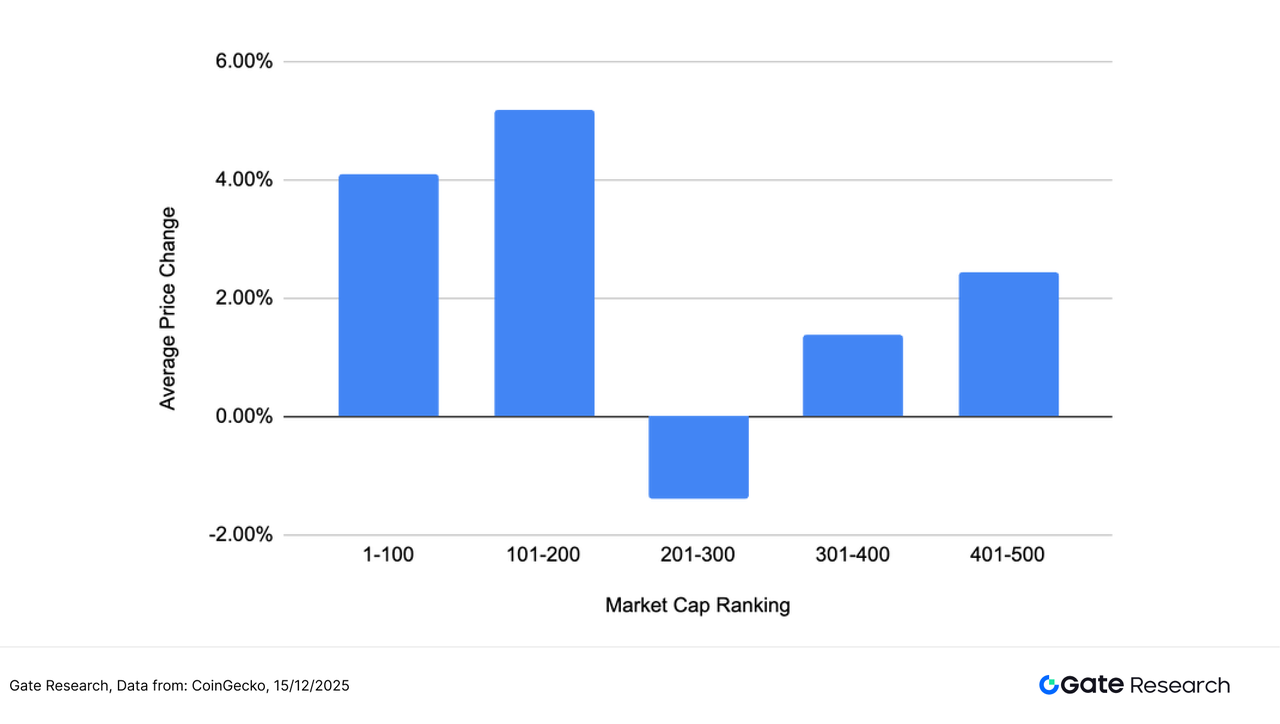
This article groups and analyzes the top 500 tokens by market capitalization, observing their average price changes from December 2 to December 15. The market did not experience a comprehensive synchronized pullback this period but showed significant structural differentiation. Assets ranked higher by market capitalization performed relatively better, with an average increase of 4.10% for the $1–$100 market cap range, and further rising to 5.18% for the $101–$200 range, indicating that mainstream and sub-mainstream assets still hold relative attractiveness in capital allocation.
In contrast, the $201–$300 market cap range saw a slight decline of -1.38%, becoming the only group to record negative returns, reflecting that mid-cap tokens are under more pressure amid selective capital withdrawals. The lower-ranked $301–$400 and $401–$500 ranges recorded positive returns of 1.38% and 2.43%, respectively, indicating that some small-cap assets maintained moderate recovery driven by low bases and thematic capital.
Overall, the market at this stage exhibits a layered characteristic of "leading assets rising, mid-range under pressure, and tail-end recovery," where capital has not simply avoided risk but is more inclined to make structural allocations between liquidity, narratives, and resilience, with significant differences in performance across market cap ranges.
Note: The market cap distribution is based on CoinGecko data, grouping the top 500 tokens by market cap into segments of 100 (e.g., ranks 1–100, 101–200, etc.), calculating the price changes of tokens within each group from December 2 to December 15, 2025, and computing the average for each group as the average increase indicator for that market cap range. The overall average increase (2.34%) is the unweighted average of individual increases of the top 500 tokens.
Figure 1: The overall average increase is 2.34%, and the market did not experience a comprehensive synchronized pullback but showed significant structural differentiation.
Top Gainers and Losers
In the past two weeks (from December 2 to December 15), the cryptocurrency market exhibited high differentiation against the backdrop of macro uncertainty and rapid narrative rotation, with significant fluctuations in the price changes of individual tokens, reflecting that short-term capital is still primarily engaged in high-volatility speculation.
Top Gainers: High Elasticity Thematic Tokens Surge, BEAT and NIGHT Lead
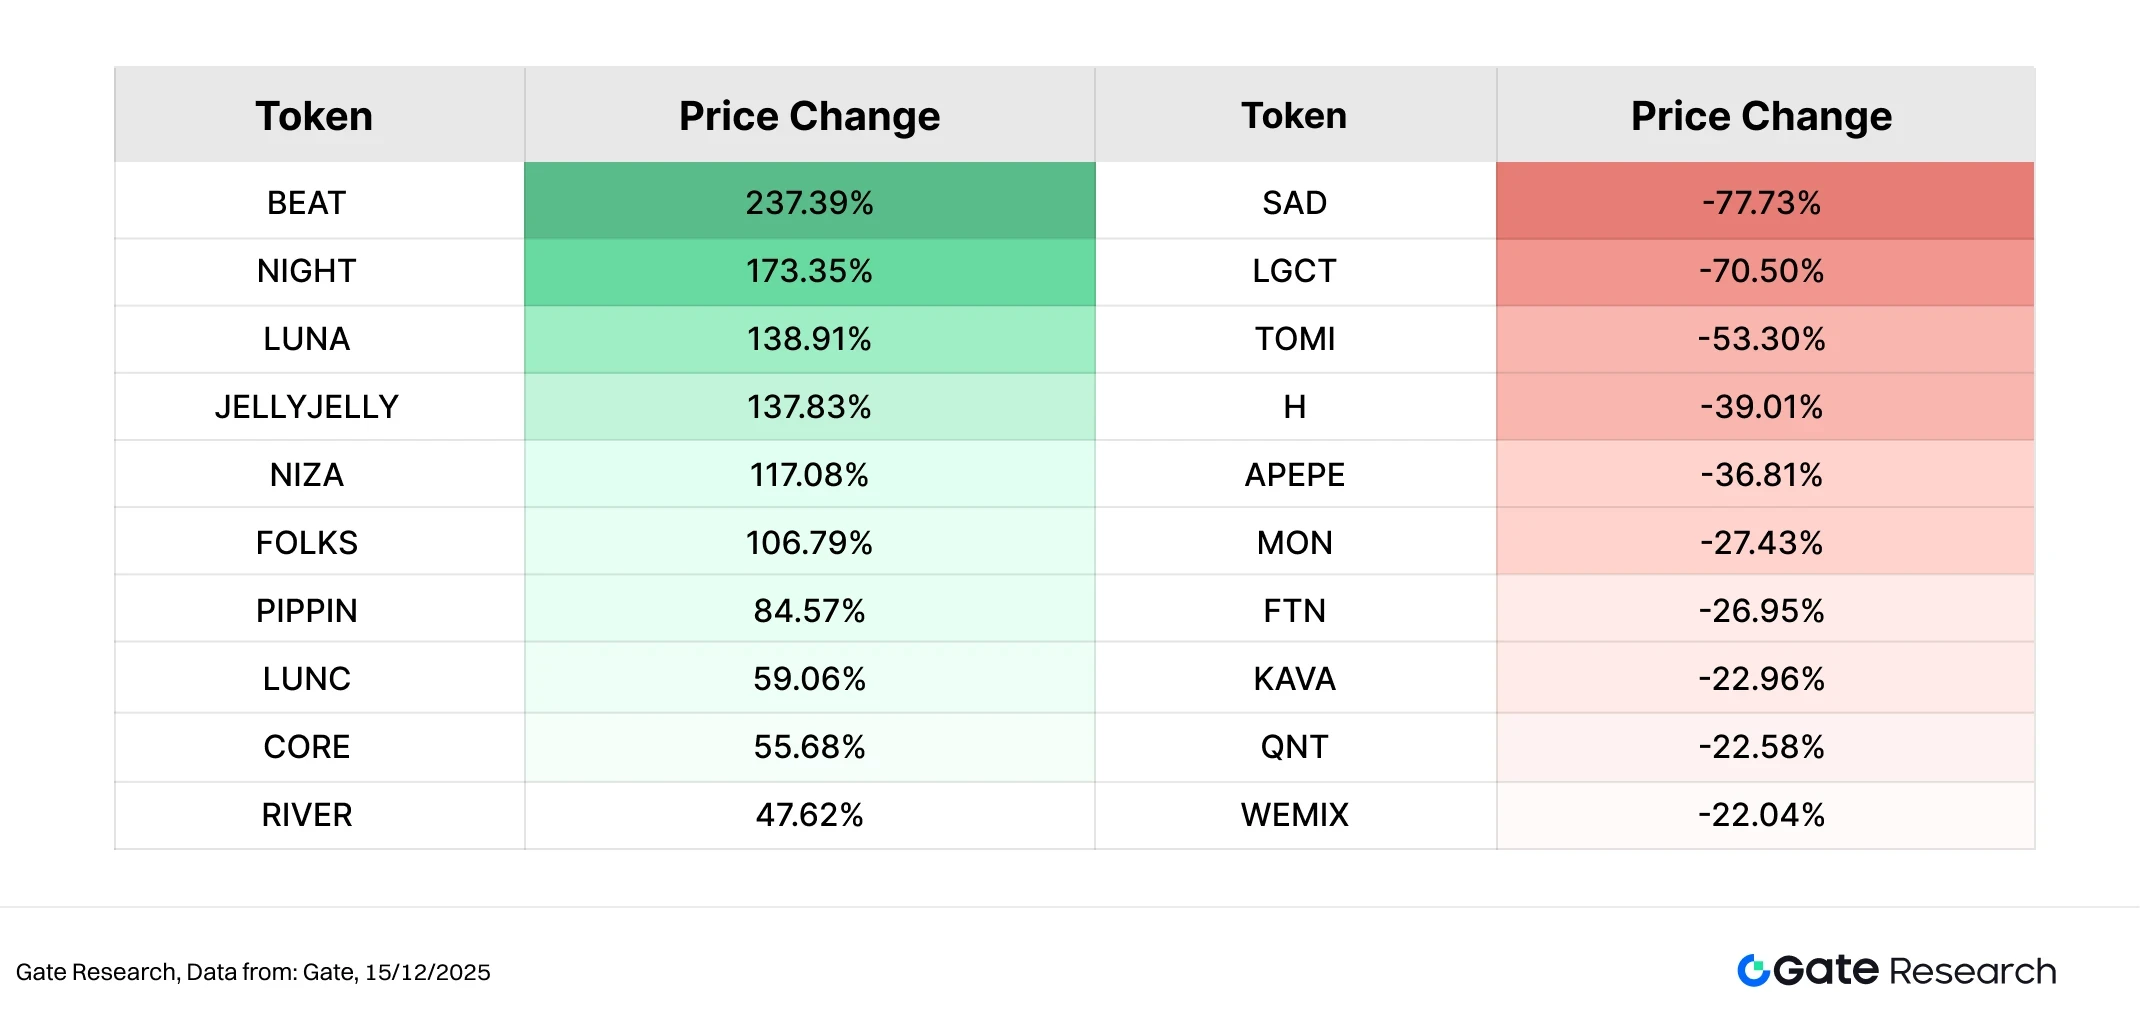
In this period's gainers list, BEAT topped with a 237.39% increase. As an application token focused on AI music and virtual content creation, BEAT benefited from the continued rise of AI narratives combined with its small market cap, attracting short-term capital to concentrate its involvement, amplifying price elasticity.
NIGHT (+173.35%) ranked second, being the ecosystem token of Midnight Network, which emphasizes a "privacy by default + selective disclosure" compliant privacy blockchain narrative, targeting scenarios in finance, identity, and data sharing. As the mainnet and roadmap become clearer, the market's phased reassessment of privacy computing and compliant infrastructure has propelled NIGHT's outstanding performance in the recovery market.
Following this, tokens like LUNA and JELLYJELLY also saw increases exceeding 100%, reflecting an overall preference for mid- to small-cap, strong narrative, and high-volatility high-elasticity targets.
Top Losers: High-Risk Assets Retreat Significantly, Weak Consensus Tokens Under Pressure
On the losers list, SAD and LGCT led the decline, indicating that some tokens with weaker liquidity or insufficient fundamental support faced selling pressure first during increased market volatility. TOMI, H, APEPE, MON, and others recorded declines ranging from 30% to 50%, mostly concentrated in assets with fading narratives, limited trading depth, or excessive prior speculation, reflecting capital's phased avoidance of high Beta risks.
Overall, this period's gainers and losers list presents a typical pattern of "the strong get stronger, the weak are quickly cleared out." Capital has not fully exited the market but has selectively bet on high-elasticity themes in a high-volatility environment while rapidly reducing exposure to assets lacking sustained narratives and support. In the short term, small-cap tokens with clear themes, community consensus, and active trading may remain active, but overall risk appetite remains cautious, with significant structural market characteristics.
Figure 2: BEAT, with a 237.39% increase, firmly holds the market's top position, primarily benefiting from the continued rise of AI narratives, combined with the high elasticity characteristics brought by its small market cap, attracting concentrated short-term capital inflow, thus significantly amplifying price volatility.
Relationship Between Market Cap Ranking and Price Fluctuations
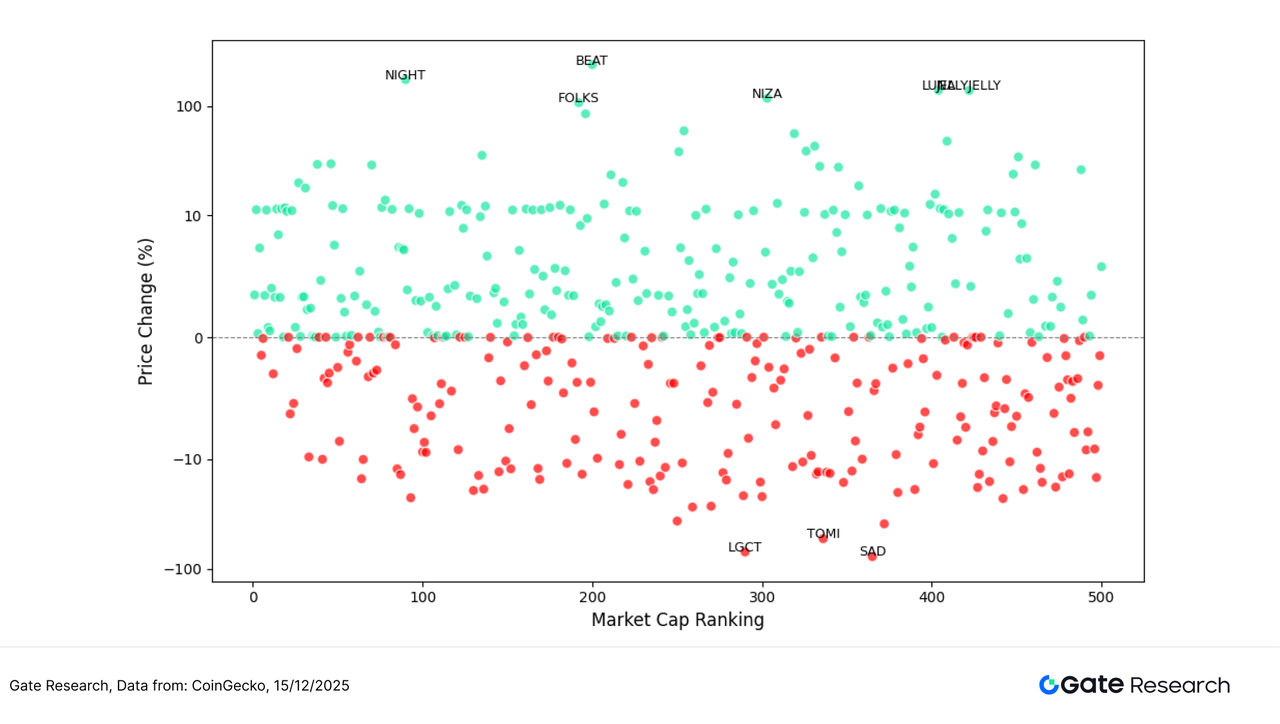
To observe the structural characteristics of token performance in this round of market activity, this article presents a scatter distribution chart of the top 500 tokens by market capitalization. The horizontal axis represents market cap ranking (the further left, the larger the market cap), and the vertical axis represents price fluctuations from December 2 to December 15. Each dot in the chart represents a token, with green indicating an increase and red indicating a decrease.
Overall, the number of declining tokens still predominates, with negative return points widely distributed across various market cap ranges, indicating that the market is still in a phase of weak sentiment and limited recovery momentum. However, in the upward direction, tokens with significant increases are clearly concentrated in the lower mid-cap range, reflecting a preference for high-elasticity, strong narrative-driven targets.
Structurally, high-increase tokens like BEAT, NIGHT, FOLKS, NIZA, and JELLYJELLY are mainly distributed in the mid to lower market cap segments, forming scattered but significant "strong outliers," indicating that short-term capital is participating in the market through concentrated betting; conversely, tokens with significant declines like LGCT, TOMI, and SAD are also concentrated in the mid to lower market cap range, experiencing larger pullbacks, reflecting that this range is more prone to accelerated declines during liquidity contractions.
Overall, this round of market activity exhibits characteristics of "relative stability in large caps, high differentiation in mid and small caps," where increases are not broadly disseminated but concentrated in a few high-consensus, high-volatility targets; declines cover a wider range, becoming the dominant state of the market. This structure indicates that current capital behavior is still primarily focused on short-term trading and thematic speculation, with risk appetite not yet returning to a fully recovered phase.
Figure 3: The scatter distribution of price fluctuations among the top 500 tokens shows that upward projects are concentrated in a few high-consensus, high-volatility targets; declines cover a wider range, becoming the dominant state of the market.
Top 100 Market Cap Rankings
In this round of volatile market conditions, the top 100 tokens by market capitalization continued to show a differentiated pattern, with mainstream assets overall under pressure, but some projects with clear narratives or structural support still achieved relative gains.
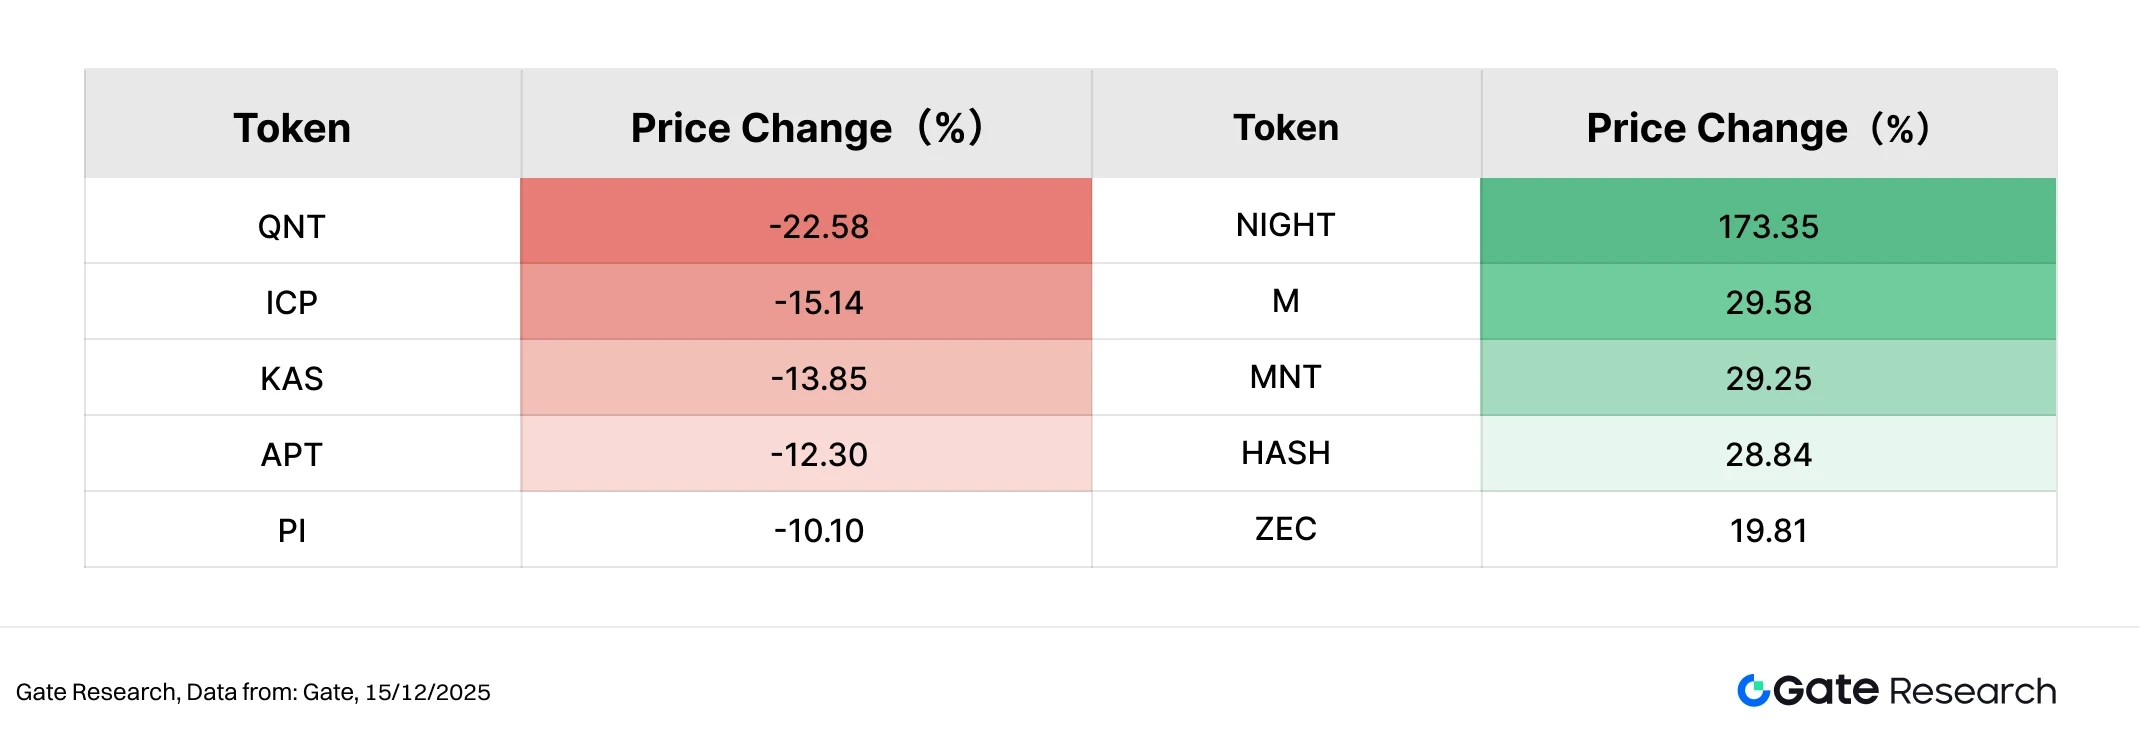
In terms of increases, NIGHT (+173.35%) significantly led the top 100 by market cap, becoming one of the few mainstream tokens to record substantial increases, reflecting concentrated capital attention on privacy computing and compliant blockchain narratives during the phased recovery market. Following this, M (+29.58%) and MNT (+29.25%) performed relatively steadily, while HASH (+28.84%) and ZEC (+19.81%) also recorded double-digit increases, indicating that assets related to computing power, infrastructure, and privacy have certain support under risk-averse sentiment. Overall, the number of rising projects among the top 100 is limited, but the concentration of increases is high, showing a characteristic of "a few strong performers, not widespread diffusion."
In terms of declines, QNT (-22.58%) led the losses, with ICP (-15.14%), KAS (-13.85%), and APT (-12.30%) also experiencing significant pullbacks. The declining targets are mostly projects that previously exhibited high Beta characteristics or were overvalued in the short term, facing more significant pressure amid cooling risk appetite and capital contraction.
Overall, the top 100 assets exhibit a structural pattern of "strong narratives breaking through individually, while the majority retreat." Capital has not fully exited mainstream assets but has selectively allocated to tokens with differentiated positioning and mid-term logical support, indicating that the current market remains in a phase of cautious speculation and structural prioritization.
Figure 4: Among the top 100 tokens by market cap, NIGHT leads the gains, reflecting concentrated capital attention on privacy computing and compliant blockchain narratives during the phased recovery market.
Analysis of Recent Volume Performance
Transaction Volume Growth Analysis
In addition to price rebounds, further observation of transaction volume changes can more clearly reflect the structure of capital participation. This period's data shows that the increase in transaction volume is mainly concentrated in the mid to small-cap tokens ranked 200–400 by market capitalization, overall presenting a characteristic of "increased volume but significant differentiation in rebounds."
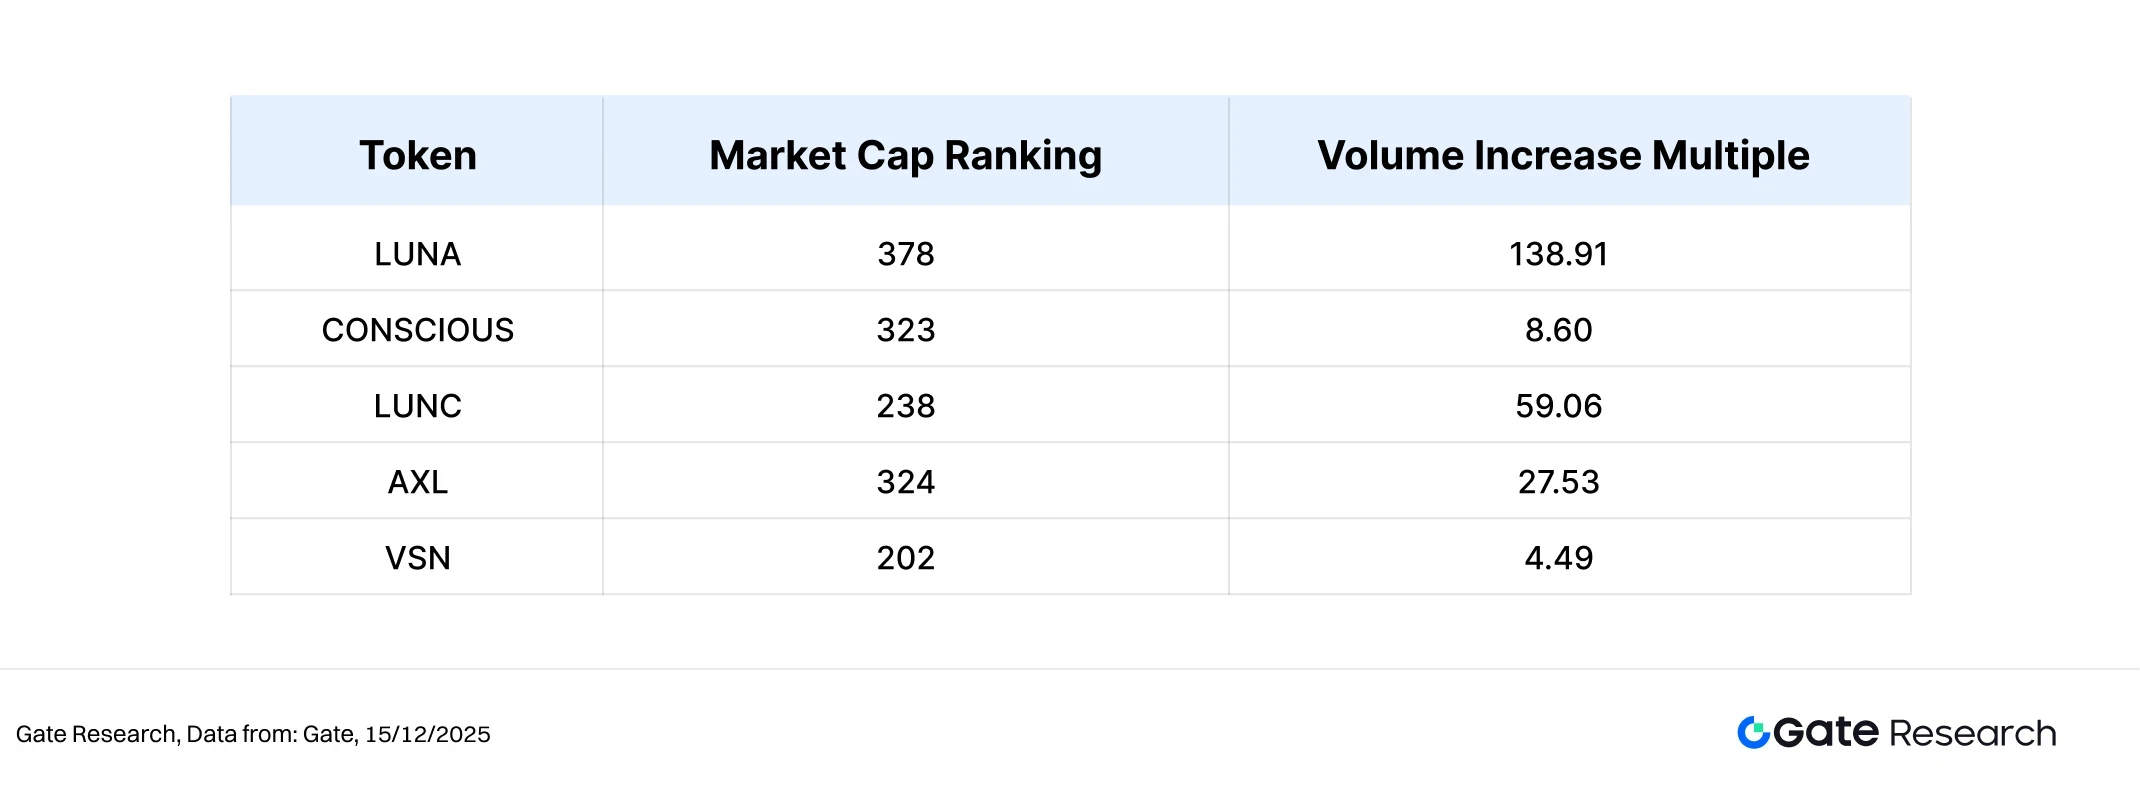
Among them, LUNA saw its trading volume increase by 138.91 times, while recording a rebound of 24.58%, making it the most significant asset in terms of volume and price resonance this period, indicating that short-term capital concentrated on low levels to speculate on a rebound. CONSCIOUS experienced an 8.60 times increase in trading volume and a price rebound of 19.05%, also showing a relatively healthy "volume-price synchronization" structure, reflecting a simultaneous rise in market attention and buying support.
In contrast, LUNC and AXL recorded trading volume increases of 59.06 times and 27.53 times, respectively, but their price rebounds were only 10.40% and 5.95%, indicating that the volume increase was more due to short-term turnover and liquidity replenishment rather than a trend-driven capital inflow. VSN's trading volume and price rebound were both relatively limited, overall still leaning towards tentative recovery.
Overall, the tokens with increased volume this period were mainly mid to lower market cap assets, with volume increases primarily driven by short-term speculation and rebound trading. The assets that truly achieved "volume + significant rebound" remain few. This indicates that current market capital is more inclined towards phase-specific trading opportunities rather than a comprehensive trend initiation, and risk appetite has not shown substantial warming.
Figure 5: Tokens like LUNA and CONSCIOUS saw significant increases in trading volume this period, with some achieving synchronized rebounds in volume and price, but there are also projects showing increased volume with limited price increases, indicating that current capital is primarily focused on short-term speculation and liquidity trading, with trend-driven buying not yet fully established.
Volume Changes and Price Analysis
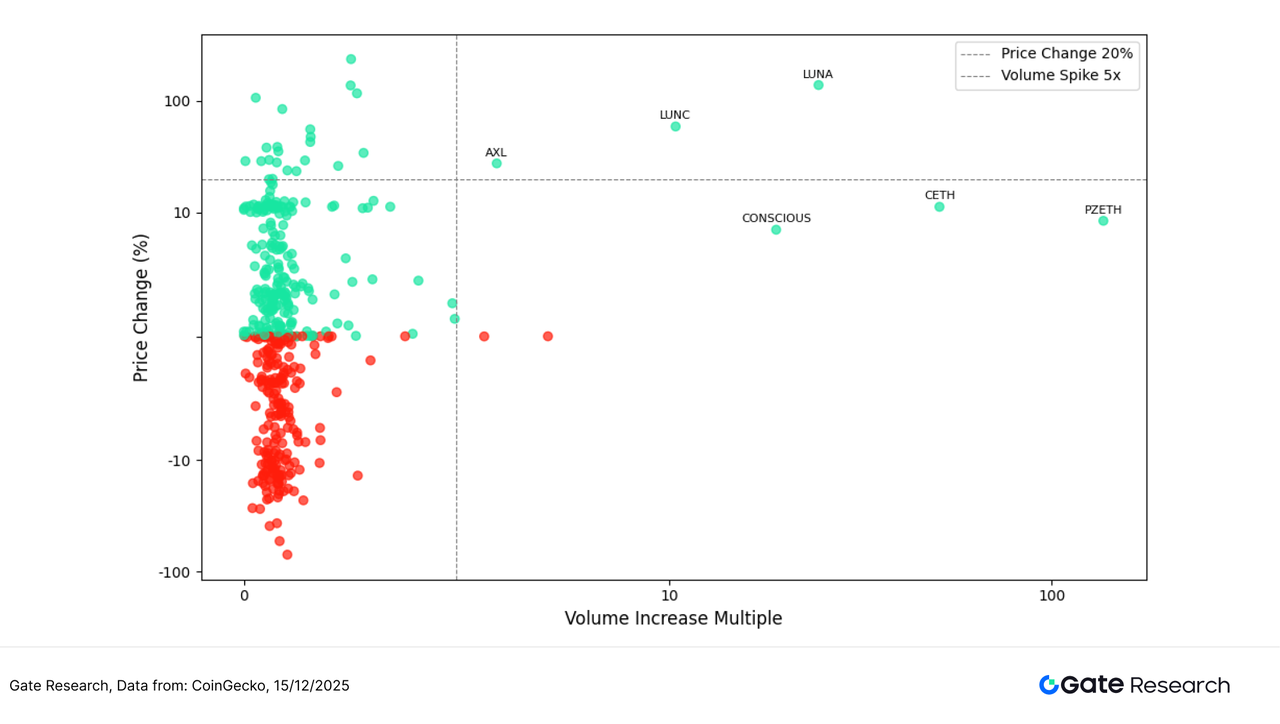
To further characterize the relationship between volume behavior and price response, this article conducts a cross-analysis of trading volume growth multiples and corresponding price fluctuations. The horizontal axis in the chart represents the volume increase multiple, while the vertical axis represents the price change magnitude, with key thresholds (e.g., volume increase of 5 times, price increase of 20%) delineating different market structure areas.
From the overall distribution, most tokens remain concentrated in the low trading volume increase and small price fluctuation range, indicating that overall market trading activity is limited, and incremental capital has not formed a systematic return; at the same time, the number of declining points still slightly exceeds that of rising points, reflecting that market sentiment remains cautious, overall in a phase of oscillatory recovery.
In the area where both volume increase and price rise are established, only a few tokens performed outstandingly. Among them, LUNA, with a volume increase of over a hundred times, saw its price rebound exceed 100%, presenting a typical "volume + strong rebound" structure, indicating that short-term capital concentrated on low levels and formed a phase-specific consensus. LUNC also exhibited a high volume increase and double-digit growth, but its price elasticity was slightly weaker than LUNA, reflecting more of a rebound recovery under high-frequency turnover.
In contrast, tokens like CONSCIOUS and AXL, while showing significant volume increases, had price increases still lingering in the 10%–20% range, indicating that capital is more in a tentative participation or short-term speculation phase, not yet forming a trend-driven surge. Additionally, assets like CETH and PZETH, despite extreme volume increases, only saw moderate price rises, reflecting their attributes leaning more towards staking, derivatives, or structural assets, with high trading volume primarily coming from rebalancing, arbitrage, or on-chain liquidity demand rather than directional buying.
Overall, this period's market exhibits a clear "volume-price stratification" characteristic, with very few tokens achieving true volume-price resonance, and most volume behaviors failing to translate into significant price increases, indicating that current capital is still primarily focused on short-term trading and liquidity operations, with risk appetite and trend-driven capital not yet fully returning.
Figure 6: The scatter distribution of volume growth multiples and price fluctuations shows that increased volume does not necessarily correspond to price increases, with only a few tokens achieving volume-price resonance, and the market overall remains in a phase of oscillatory recovery and structural speculation.
Correlation Analysis
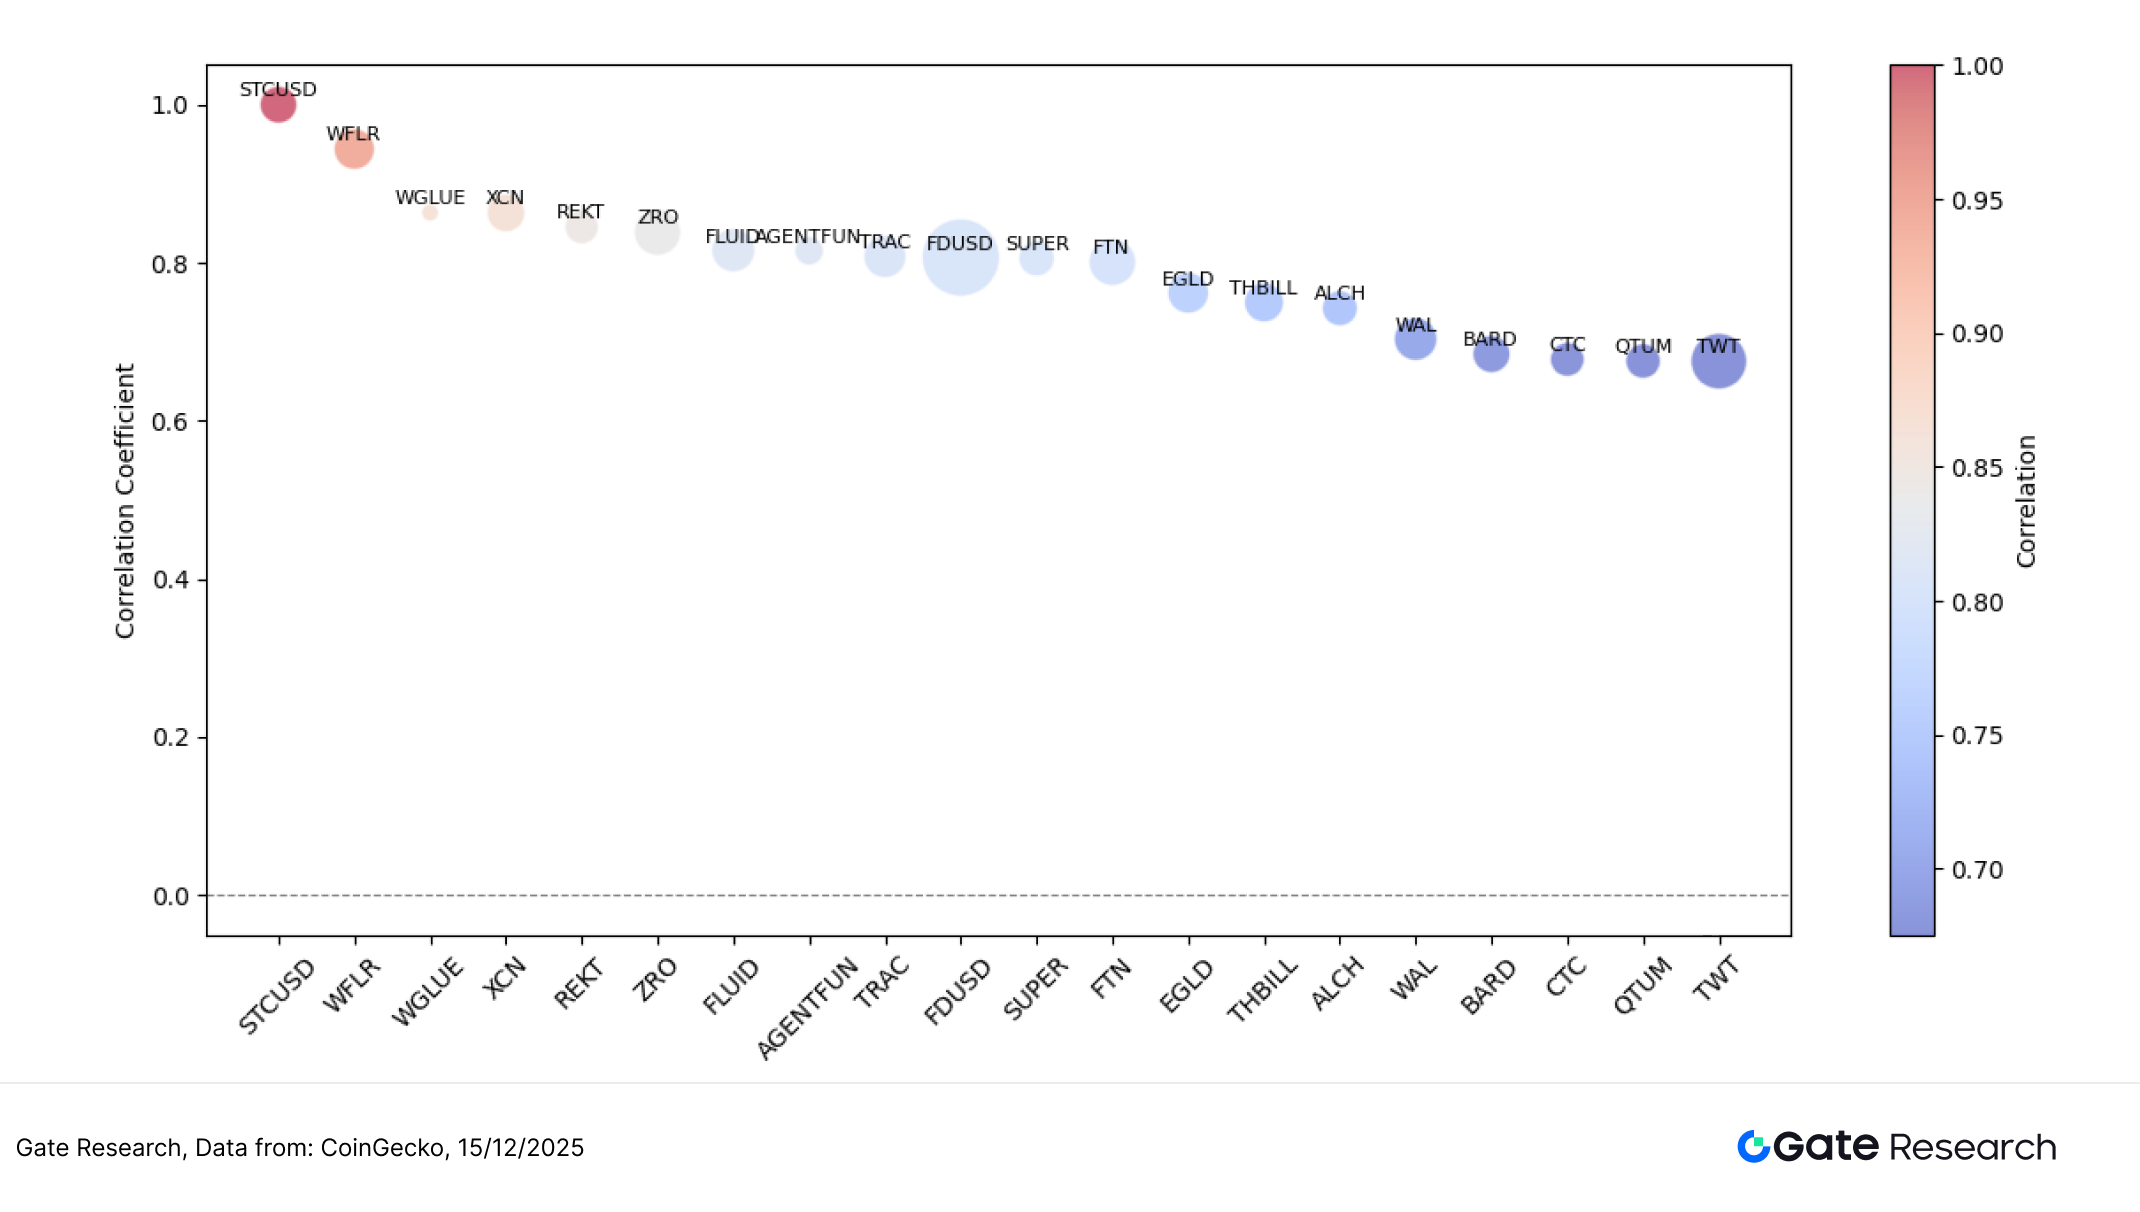
After exploring the linkage between trading volume and price performance, this article further analyzes the systematic correlation between the two from a statistical perspective. By using "volume growth rate / market cap" as a relative capital activity indicator and calculating its correlation coefficient with price fluctuations to identify token types that are more easily driven by capital. The size of the circles in the chart represents the strength of relative capital activity; the larger the circle, the more pronounced the volume expansion under unit market cap, and the higher the price sensitivity to capital inflows.
From the chart, it can be seen that most tokens' correlations are concentrated in the 0.65–0.85 range, indicating that in the current market, price fluctuations are still significantly driven by trading activity, but do not present a fully consistent strong synchronization state, reflecting that capital behavior has shown some stratification.
In the high correlation range, tokens like STCUSD, WFLR, WGLUE, and XCN have correlation coefficients close to or above 0.85–0.90, indicating that their price trends are highly consistent with volume changes. These assets typically possess strong trading attributes, high liquidity dependence, or clear narrative drivers, making their prices more susceptible to rapid increases or decreases during volume expansion phases, categorizing them as typical high Beta, sentiment-sensitive targets.
Tokens with correlations in the 0.75–0.85 range exhibit characteristics of "fluctuating with volume but with controllable amplitude," where prices are influenced by capital inflows and outflows while retaining some fundamental or functional support; meanwhile, low-correlation assets like WAL, BARD, CTC, and QTUM are less sensitive to volume changes, driven more by medium to long-term demand and ecological progress, exhibiting relative defensiveness. Overall, the correlation distribution this period shows a clear structural stratification: high-correlation assets are driven by trading and sentiment, medium-correlation assets balance capital and logic, and low-correlation assets are more independent, reflecting that the market has entered a phase of refined pricing based on asset attributes.
Figure 7: The correlation between trading volume activity and price fluctuations shows that trading and sentiment-driven tokens have significantly higher correlations, while infrastructure and mature ecological tokens are relatively less sensitive to volume changes, with a clear structural stratification in the market.
This round of the cryptocurrency market continues the structural rotation pattern under macro uncertainty, with the top 500 tokens overall recording a moderate increase of about 2.34%, but with significant differentiation in performance. Leading assets are relatively dominant, mid-cap assets are under pressure, while small-cap assets at the tail end show signs of recovery. On the thematic level, high-elasticity assets have surged, with BEAT, NIGHT, and LUNA significantly strengthening under the drivers of AI applications, privacy computing, and high-volatility speculation; conversely, tokens like SAD, LGCT, and TOMI, which previously had weak consensus or high Beta characteristics, have quickly retraced. Although trading volume has significantly increased in some mid- to small-cap tokens, the overall trend still presents a "volume differentiation" characteristic, with trend-driven consensus not yet formed.
In addition to trading conditions, several potential airdrop projects are also being actively promoted, covering popular directions such as AI, Layer 2, social points, and identity verification. If users can grasp the rhythm and continue to participate in interactions, they are expected to gain an early position in the oscillatory market, obtaining token incentives and airdrop qualifications. The following will organize four noteworthy projects and participation methods to assist in systematically laying out Web3 dividend opportunities.
Airdrop Hot Projects
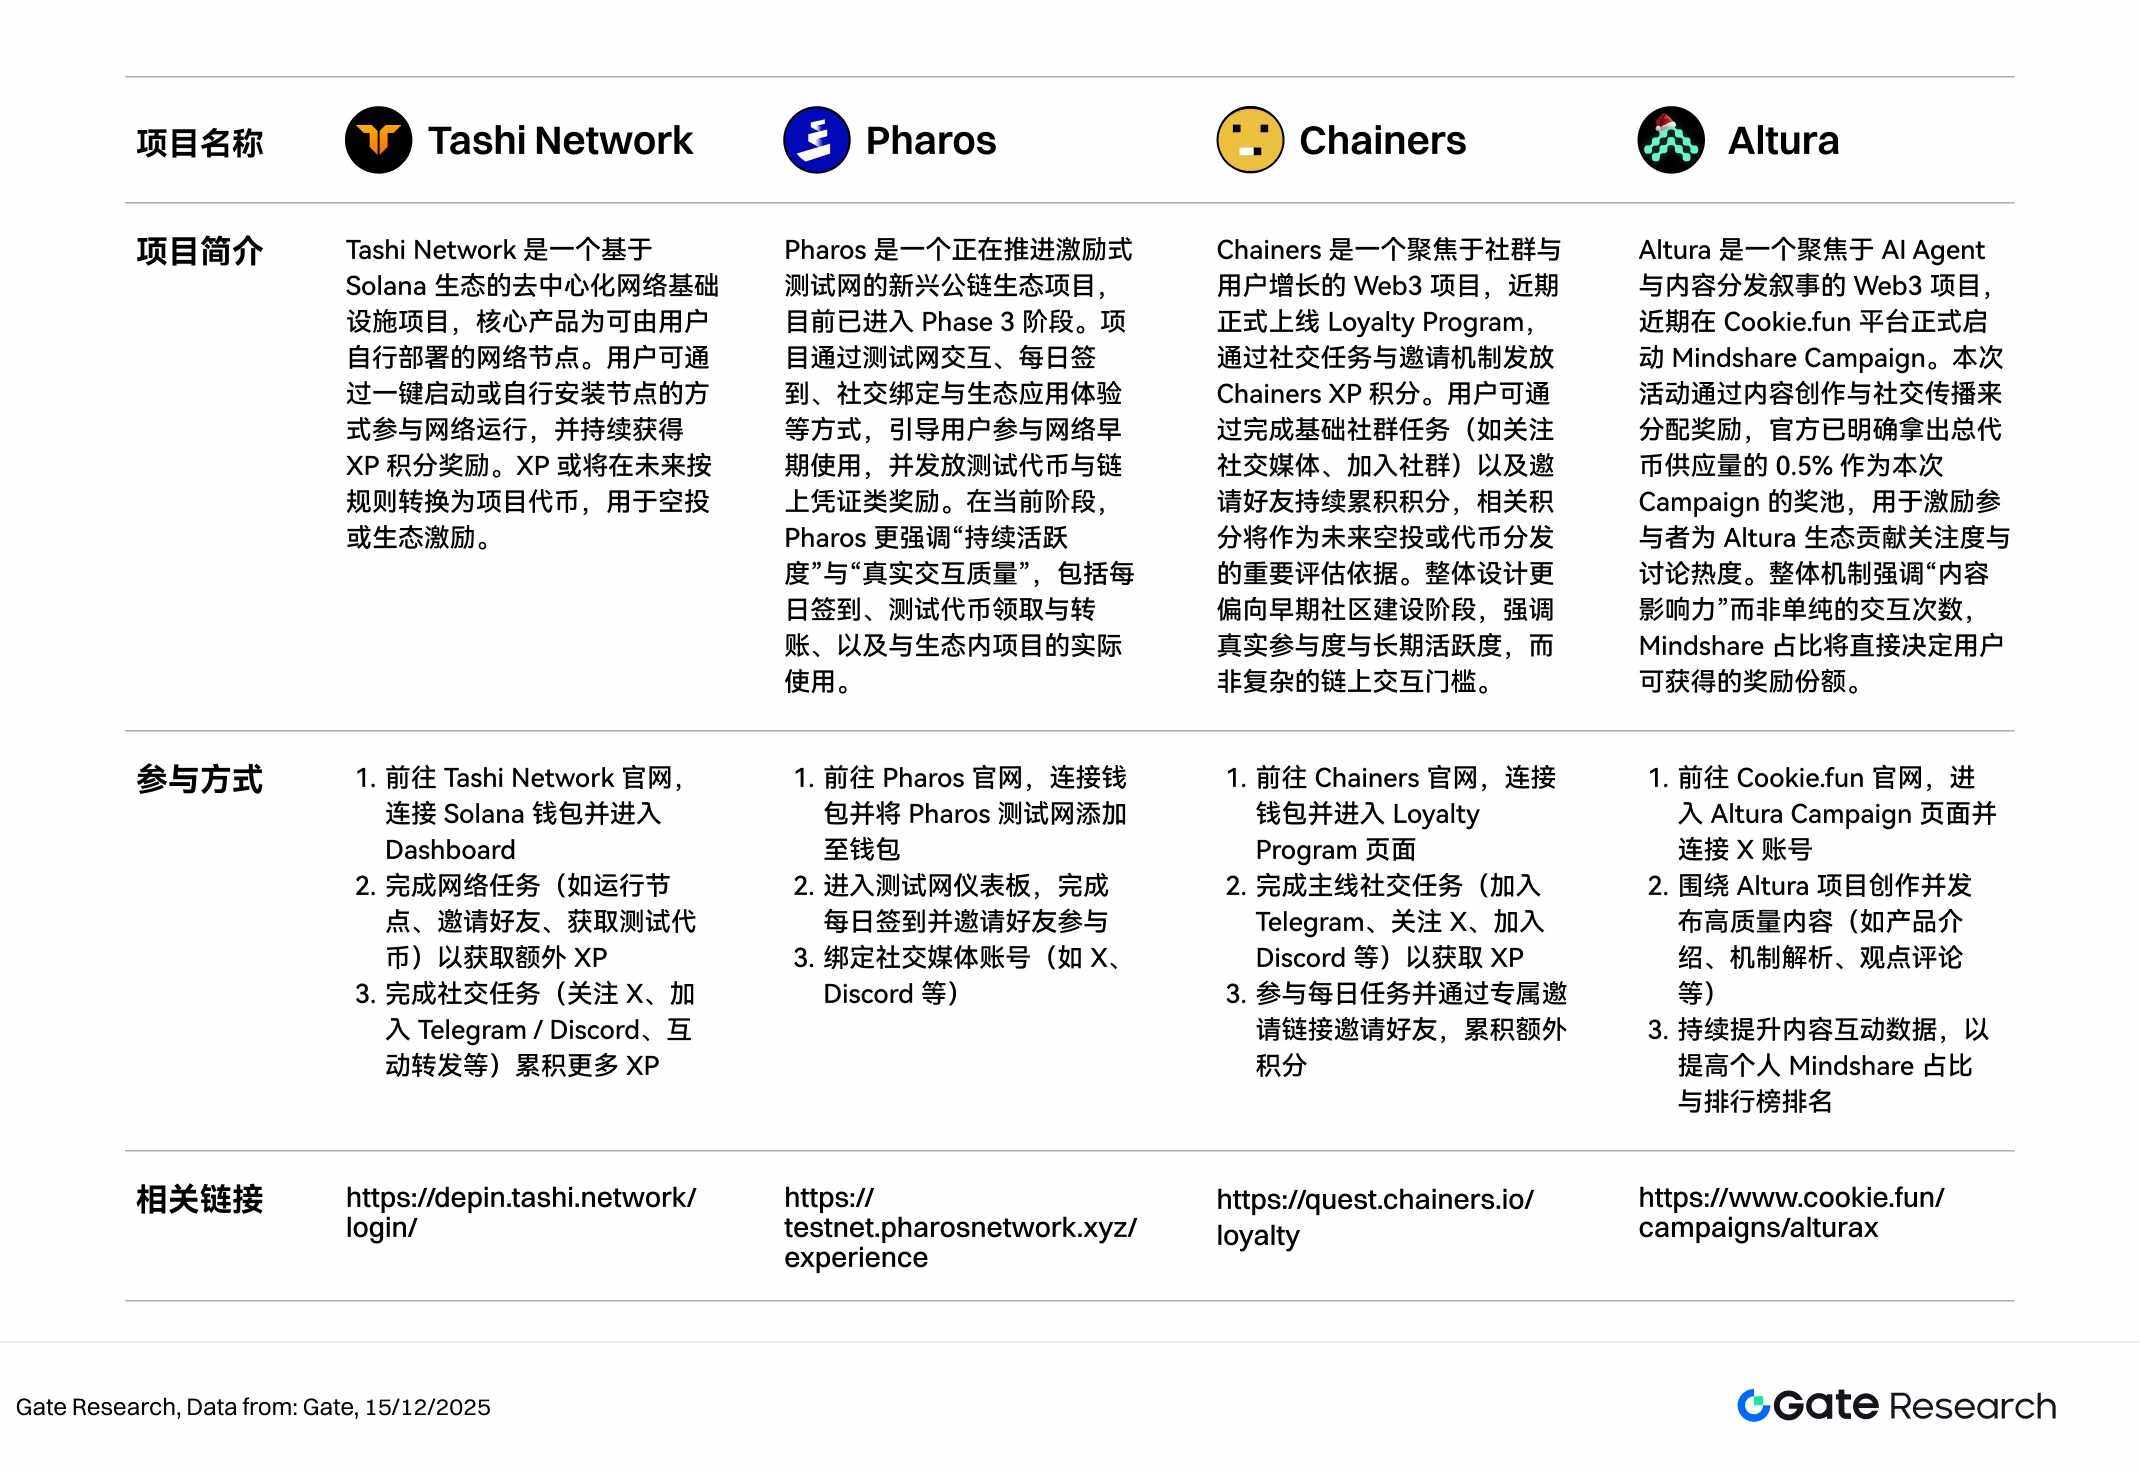
This article has compiled four airdrop and incentive projects worth focusing on from December 2 to December 15, 2025, including Tashi Network (a Solana ecosystem node-based XP Farming network), Pharos (an incentivized testnet public chain advancing to Phase 3), Chainers (a Loyalty Program centered on community tasks), and Altura (a Mindshare content incentive project based on Cookie.fun). The above projects are all in early or incentive launch stages, and users can accumulate contribution records through deploying nodes, participating in testnet interactions, completing social tasks, or creating content, laying the groundwork for potential airdrops, token distributions, or reward settlements in advance.
Tashi Network
Tashi Network is a decentralized network infrastructure project based on the Solana ecosystem, with the core product being network nodes that users can deploy themselves. Users can participate in network operation by one-click starting or manually installing nodes and continuously earn XP points as rewards. XP may be converted into project tokens in the future according to rules for airdrops or ecological incentives. 【2】
Participation Method:
Visit the Tashi Network official website, connect your Solana wallet, and enter the Dashboard.
Complete network tasks (such as running nodes, inviting friends, obtaining test tokens) to earn additional XP.
Complete social tasks (follow on X, join Telegram/Discord, interact and share, etc.) to accumulate more XP.
Pharos
Pharos is an emerging public chain ecological project that is advancing an incentivized testnet and has currently entered Phase 3. The project guides users to participate in early network usage through testnet interactions, daily check-ins, social bindings, and ecological application experiences, distributing test tokens and on-chain credential rewards. In the current phase, Pharos emphasizes "sustained activity" and "real interaction quality," including daily check-ins, test token receipt and transfers, and actual usage with projects within the ecosystem. 【3】
Participation Method:
Visit the Pharos official website, connect your wallet, and add the Pharos testnet to your wallet.
Enter the testnet dashboard, complete daily check-ins, and invite friends to participate.
Bind social media accounts (such as X, Discord, etc.).
Chainers
Chainers is a Web3 project focused on community and user growth, recently officially launching a Loyalty Program that distributes Chainers XP points through social tasks and invitation mechanisms. Users can continuously accumulate points by completing basic community tasks (such as following social media, joining communities) and inviting friends, with the relevant points serving as important evaluation criteria for future airdrops or token distributions. The overall design leans more towards the early community building stage, emphasizing genuine participation and long-term activity rather than complex on-chain interaction thresholds. 【4】
Participation Method:
Visit the Chainers official website, connect your wallet, and enter the Loyalty Program page.
Complete mainline social tasks (join Telegram, follow on X, join Discord, etc.) to earn XP.
Participate in daily tasks and invite friends through a dedicated invitation link to accumulate additional points.
Altura
Altura is a Web3 project focused on AI Agents and content distribution narratives, recently launching the Mindshare Campaign on the Cookie.fun platform. This event allocates rewards through content creation and social dissemination, with the official announcement designating 0.5% of the total token supply as the prize pool for this Campaign, aimed at incentivizing participants to contribute attention and discussion heat to the Altura ecosystem. The overall mechanism emphasizes "content influence" rather than merely the number of interactions, with the Mindshare proportion directly determining the share of rewards users can receive. 【5】
Participation Method:
Visit the Cookie.fun official website, enter the Altura Campaign page, and connect your X account.
Create and publish high-quality content related to the Altura project (such as product introductions, mechanism analyses, opinion comments, etc.).
Continuously enhance content interaction data to improve your personal Mindshare proportion and leaderboard ranking.
Tips
The airdrop plan and participation methods may be updated at any time, so users are advised to follow the official channels of the above projects for the latest information. Additionally, users should participate cautiously, be aware of risks, and conduct thorough research before participating. Gate does not guarantee the distribution of subsequent airdrop rewards.
Summary
Looking back at the period from December 2 to December 15, 2025, although the Fed lowered interest rates as expected, policy divergences and expectations of a pause suppressed risk appetite, with BTC and ETH maintaining a consolidation structure. On-chain, funds clearly concentrated on high-efficiency derivatives and trading infrastructure, with Hyperliquid leading net inflows, reflecting the market's continued bets on on-chain perpetual contracts and high-frequency trading scenarios; on the thematic level, funds significantly concentrated on high-elasticity directions, with assets related to AI applications, privacy computing, and high-volatility speculation performing prominently, such as BEAT, NIGHT, and LUNA recording significant gains; in contrast, new public chains and stablecoin narratives showed insufficient realization. The volume-price structure indicates that only a few assets like LUNA and CONSCIOUS achieved volume-price resonance, while most volume-increasing projects had limited price increases, reflecting that capital is still primarily focused on short-term rebounds and liquidity speculation. Correlation analysis further indicates that high Beta and trading-type tokens are most sensitive to sentiment, while infrastructure and mature ecological assets exhibit relatively independent trends.
Additionally, the tracked projects Tashi Network, Pharos, Chainers, and Altura are all in a clear incentive execution phase, focusing respectively on node network expansion, testnet activity accumulation, community fission and loyalty points, as well as content dissemination and mindshare competition. Overall, the incentive paths of each project are clear, and the participation thresholds are relatively controllable, allowing users to complete node operations, daily check-ins, on-chain interactions, invite friends, or publish content based on different task requirements to continuously enhance XP, points, or Mindshare weight, amplifying potential airdrop and reward distribution ratios.
References
CoinGecko, https://www.coingecko.com/
Tashi Network, https://depin.tashi.network/login/
Pharos, https://testnet.pharosnetwork.xyz/experience
Chainers, https://quest.chainers.io/loyalty
Altura, https://www.cookie.fun/campaigns/alturax
Gate Research Institute is a comprehensive blockchain and cryptocurrency research platform that provides readers with in-depth content, including technical analysis, hot insights, market reviews, industry research, trend forecasts, and macroeconomic policy analysis.
Disclaimer
Investing in the cryptocurrency market involves high risks, and users are advised to conduct independent research and fully understand the nature of the assets and products they purchase before making any investment decisions. Gate is not responsible for any losses or damages resulting from such investment decisions.
免责声明:本文章仅代表作者个人观点,不代表本平台的立场和观点。本文章仅供信息分享,不构成对任何人的任何投资建议。用户与作者之间的任何争议,与本平台无关。如网页中刊载的文章或图片涉及侵权,请提供相关的权利证明和身份证明发送邮件到support@aicoin.com,本平台相关工作人员将会进行核查。


