Welcome to the Qinglan Crypto Classroom. Today, we will analyze BTC across three timeframes, including the news aspect:
Short-term (15-minute K-line):
Wow, our BTC has recently shown a significant rebound momentum on the 15-minute chart! You see, after a slight drop around 16:15 yesterday afternoon, the price has been trying hard to climb. The latest K-line shows that the short-term moving average MA5 (87673.03) has crossed above MA10 (87623.45) and MA20 (87553), forming a beautiful initial "bullish arrangement," indicating that the buying power in the short term is strengthening. The MACD indicator has just completed a golden cross, with the DIF line (24.4753) and MACD bar (70.5196) both turning positive and moving upwards, and the energy bars are continuously expanding, which is a very clear short-term bullish signal! The RSI has also returned to around 59, neither overbought nor oversold, leaving room for further upward movement. Therefore, we can predict a bullish trend in the short term.
Mid-term (1-hour K-line & 4-hour K-line):
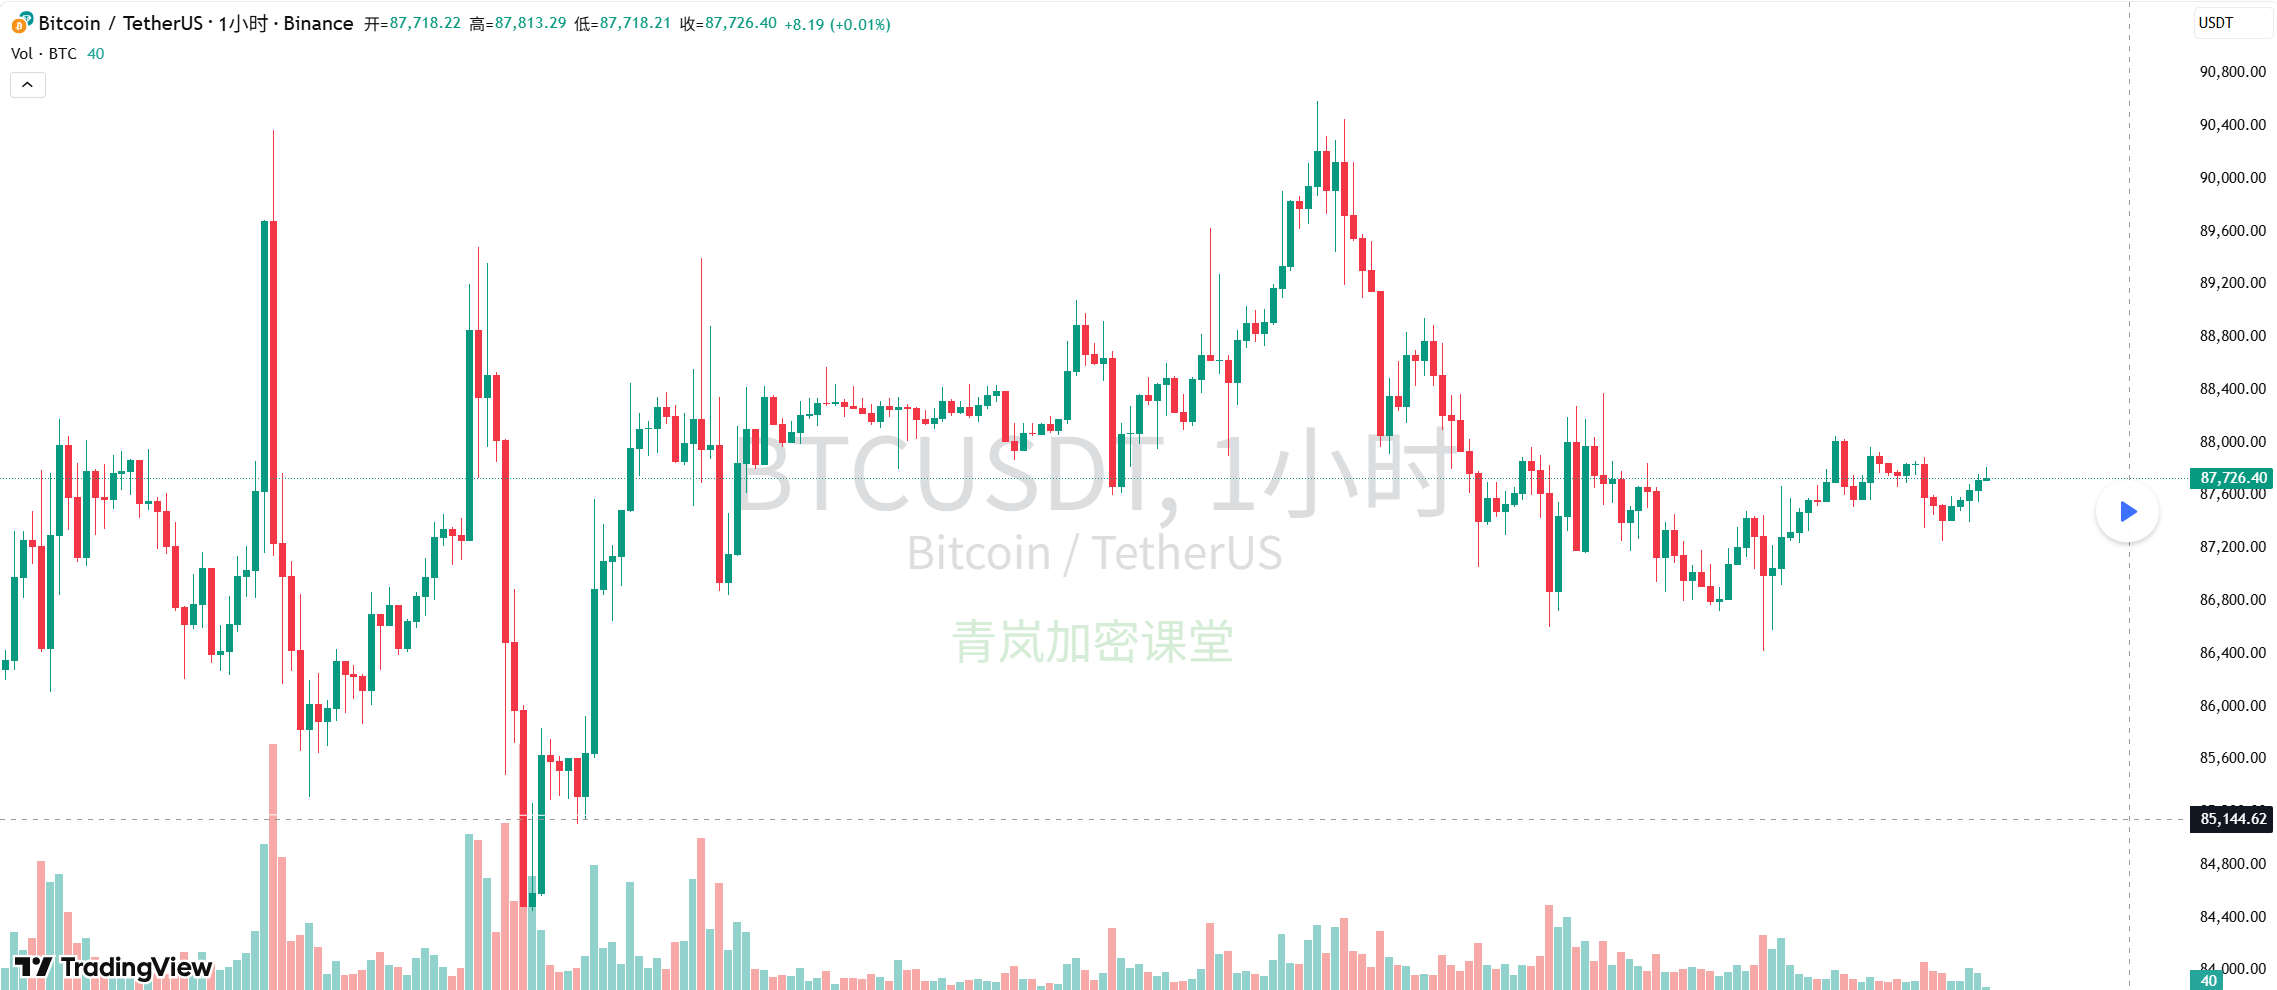
On the 1-hour chart, although the price has experienced several declines in recent days, it quickly rebounded, and is now attempting to break upwards. Although MA20 (87691.88) is still above MA5 (87636.23) and MA10 (87638.04), creating a bit of resistance, MA5 and MA10 have started to converge upwards, even showing signs of crossing upwards. The MACD shows that the DIF line (39.3904) is rapidly catching up to the DEA line (45.4648), and the MACD bar (-12.1488) is shrinking from the negative zone, indicating that the bearish strength is weakening and the bulls are accumulating momentum. This suggests that, in the mid-term, our BTC is emerging from the previous oscillating decline and attempting to build a bottom for a rebound.
Looking at the 4-hour chart, although the overall trend is still downward, the MACD indicator has given a very nice golden cross, with the DIF line (-140.9035) crossing above the DEA line (-155.8258), and the MACD bar (29.8446) has turned positive from the negative zone and is continuously expanding. This means that, in the 4-hour timeframe, bullish strength is making a strong comeback! Although the K-line body has not yet fully stabilized above MA20 (87865.16), this technical formation often indicates a decent rebound. Therefore, we predict a mid-term trend of oscillation biased upwards.
Long-term (1-day K-line):
On the long-term daily chart, BTC has been in a downward trend since October. The price has been operating below the key MA20 moving average (88944.1), facing significant resistance above. However, we do have some good news. The MACD indicator has formed a golden cross at the daily level, and the MACD bar (537.9904) has turned positive from the negative zone and is continuously expanding. This indicates that although the overall trend is still bearish, there is relatively strong rebound momentum internally, possibly building a large bottom or undergoing a deep rebound. The RSI is at 43.7, in a mid-low position, allowing for further recovery space. Therefore, in the long term, we are experiencing an oscillating rebound within a larger downward structure.
News aspect:
Today, our news can be described as a mix of good and bad!
Negative aspects: The expiration of $23 billion in Bitcoin options and continuous outflows of ETF funds will bring selling pressure in the short term; the weak support in the $70,000 to $80,000 range for Bitcoin and the daily RSI breaking below the long-term moving average both indicate long-term correction risks. If the Federal Reserve maintains high interest rates, BTC could even drop to $70,000.
Positive aspects: Japan's Metaplanet company has been approved to increase its Bitcoin holdings, which is a long-term positive signal for institutions. Jim Cramer is 100% bearish on Bitcoin, which is a typical "contrarian indicator," often meaning the market will move in the opposite direction! The decoupling of Bitcoin from tech stocks indicates that it is developing its own independent market. Two major exchanges in Russia are preparing to launch regulated cryptocurrency trading in 2026, and Trip.com has integrated stablecoin payments, all of which are significant positives for the long-term development and popularization of cryptocurrencies.
Comprehensive prediction and trading strategy:
Overall, our BTC is currently in a phase of short-term bullishness, mid-term oscillation biased upwards, but still seeking a rebound within a larger downward trend in the long term. The technical indicators for the short and mid-term show relatively positive buying signals, especially the golden cross of the MACD and the growth of the energy bars. This momentum may push the price to challenge resistance levels of 89,000-90,000 or even higher.
However, we must not overlook the long-term downward pressure and the risk warnings from the news, especially the expiration of $23 billion in options and ETF fund outflows, which may bring correction pressure to the market in the short term. Moreover, the daily MA moving average arrangement has not fully recovered, and the weak support in the $70,000 to $80,000 range is also a risk to be cautious about.
Trading strategy:
- Short-term traders: Focus on the upward momentum in the 15-minute and 1-hour charts, and try to take long positions near support levels (such as the 87500-87600 area) with light positions, setting stop-loss below recent lows. Target around 88000-88200. But be quick in and out, as there is still pressure above.
- Mid to long-term traders: This is not a clear trend reversal point, more of a rebound within a downward trend. It is advisable to wait and see, waiting for the price to effectively break above the daily MA20 (around 89000) and stabilize, or wait for a pullback to stronger support areas (such as 84000-85000) before considering positioning. If the price can stabilize above 90000 and the ETF fund outflow situation improves, consider entering with a small position. But be sure to control risk, as long-term risk warnings are still present.
Key support levels: 87500 (short), 87000-87200 (mid), 84000-85000 (long).
Key resistance levels: 88000-88200 (short), 89000-90000 (mid), 92000-93000 (long).
Possible reversal patterns: In the short term, if the price can break above 88200 and stabilize, it may form a small W-bottom reversal pattern. In the mid to long term, the golden cross of the MACD at the daily level is a bullish signal, and if it breaks through key resistance with significant trading volume, it could form a larger trend reversal. However, we are not at that level yet, so we must remain cautious.
Finally, here’s a trading quote for everyone: Seeking opportunities in uncertainty is the instinct of a trader; maintaining reverence in the face of risk is the wisdom of a trader!
免责声明:本文章仅代表作者个人观点,不代表本平台的立场和观点。本文章仅供信息分享,不构成对任何人的任何投资建议。用户与作者之间的任何争议,与本平台无关。如网页中刊载的文章或图片涉及侵权,请提供相关的权利证明和身份证明发送邮件到support@aicoin.com,本平台相关工作人员将会进行核查。